

Dihydroorotate dehydrogenase Inhibitors Target c-Myc and Arrest Melanoma, Myeloma and Lymphoma cells at S-phase
- PMID: 28928900
- PMCID: PMC5604460
- DOI: 10.7150/jca.14835
Dihydroorotate dehydrogenase Inhibitors Target c-Myc and Arrest Melanoma, Myeloma and Lymphoma cells at S-phase
Abstract
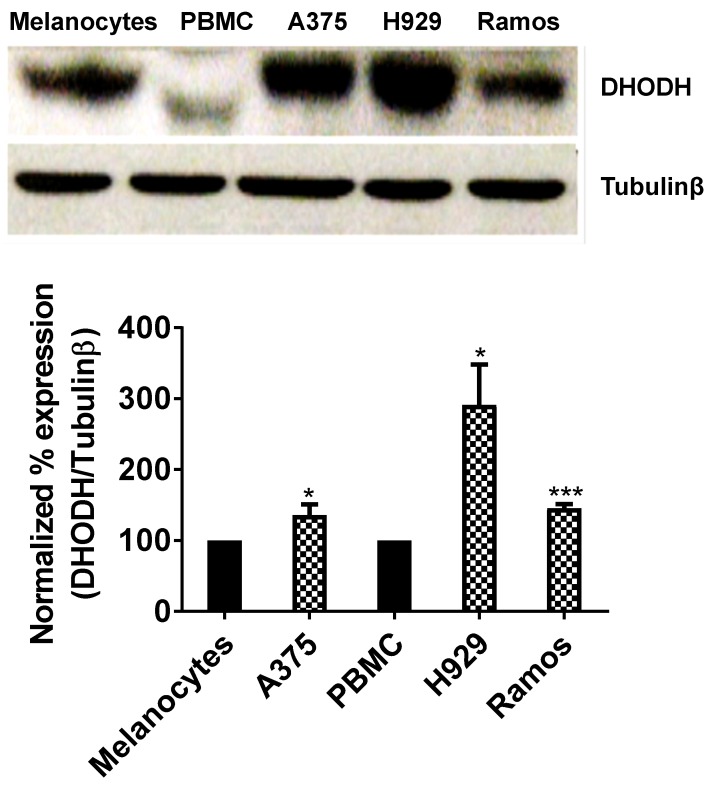
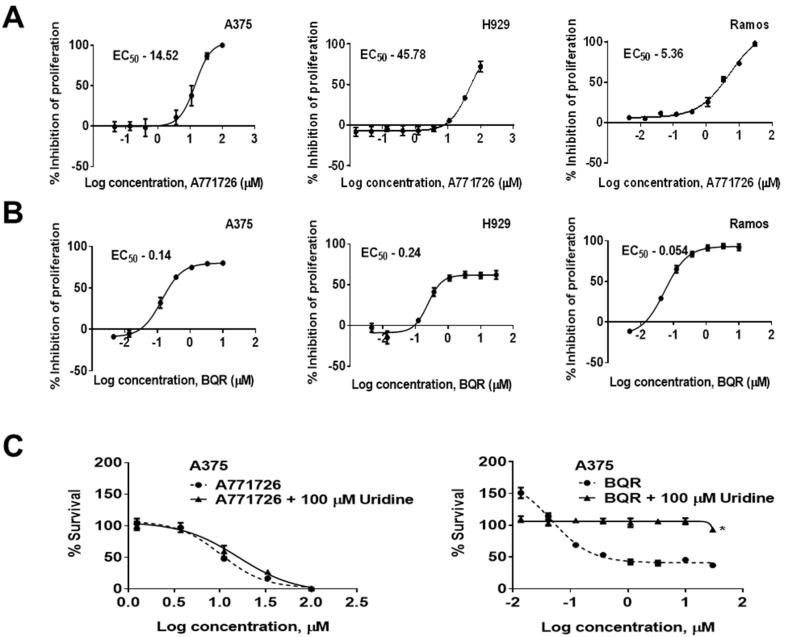
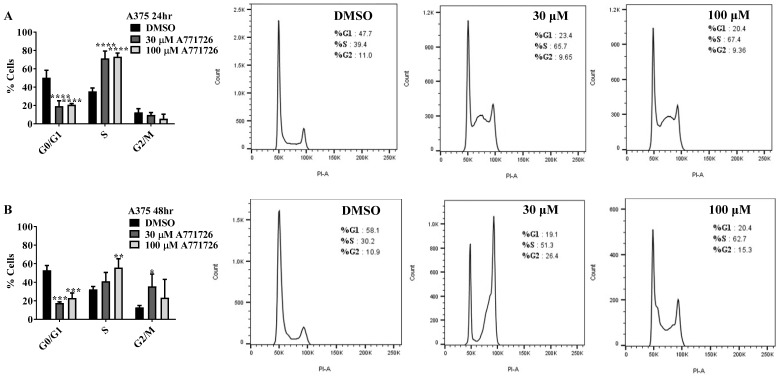
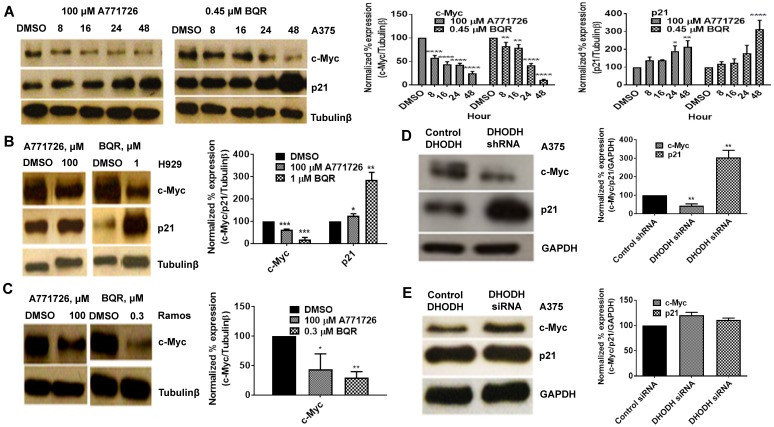
Dihydroorotate dehydrogenase (DHODH) is a rate-limiting enzyme in the de novo biosynthesis pathway of pyrimidines. Inhibition of this enzyme impedes cancer cell proliferation but the exact mechanisms of action of these inhibitors in cancer cells are poorly understood. In this study, we showed that cancer cells, namely melanoma, myeloma and lymphoma overexpressed DHODH protein and treatment with A771726 and Brequinar sodium resulted in cell cycle arrest at S-phase. Transfection with DHODH shRNA depleted DHODH protein expression and impeded the proliferation of melanoma cells. shRNA knockdown of DHODH in combination with DHODH inhibitors further reduced the cancer cell proliferation, suggesting that knockdown of DHODH had sensitized the cells to DHODH inhibitors. Cell cycle regulatory proteins, c-Myc and its transcriptional target, p21 were found down- and up-regulated, respectively, following treatment with DHODH inhibitors in melanoma, myeloma and lymphoma cells. Interestingly, knockdown of DHODH by shRNA had also similarly affected the expression of c-Myc and p21 proteins. Our findings suggest that DHODH inhibitors induce cell cycle arrest in cancer cells via additional DHODH-independent pathway that is associated with p21 up-regulation and c-Myc down-regulation. Hence, DHODH inhibitors can be explored as potential therapeutic agents in cancer therapy.
Keywords: A771726; Brequinar; DHODH shRNA; Ramos; p21..
Conflict of interest statement
Competing Interests: The authors have declared that no competing interest exists.
Figures


Similar articles
-
Dihydroorotate Dehydrogenase Inhibitors Promote Cell Cycle Arrest and Disrupt Mitochondria Bioenergetics in Ramos Cells.Curr Pharm Biotechnol. 2020;21(15):1654-1665. doi: 10.2174/1389201021666200611113734. Curr Pharm Biotechnol. 2020. PMID: 32525770
-
Dihydroorotate dehydrogenase (DHODH) inhibitors affect ATP depletion, endogenous ROS and mediate S-phase arrest in breast cancer cells.Biochimie. 2017 Apr;135:154-163. doi: 10.1016/j.biochi.2017.02.003. Epub 2017 Feb 11. Biochimie. 2017. PMID: 28196676
-
Revisiting the role of dihydroorotate dehydrogenase as a therapeutic target for cancer.Pharmacol Ther. 2019 Mar;195:111-131. doi: 10.1016/j.pharmthera.2018.10.012. Epub 2018 Oct 19. Pharmacol Ther. 2019. PMID: 30347213 Review.
-
Inactivation/deficiency of DHODH induces cell cycle arrest and programed cell death in melanoma.Oncotarget. 2017 Jul 19;8(68):112354-112370. doi: 10.18632/oncotarget.19379. eCollection 2017 Dec 22. Oncotarget. 2017. PMID: 29348830 Free PMC article.
-
Recent developments in the medicinal chemistry and therapeutic potential of dihydroorotate dehydrogenase (DHODH) inhibitors.Mini Rev Med Chem. 2011 Oct;11(12):1039-55. doi: 10.2174/138955711797247707. Mini Rev Med Chem. 2011. PMID: 21861807 Review.
Cited by
-
Elevated DHODH expression promotes cell proliferation via stabilizing β-catenin in esophageal squamous cell carcinoma.Cell Death Dis. 2020 Oct 15;11(10):862. doi: 10.1038/s41419-020-03044-1. Cell Death Dis. 2020. PMID: 33060568 Free PMC article.
-
Potential Anticancer Agents against Melanoma Cells Based on an As-Synthesized Thiosemicarbazide Derivative.Biomolecules. 2022 Jan 18;12(2):151. doi: 10.3390/biom12020151. Biomolecules. 2022. PMID: 35204651 Free PMC article.
-
The Synergism between DHODH Inhibitors and Dipyridamole Leads to Metabolic Lethality in Acute Myeloid Leukemia.Cancers (Basel). 2021 Feb 28;13(5):1003. doi: 10.3390/cancers13051003. Cancers (Basel). 2021. PMID: 33670894 Free PMC article.
-
Mechanisms of S-phase arrest and mitochondrial dysfunction in complex III by DHODH inhibitors in tumorigenic TNBC cells.Histochem Cell Biol. 2024 Nov 18;163(1):3. doi: 10.1007/s00418-024-02339-0. Histochem Cell Biol. 2024. PMID: 39557682
-
Lupeol inhibits growth and migration in two human colorectal cancer cell lines by suppression of Wnt-β-catenin pathway.Onco Targets Ther. 2018 Nov 9;11:7987-7999. doi: 10.2147/OTT.S183925. eCollection 2018. Onco Targets Ther. 2018. Retraction in: Onco Targets Ther. 2020 Aug 20;13:8371. doi: 10.2147/OTT.S276550. PMID: 30519040 Free PMC article. Retracted.
References
-
- Vander Heiden MG. Targeting cancer metabolism: a therapeutic window opens. Nature reviews Drug discovery. 2011;10(9):671–84. - PubMed
-
- Tennant DA, Duran RV, Gottlieb E. Targeting metabolic transformation for cancer therapy. Nature reviews Cancer. 2010;10(4):267–77. - PubMed
-
- Evans DR, Guy HI. Mammalian pyrimidine biosynthesis: fresh insights into an ancient pathway. The Journal of biological chemistry. 2004;279(32):33035–8. - PubMed
LinkOut - more resources
Full Text Sources
Other Literature Sources
