. 2016 Sep 16:5:2333.
doi: 10.12688/f1000research.9611.3. eCollection 2016.

Revisiting inconsistency in large pharmacogenomic studies

Affiliations

Revisiting inconsistency in large pharmacogenomic studies

Zhaleh Safikhani et al. F1000Res. .

Abstract

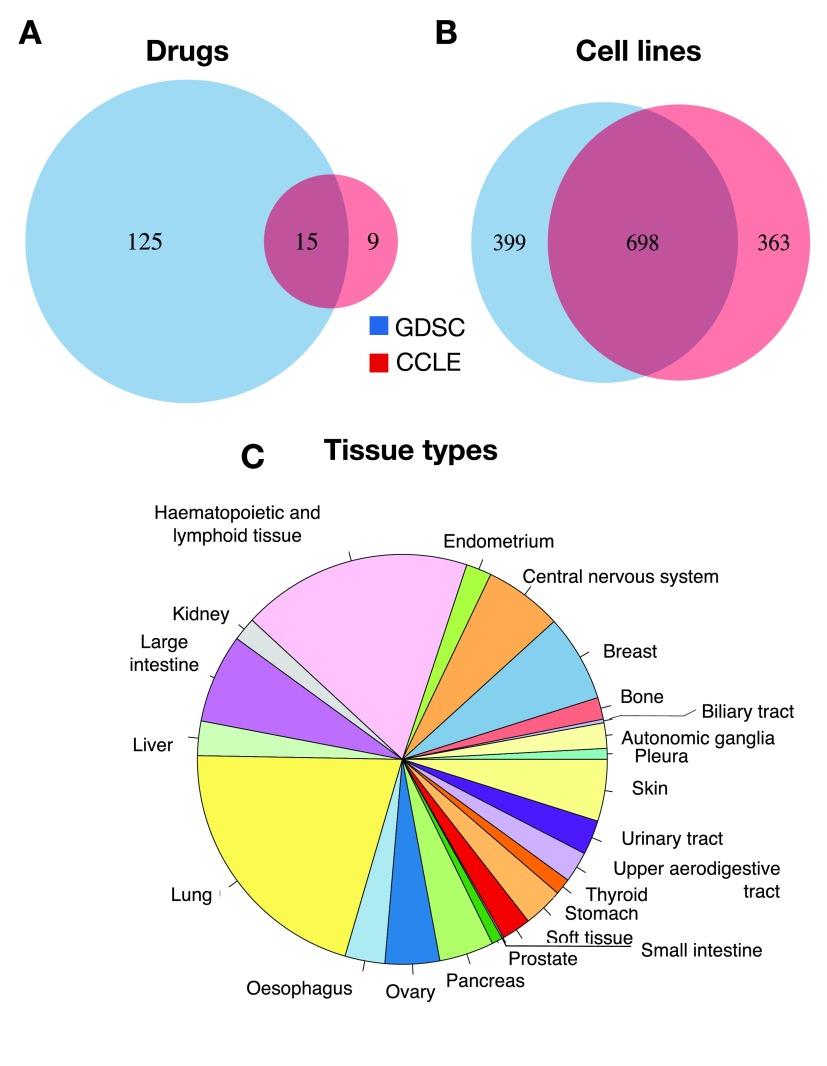
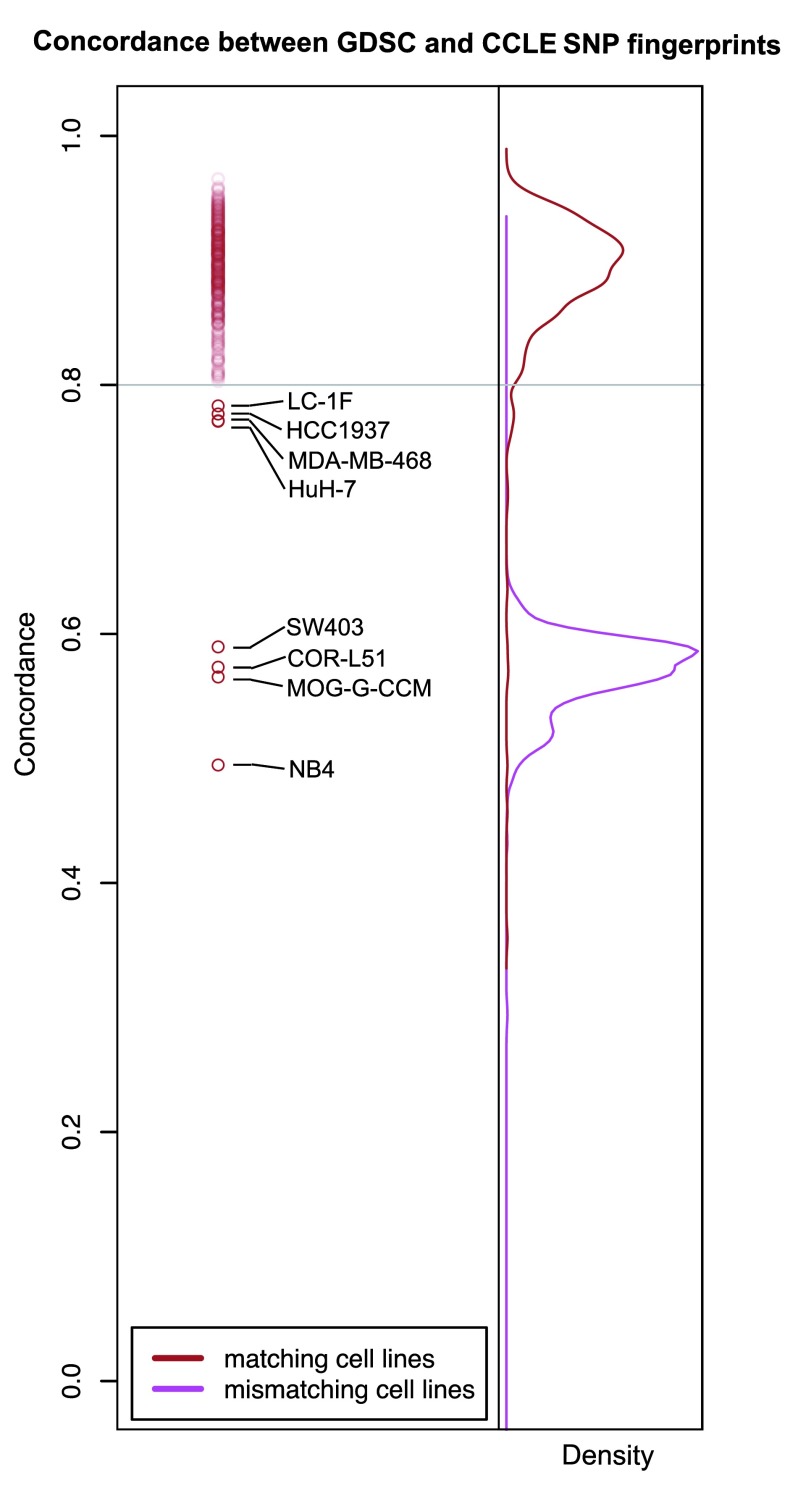
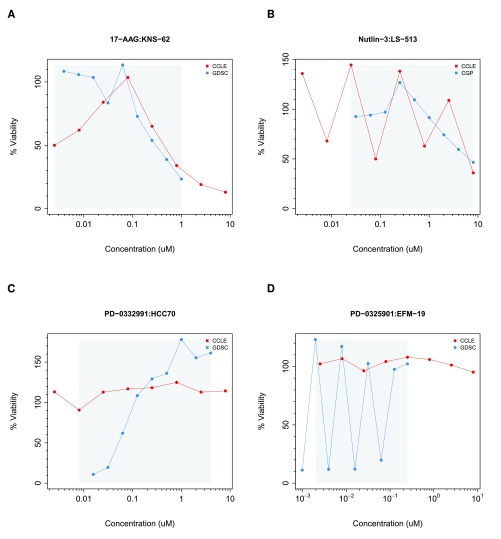
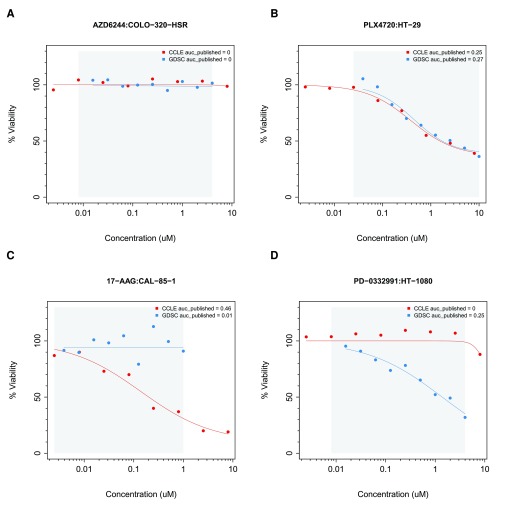
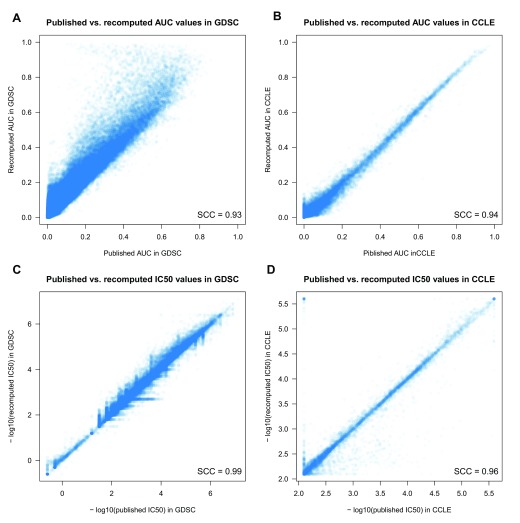
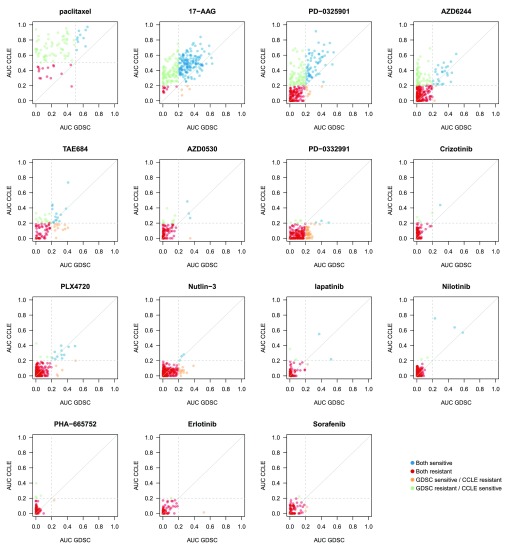
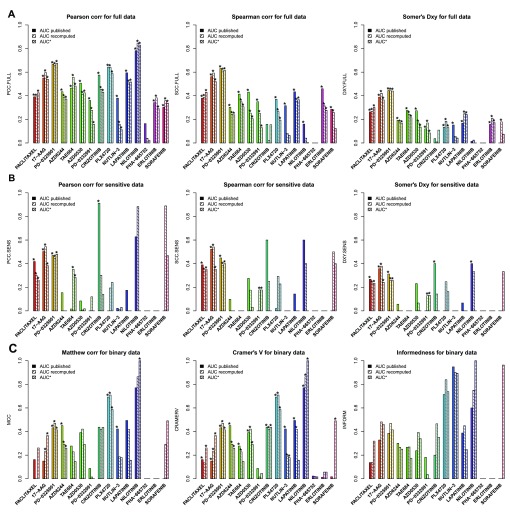
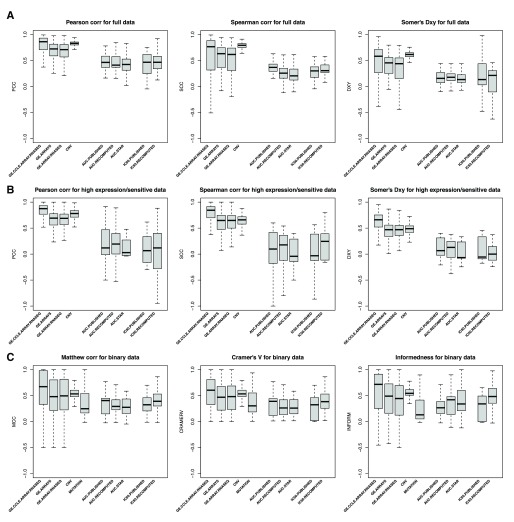
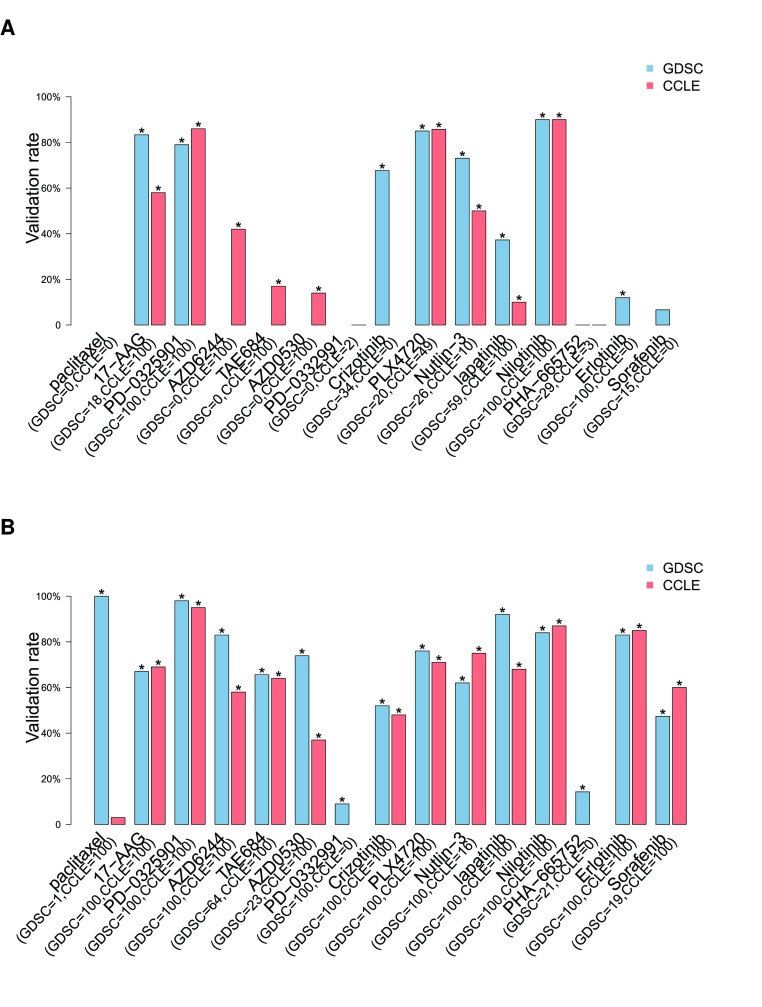
In 2013, we published a comparative analysis of mutation and gene expression profiles and drug sensitivity measurements for 15 drugs characterized in the 471 cancer cell lines screened in the Genomics of Drug Sensitivity in Cancer (GDSC) and Cancer Cell Line Encyclopedia (CCLE). While we found good concordance in gene expression profiles, there was substantial inconsistency in the drug responses reported by the GDSC and CCLE projects. We received extensive feedback on the comparisons that we performed. This feedback, along with the release of new data, prompted us to revisit our initial analysis. We present a new analysis using these expanded data, where we address the most significant suggestions for improvements on our published analysis - that targeted therapies and broad cytotoxic drugs should have been treated differently in assessing consistency, that consistency of both molecular profiles and drug sensitivity measurements should be compared across cell lines, and that the software analysis tools provided should have been easier to run, particularly as the GDSC and CCLE released additional data. Our re-analysis supports our previous finding that gene expression data are significantly more consistent than drug sensitivity measurements. Using new statistics to assess data consistency allowed identification of two broad effect drugs and three targeted drugs with moderate to good consistency in drug sensitivity data between GDSC and CCLE. For three other targeted drugs, there were not enough sensitive cell lines to assess the consistency of the pharmacological profiles. We found evidence of inconsistencies in pharmacological phenotypes for the remaining eight drugs. Overall, our findings suggest that the drug sensitivity data in GDSC and CCLE continue to present challenges for robust biomarker discovery. This re-analysis provides additional support for the argument that experimental standardization and validation of pharmacogenomic response will be necessary to advance the broad use of large pharmacogenomic screens.

Keywords: cancer; consistency; drug sensitivity; pharmacogenomic agreement; pharmacogenomics.


Conflict of interest statement

Competing interests: No competing interests were disclosed.

Figures

Figure 1.
Figure 1.. Analysis design.
GDSC: Genomics of Drug Sensitivity in Cancer; AE: ArrayExpress; Cosmic: Catalogue of Somatic Mutations in Cancer; CGHub: Cancer Genomics Hub; CCLE: Cancer Cell Line Encyclopedia.
Figure 2.
Figure 2.. Intersection between GDSC and CCLE.
Overlap of ( A) drugs, ( B) cell lines and ( C) tissue types.
Figure 3.
Figure 3.. SNP fingerprinting between cancer cell lines screened in GDSC and CCLE.
Figure 4.
Figure 4.. Examples of noisy drug dose-response curves identified during the filtering process in GDSC and CCLE.
The grey area represents the common concentration range between studies. ( A) JNS-62 cell line treated with 17-AAG; ( B) LS-513 treated with nutlin-3; ( C) HCC70 cell lines treated with PD-0332991; and ( D) EFM-19 cell line treated with PD-0325901. Parameters have been set to ∈ = 25 and ρ = 0.80 ( Supplementary methods). Red curve in ( A) is the noisy due to violation of constraint 2, redcurve in ( B) due to violation of constraint 1, blue curve in ( C) is the noisy due to violation of constraint 2, blue curve in ( B) due to violation of constraint 1 ( Supplementary methods).
Figure 5.
Figure 5.
Examples of ( A, B) consistent and ( C, D) inconsistent drug dose-response curves in GDSC and CCLE. The grey area represents the common concentration range between studies. ( A) COLO-320-HSR cell line treated with AZD6244; ( B) HT-29 treated with PLX4720; ( C) CAL-85-1 cell lines treated with 17-AAG; and ( D) HT-1080 cell line treated with PD-0332991.
Figure 6.
Figure 6.. Comparison between published and recomputed drug sensitivity values between GDSC and CCLE.
( A) AUC in GDSC; ( B) AUC in CCLE; ( C) IC 50 in GDSC; and ( D) IC 50 in CCLE. SCC stands for Spearman correlation coefficient.
Figure 7.
Figure 7.. Comparison of AUC values as published in GDSC and CCLE.
Cell lines with AUC >0.2 were considered as sensitive (AUC >0.4 for paclitaxel). In case of perfect consistency, all points would lie on the grey diagonal. The drugs are ranked based on their category: broad effect (AZD6244, PD–0325901, 17-AAG and paclitaxel), narrow effect (nilotinib, lapatinib, nutlin-3, PLX4720, crizotinib, PD-0332991, AZD0530, and TAE684) and no/little effect (sorafenib, erlotinib and PHA–665752).
Figure 8.
Figure 8.. Consistency of AUC values as published and recomputed within PharmacoGx, with AUC* being computed using the common concentration range between GDSC and CCLE.
The consistency is computed across cell lines, i.e., for each drug, a vector of drug sensitivity measures (AUC, IC 50,...) is extracted from GDSC and CCLE and compared. ( A) Consistency assessed using the full set of cancer cell lines screened in both studies. ( B) Consistency assessed using only sensitive cell lines (AUC > 0.2 and AUC > 0.4 for targeted and cytotoxic drugs, respectively). ( C) Consistently assessed by discretizing the drug sensitivity data using the aforementioned cutoffs for AUC. PCC: Pearson correlation coefficient; SCC: Spearman rank-based correlation coefficient; DXY: Somers’ Dxy rank correlation; MCC: Matthews correlation coefficient; CRAMERV: Cramer’s V statistic; INFORM: Informedness. The symbol ’*’ indicates whether the consistency is statistically significant (p<0.05).
Figure 9.
Figure 9.. Consistency of molecular profiles (gene expression, copy number variation and mutation) and drug sensitivity data between GDSC and CCLE using multiple consistency measures.
( A) Consistency assessed using the full set of cancer cell lines screened in both studies. ( B) Consistency assessed using only sensitive cell lines (AUC >0.2 / IC 50 <1 µM and AUC >0.4 / IC 50 <10 µM for targeted and cytotoxic drugs, respectively). ( C) Consistently assessed by discretizing the molecular and drug sensitivity data. GE.CCLE.ARRAY.RNASEQ: Consistency between gene expression data generated using Affymetrix HG-U133PLUS2 microarray and Illumina RNA-seq platforms within CCLE; GE.ARRAYS: Consistency between gene expression data generated using Affymetrix HG-U133A and HG-U133PLUS2 microarray platforms in GDSC and CCLE, respectively; GE.ARRAY.RNASEQ: Consistency between gene expression data generated using Affymetrix HG-U133A microarray and Illumina RNA-seq platforms in GDSC and CCLE, respectively; CNV: Consistency of copy number variation data in CCLE and GDSC, respectively; MUTATION: Consistency of mutation profiles in CCLE and GDSC, respectively. PCC: Pearson correlation coefficient; SCC: Spearman rank-based correlation coefficient; DXY: Somers’ Dxy rank correlation; MCC: Matthews correlation coefficient; CRAMERV: Cramer’s V statistic; INFORM: Informedness.
Figure 10.
Figure 10.. Proportion of gene-drug associations identified in a discovery set (top 100 gene-drug associations as ranked by p-values and FDR < 5%) and validated in an independent validation dataset.
In blue and red are the gene-drug associations identified in GDSC and CCLE, respectively. Associations are identified using molecular profiles including gene expression, mutation and copy number variation data as input and ( A) continuous published AUC values as output in a linear model using only common cell lines or ( B) all cell lines. The number of selected gene-drugs associations in each datasets is provided in parentheses. The symbol ’*’ represents the significance of the proportion of validated gene-drug associations, computed as the frequency of 1000 random subsets of markers of the same size having equal or greater validation rate compared to the observed rate.

References

    1. Garnett MJ, Edelman EJ, Heidorn SJ, et al. : Systematic identification of genomic markers of drug sensitivity in cancer cells. Nature. 2012;483(7391):570–5. 10.1038/nature11005 - DOI - PMC - PubMed
    1. Barretina J, Caponigro G, Stransky N, et al. : The Cancer Cell Line Encyclopedia enables predictive modelling of anticancer drug sensitivity. Nature. 2012;483(7391):603–7. 10.1038/nature11003 - DOI - PMC - PubMed
    1. Papillon-Cavanagh S, De Jay N, Hachem N, et al. : Comparison and validation of genomic predictors for anticancer drug sensitivity. J Am Med Inform Assoc. 2013;20(4):597–602. 10.1136/amiajnl-2012-001442 - DOI - PMC - PubMed
    1. Dong Z, Zhang N, Li C, et al. : Anticancer drug sensitivity prediction in cell lines from baseline gene expression through recursive feature selection. BMC Cancer. 2015;15:489. 10.1186/s12885-015-1492-6 - DOI - PMC - PubMed
    1. Jang IS, Neto EC, Guinney J, et al. : Systematic assessment of analytical methods for drug sensitivity prediction from cancer cell line data. Pac Symp Biocomput. 2014;63–74. 10.1142/9789814583220_0007 - DOI - PMC - PubMed

LinkOut - more resources