Review
. 2017:2017:3820191.
doi: 10.1155/2017/3820191. Epub 2017 Aug 27.

Imaging Diagnosis of Right Ventricle Involvement in Chagas Cardiomyopathy

Affiliations
Review

Imaging Diagnosis of Right Ventricle Involvement in Chagas Cardiomyopathy

Minna M D Romano et al. Biomed Res Int. 2017.

Abstract

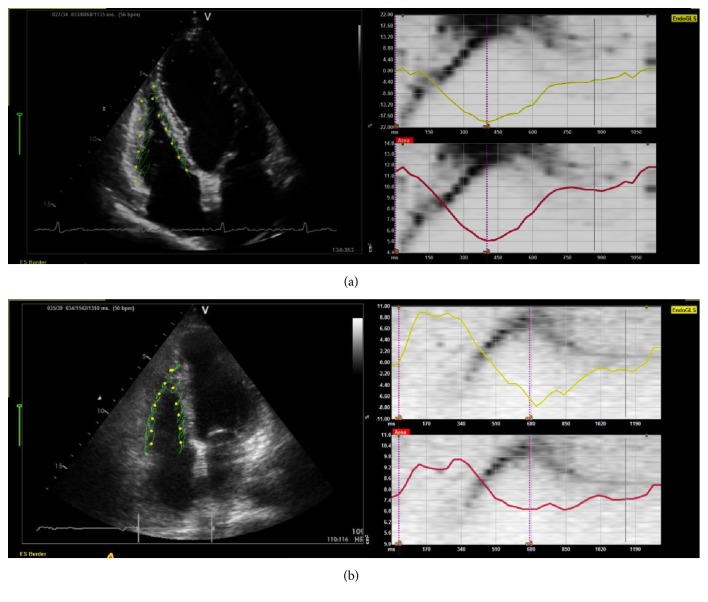
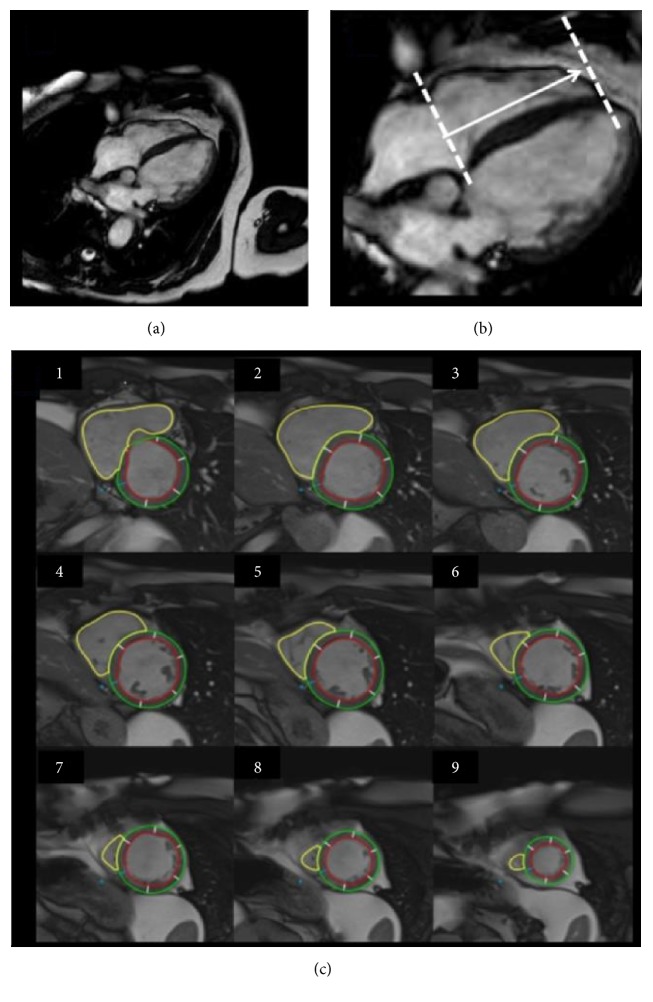
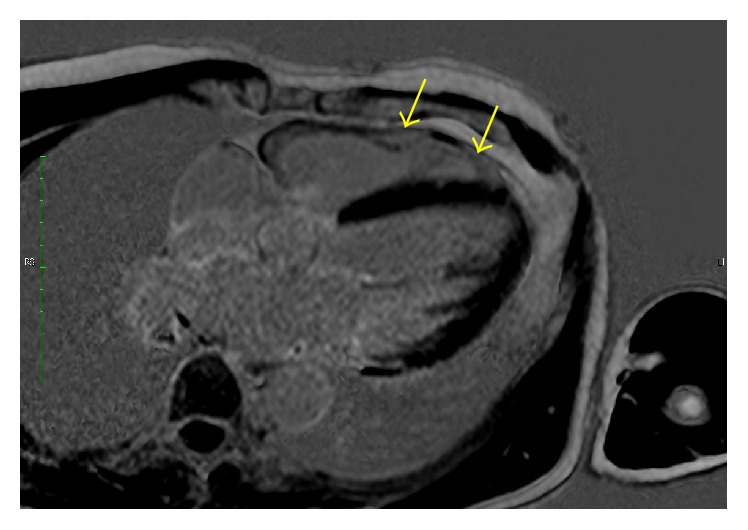
Right ventricle (RV) is considered a neglected chamber in cardiology and knowledge about its role in cardiac function was mostly focused on ventricular interdependence. However, progress on the understanding of myocardium diseases primarily involving the RV led to a better comprehension of its role in health and disease. In Chagas disease (CD), there is direct evidence from both basic and clinical research of profound structural RV abnormalities. However, clinical detection of these abnormalities is hindered by technical limitations of imaging diagnostic tools. Echocardiography has been a widespread and low-cost option for the study of patients with CD but, when applied to the RV assessment, faces difficulties such as the absence of a geometrical shape to represent this cavity. More recently, the technique has evolved to a focused guided RV imaging and myocardial deformation analysis. Also, cardiac magnetic resonance (CMR) has been introduced as a gold standard method to evaluate RV cavity volumes. CMR advantages include precise quantitative analyses of both LV and RV volumes and its ability to perform myocardium tissue characterization to identify areas of scar and edema. Evolution of these cardiac diagnostic techniques opened a new path to explore the pathophysiology of RV dysfunction in CD.


Figures

Figure 1
Figure 1
Histological analysis (HE) depicting normal cardiac fibers with regular interstitial space in the right (a) and left (b) ventricles. In a T. cruzi-infected mice, with 30 days post-Chagas infection (acute phase), there is an intense and diffuse myocarditis characterized by lymphomononuclear interstitial infiltrate (white arrow), multiple ruptured or unruptured pseudocysts (black arrow), and enlargement of the interstitial space ((c) and (d)). After 100 days of infection (chronic phase), the number of the lymphomononuclear inflammatory cells became significantly reduced and no parasites are detected ((e) and (f)). In this study, the numbers of interstitial mononuclear cells were quantified in both right and left ventricles. The number of cells was markedly increased at 30 days of infection as compared to 100 days of infection, mostly in the right ventricle ((g) and (h)). Bars = 100 μm, n = 6/day/group. HE = Hematoxylin-Eosin stain. Adapted from [11]. Adapted with permission from Elsevier, license number 4120251034702.
Figure 2
Figure 2
Interstitial collagen (Picrosirius red-stained sections) in controls and T. cruzi-infected mice. (a) The bar graphs show the mean fraction of fibrosis (%) in both right (left graph) and left ventricles (right graph). There is a tendency towards increased amount of collagen in acute phase (30 dpi) in both ventricles. The mean amount of collagen is significantly increased in the RV (600% higher) and LV (62% higher) in chronic phase (100 dpi). (b) Representative images illustrate these results clearly showing that the collagen increase was mainly perimysial. Bars = 50 μm, n = 6/day/group. Adapted from [11]. Adapted with permission from Elsevier, license number 4120251034702.
Figure 3
Figure 3
Schematic representation of the myocardial fibrosis patterns in control myocardium (normal) and in chronic Chagas' heart disease (Chagas' HD). From [12]. Adapted with permission from Elsevier, license number 4120260350349.
Figure 4
Figure 4
Echocardiographic conventional parameters of right ventricle (RV) evaluation. (a) Tricuspid Annular Peak Systolic Excursion (TAPSE) from M-mode. (b) Systolic wave velocity (S′) of the lateral portion of tricuspid annulus; (c) area measurements in diastole and systole from bidimensional images to calculate fractional area change (FAC); (d) time measurements from tissue Doppler curves in tricuspid annulus to calculate myocardial performance index (MPI). [13]. Adapted with permission from Elsevier, license number 4143761084119.
Figure 5
Figure 5
Myocardial deformation analysis of right ventricle (RV) from speckle tracking echocardiography. Strain analysis of RV from representative CC patients demonstrating preserved systolic function in Panel (a) (GLS: −17.8%, FAC: 55.7%) and reduced systolic function in Panel (b) (GLS: −8.4%, FAC: 10.5). Both patients have preserved left ventricle ejection fraction. Graphics in each panel represent myocardial strain in % (superior right, yellow trace) and RV area change in cm2 (inferior right, red trace). RV: right ventricle; EndoGLS: Endocardial Global Longitudinal Strain; FAC: Fractional Area Change; es: end-systolic time.
Figure 6
Figure 6
Volumetric assessment of the RV using CMR. Image acquired from cine-resonance using pulse sequences SSFP (Steady-State Free Precession), showing the tomographic slicing of RV long-axis and limiting adjustments to transversal views from base to apex ((a) and (b)). Yellow lines shows delineation of endocardial borders of RV (c) to further calculation of volumes. Adapted from Moreira, HT (2015). “Análise ecocardiográfica do ventrículo direito na doença de Chagas: estudo comparativo com a ressonância magnética cardíaca” (Doctoral Dissertation), University of São Paulo, Ribeirão Preto, Brazil, Circ Cardiovasc Imaging, 2017, 10:e005571. Adapted with permission from Wolters Kluwer, license number 4143770060198.
Figure 7
Figure 7
Four-chamber slice using CMR with LGE (late gadolinium enhancement) sequence in a patient with Chagas cardiomyopathy. Distinct extensive areas of fibrosis (white signal) (yellow arrows) are seen in the right ventricle free wall. Right ventricle dimensions are still within normal limits. Discrete isolated areas of fibrosis are also noted in the left ventricle.

References

    1. Weber K. T., Janicki J. S., Shroff S., Fishman A. P. Contractile mechanics and interaction of the right and left ventricles. The American Journal of Cardiology. 1981;47(3):686–695. doi: 10.1016/0002-9149(81)90556-7. - DOI - PubMed
    1. Janicki J. S., Weber K. T. Factors influencing the diastolic pressure-volume relation of the cardiac ventricles. Federation Proceedings. 1980;39(2):133–140. - PubMed
    1. Starr I., Jeffers W. A., Meade R. H., Jr. The absence of conspicuous increments of venous pressure after severe damage to the right ventricle of the dog, with a discussion of the relation between clinical congestive failure and heart disease. American Heart Journal. 1943;26(3):291–301. doi: 10.1016/S0002-8703(43)90325-4. - DOI
    1. Brooks H., Holland R., Al-Sadir J. Right ventricular performance during ischemia: an anatomic and hemodynamic analysis. The American journal of physiology. 1977;233(4):H505–H513. - PubMed
    1. Dell'Italia L. J. Anatomy and Physiology of the Right Ventricle. Cardiology Clinics. 2012;30(2):167–187. doi: 10.1016/j.ccl.2012.03.009. - DOI - PubMed

MeSH terms

LinkOut - more resources