. 2017 Dec 1;595(23):7223-7247.
doi: 10.1113/JP274865. Epub 2017 Oct 15.

Laminar-specific encoding of texture elements in rat barrel cortex

Affiliations

Laminar-specific encoding of texture elements in rat barrel cortex

Benjamin J Allitt et al. J Physiol. .

Abstract

Key points: For rats texture discrimination is signalled by the large face whiskers by stick-slip events. Neural encoding of repetitive stick-slip events will be influenced by intrinsic properties of adaptation. We show that texture coding in the barrel cortex is laminar specific and follows a power function. Our results also show layer 2 codes for novel feature elements via robust firing rates and temporal fidelity. We conclude that texture coding relies on a subtle neural ensemble to provide important object information.

Abstract: Texture discrimination by rats is exquisitely guided by fine-grain mechanical stick-slip motions of the face whiskers as they encounter, stick to and slip past successive texture-defining surface features such as bumps and grooves. Neural encoding of successive stick-slip texture events will be shaped by adaptation, common to all sensory systems, whereby receptor and neural responses to a stimulus are affected by responses to preceding stimuli, allowing resetting to signal novel information. Additionally, when a whisker is actively moved to contact and brush over surfaces, that motion itself generates neural responses that could cause adaptation of responses to subsequent stick-slip events. Nothing is known about encoding in the rat whisker system of stick-slip events defining textures of different grain or the influence of adaptation from whisker protraction or successive texture-defining stick-slip events. Here we recorded responses from halothane-anaesthetized rats in response to texture-defining stimuli applied to passive whiskers. We demonstrate that: across the columnar network of the whisker-recipient barrel cortex, adaptation in response to repetitive stick-slip events is strongest in uppermost layers and equally lower thereafter; neither whisker protraction speed nor stick-slip frequency impede encoding of stick-slip events at rates up to 34.08 Hz; and layer 2 normalizes responses to whisker protraction to resist effects on texture signalling. Thus, within laminar-specific response patterns, barrel cortex reliably encodes texture-defining elements even to high frequencies.

Keywords: barrel cortex; electrophysiology; texture discrimination.


Conflict of interest statement

The authors have no conflicts of interest.

Figures

Figure 1
Figure 1. Coronal section including barrel cortex taken from an animal in this research and the corresponding peri‐stimulus time histograms (PSTHs) taken from each recording depth
For each electrophysiological experiment we positioned the electrode at 10 recording depths shown in the right panels. At each of these depths we generated PSTHs in response to trapezoid stimuli and compared them to our online database. The coronal section on the left shows the barrel cortex of one animal in this research (where the scale bar is positioned) and the PSTHs on the right show the onset response of the trapezoid stimulus we used to verify recording depth from the same animal with all PSTHs normalized to layer 4 (L4) firing rates. Note the increase in firing strength from 200 to 850 μm and the broadening of responses in L5. This procedure of generating online PSTHs was conducted for every experiment in this paper to ensure recording depths were from the correct cortical layers.
Figure 2
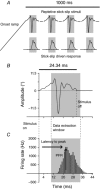
Figure 2. Repetitive stick‐slip stimuli applied to the principal whisker
A, stick‐slip stimuli were presented at the top of a 2 mm trapezoidal ramp which had an onset speed of 32.7 or 654° s−1 representing the protraction of an animal's exploratory whisker movement towards a surface or object. At the conclusion of the 1000 ms presentation of stick‐slip stimuli an offset ramp of 40 ms duration returned the whisker to its original position. Also presented are schematic representations of both the stick‐slip event and driven neural responses. B, a representation of the stick‐slip stimulus used in this research where the duration of the stimulus was always 24.34 ms and zero amplitude represents the position of the principal whisker's protraction at the top of the ramp. The presentations of stick‐slip stimuli trains lasted for 1000 ms and were presented at eight different frequencies from 2.4 to 34.08 Hz in order to represent a whisker movement over surfaces of varying textures. The frequency of stimuli was calculated from the duration of a single stick‐slip event plus the interstimulus interval. C, data metrics were extracted from a post stick‐slip window that allowed the quantification of both the peak firing rate (PFR) and the latency to the PFR. This window began 10 ms after stimulus onset and continued to 34 ms after stimulus onset.
Figure 3
Figure 3. A faster onset ramp speed drives a higher peak firing rate, which alters both 1st stick‐slip peak firing rate and latency to the 1st stick‐slip peak firing rate
A, mean (±SEM) PFR driven by the both ramp speeds in each cortical layer which was always higher in response to the 654° s−1 ramp speed. B, mean (±SEM) PFR driven by the 1st stick‐slip event following both ramp speeds in each cortical layer. There was no difference in the 1st stick‐slip PFR (PFR1ss) recorded from L2 following either protraction speed. In all other cortical layers the 60 mm ramp significantly attenuated PFR1ss in comparison to that following the 32.7° s−1 ramp. C, difference in ramp‐driven activity was calculated as the PFR to the 654° s−1 ramp subtracted from the PFR to the 32.7° s−1 ramp for each multi‐unit cluster and then pooled to calculate means and SEM. Difference in PFR1ss was calculated as the PFR to the 654° s−1 ramp subtracted from the 32.7° s−1 PFR for each multi‐unit cluster then pooled to calculate the mean and SEM. D, latency to 1st stick‐slip PFR (Latency1ss) following the 32.7° s−1 ramp was typical of the rodent barrel cortex with responses occurring in D3 and L4 first, progressing to U3 then L2 and finally L5. Latency1ss preceded by the 654° s−1 ramp occurred first in L2 then increased monotonically as a function of depth to L5. The responses preceded by the 60 mm s–1 ramp were significantly longer in each cortical layer. * < 0.05.
Figure 4
Figure 4. The connection between ramp driven firing rate to 1st stick‐slip firing rate
AE, scatter plots representing the relationship between the PFR to the ramp and PFR1ss, from layers L2–L5. In every layer and in response to both ramp speeds there were significant linear relationships between ramp activity and 1st stick‐slip‐driven activity. This figure illustrates that in L2 and U3 neural responses to the 1st stick‐slip are reasonably similar despite the large difference in response to the ramp. However, in D3–L5 the difference between responses following each ramp speed were much more pronounced.
Figure 5
Figure 5. Short‐term properties of adaptation are altered by interstimulus interval and whisker protraction velocity
A, Grand PSTH outline with error bars (±SEM) of the 1st and 2nd stick‐slip responses recorded from L4 during presentation of the 34.08 Hz stimulus train where time 0 is stimulus onset for both events. Note the long delay to the 2nd event PSTH, the decrease in response strength and the change in response shape. B, 2nd stick‐slip PFR (PFR2ss) increases as ISI increases and there is significantly lower PFRs in middle cortical layers following the 654° s−1 ramp. C, latency to the 2nd event PFR (Latency2ss) at all frequencies of stick‐slip train, in all cortical layers following the 654° s−1 ramp. A short ISI increases the latency across all cortical layers. Responses following the 654° s−1 onset ramp are shorter in deep cortical layers in response to short ISIs. The x axes are on a logarithmic scale. * < 0.05.
Figure 6
Figure 6. Grand peri‐stimulus time histograms reveal properties of adaptation and responses to varying ramp speed
All examples were taken from L2 and represent mean responses recorded from 18 multi‐unit clusters. The left column represents a subset of Grand PSTHs where we presented the 32.7° s−1 ramp and frequencies of stick‐slip train denoted in the left of the figure. The right column represents a subset of Grand PSTHs where we presented the 654° s−1 ramp and the same frequencies of stick‐slip train. Note that in response to the 32.7° s−1 ramp there is very little driven activity and that firing rates have returned to baseline levels before the presentation of the 1st stick‐slip event. In contrast, the activity driven by the 654° s−1 ramp is robust and firing rates are still decreasing when the 1st stick‐slip event is presented. In response to both ramp speeds a visual inspection reveals firing rate adaptation that is weak in response to 6.93 Hz stimulation and strengthens as a function of increased frequency of the stick‐slip train. At frequencies lower than 6.93 Hz there was no decrease in firing rate following the 1st stick‐slip event and often an increase, as seen in responses to the 2.4 Hz train. Following either ramp speed barrel cortex could still reliably code for each stick slip event even at 34.08 Hz.
Figure 7
Figure 7. A power function of adaptation fits peak firing rate decay across a stimulus train best
We applied power, exponential and logarithmic curve fitting analyses to each multi‐unit cluster normalized PFR in each cortical layer and in response to all frequencies of stick‐slip from 6.9 to 34.08 Hz. R 2 values were extracted for each curve fit from every multi‐unit cluster and pooled to ascertain which function of adaptation best fit our results. Results here represent mean R 2 (±SEM). In L2 the extracted R 2 values were similar for each of the adaptation functions applied. From U3 to L5 the rate of adaptation was best fit by the power function at high frequencies of stick‐slip stimuli and was similar between functions at lower frequencies. The x axis is on a logarithmic scale.
Figure 8
Figure 8. Examples of power functions fitted to the adapting responses to repetitive stimuli modelling texture surface grain
A, the PSTH recorded from a single deep layer 3 (D3) multi‐unit cluster in response to a stimulus complex with 32.7° s−1 protraction followed by a stick‐slip train at 22.55 Hz. B, the PSTH recorded from the same cluster in response to a stimulus complex with 32.7° s−1 protraction followed by a stick‐slip train at 34.08 Hz. C, the normalized PFR in response to each stick‐slip event in A and B (shown as either an asterisk or a circle) was extracted and used to fit a power function to model adaptation of responses to the stick‐slip train. Note that PFRs were normalized to highest PFR in the train of stick‐slip events, in this case to the 1st stick‐slip event of the train. D, power functions for the normalized PFRs for a train of stick‐slip events at train frequency of 22.55 Hz, for all 18 multi‐unit clusters from D3 across all animals. E, as for D, but now for a stick‐slip train frequency of 34.08 Hz, from the 18 multi‐unit clusters from D3 across all animals.
Figure 9
Figure 9. The rate of adaptation b in encoding texture signals depends on frequency of texture events and cortical layer but not whisker protraction speed
A, mean (±SEM) b values recorded from each layer in response to an increasing frequency of stick‐slip presentation when preceded by the 32.7° s−1 ramp. Note that at 6.9 Hz there is very little adaptation of the PFR in response to each stick‐slip event. However, as frequency increases the rate of adaptation also increases, with L2 and U3 showing the greatest rate of adaptation in response to most frequencies, and D3–L5 recordings displaying similar rates of adaptation. B, this trend is similar in the results recorded following the 654° s−1 ramp, with L2 and U3 showing similar stronger trends of adaptation in response to high frequency stimulation and D3–L5 all showing a similar pattern of adaptation. C, layer‐specific comparisons of the effect of whisker protraction speed on adaptation metric b versus frequency of stick‐slip train. The rate of adaptation across the frequency range of stick‐slip trains following the 3 or 654° s−1 ramp was similar in all layers. The x axes are on a logarithmic scale.
Figure 10
Figure 10. Coding strategies in layer 2 (L2) vs. layer 4 (L4)
A, a single multi‐unit cluster recorded in L2 in response to 22.55 Hz stimulus train in the active and passive whisking states. At the beginning of the stimulus train the first stick‐slip event evokes strong responses before responses quickly adapt and become sparser. Responses in the 654° s−1 suite show that the response to the 1st stick‐slip event is slightly stronger than in the 32.7° s−1 suite. B, a single multi‐unit response in L4 to the 22.55 Hz stimulus train is very different from responses recorded from L2. In the active whisking state the first stick‐slip response is attenuated compared to the passive state. Furthermore, each stick‐slip event is robustly coded with less adaptation occurring than that seen in L2 (A). The responses recorded from these two multi‐unit clusters in L2 and L4 are indicative of the responses recorded from all animals.
Figure 11
Figure 11. The rate of adaptation quantified as the adaptation index (AI) in encoding texture signals depends on frequency of texture events and cortical layer but not whisker protraction speed
A, mean (±SEM) AI values recorded from each layer in response to an increasing frequency of stick‐slip presentation when preceded by the 32.7° s−1 ramp. Note that at 6.9 Hz there is very little adaptation of the steady‐state PFR. However, as frequency increases the rate of adaptation also increases. B, this trend is similar in the results recorded following the 654° s−1 ramp. C, layer‐specific comparisons of the effect of whisker protraction speed on AI versus frequency of stick‐slip train. The rate of adaptation using the AI across the frequency range of stick‐slip trains following the 32.7 or 654° s−1 ramp are different in all layers other than L2 where the response profile was unaltered by the ramp. The x axes are on a logarithmic scale. * < 0.05.
Figure 12
Figure 12. Mean latency to peak firing rate (Pk) and latency to half peak firing rate (HPk) in response to the 34 Hz stick‐slip stimulus in L2 (A and B) and L4 (C and D)
The 32.7° s−1 onset ramp suite is represented in A and C, and the 654 ° s−1 onset ramp is represented in B and D. Note that the pattern of latency change is very similar to both the Pk and to the HPk.
Figure 13
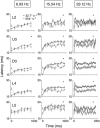
Figure 13. Latency to peak firing rate (PFR) of each stick‐slip event changes as a function of stimulus frequency and ramp speed
A, L4 latency to PFR following the 32.7° s−1 ramp in response to all frequencies where each data point represents the onset time of a stick‐slip stimulus on the x axis and the corresponding mean latency on the y axis across all frequencies of stimulus presentation (i.e. fewer data points for low frequencies). It is clear that there is an increase in latency to the 2nd event PFR at high frequencies (22.55–34.08 Hz), which is much less pronounced at 15.54 Hz. This then decreases and stabilizes over the duration of the stimulus train. There is also an increase in the latency to PFR of stick‐slip events at low frequencies (2.4–9.58 Hz) but this is less dramatic and increases slowly in a linear fashion. B, L4 latency to PFR following the 654° s−1 ramp in response to all frequencies. Note the change in response pattern when compared to those following the 32.7° s−1 ramp. There is much less segregation between low and high frequency latencies in the latter part of the stimulus train and the decrease in latency that occurs late in the stimulus train at high frequencies is more pronounced than that seen following the 32.7° s−1 onset ramp. C, L4 latency to PFR in response to exemplar frequencies when preceded by both ramp speeds. Note that the latency late in the stimulus train is always shorter when preceded by the 654° s−1 ramp despite a longer latency to 1st stick‐slip PFR shown above in Fig. 2.
Figure 14
Figure 14. Latency to the peak firing rate is altered by the frequency of stick‐slip presentation and by ramp speed
Examples of latency to the PFR of stick‐slip events presented at low (6.93 Hz), mid‐ (15.54 Hz) and high (both 29.12) frequencies when preceded by both ramp speeds across the cortical column where each data point represents the onset time of a stick‐slip stimulus on the x axis and the corresponding mean latency on the y axis. Latency changes are altered by the onset ramp speed with the 654° s−1 onset ramp eliciting a longer latency to the 1st event PFR (shown above in Fig. 2) but then decreasing and stabilizing to a shorter adapted latency later in the stimulus train. Note that at both the mid‐ and high frequency stimulation, the adapted latency to PFR is shorter when preceded by the 654° s−1 ramp in L2–L5. At the lower frequency of 6.93 Hz the only group difference is in U3 with the 654° s−1 onset ramp leading to shorter latencies later in the stick‐slip train. * < .05.
Figure 15
Figure 15. High frequency stimuli cause peak firing rate oscillation over consective stick‐slip events
A, mean normalized PFRs recorded from L5 in response to the 34.08 Hz stick‐slip train following both ramp speeds show an oscillation in the early part of the stimulus train. Note that the PFR to each stick‐slip event is stable in the later part of the stimulus train. B, 34 Hz stimulus PFR oscillations as a function of cortical layer and ramp speed. The difference in PFR to the 2nd stick‐slip event (PFR2ss) and that to the 3rd stick‐slip event (PFR3ss) is plotted for each multi‐unit cluster in each cortical layer following both ramp speeds. A positive value indicates that PFR2ss was higher than PFR3ss, and that there was no oscillatory activity, whereas a negative value indicates that PFR2ss was lower than PFR3ss, showing the presence of oscillations in responses to successive stick‐slip events in the train. In general, oscillatory behaviour becomes more pronounced as a function of cortical depth.
Figure 16
Figure 16. Oscillation of peak firing rate is affected by cortical layer and stick‐slip frequency but not ramp speed
A, mean (±SEM) oscillatory index as a function of sick‐slip frequency and cortical layer for stimulus complexes with a 32.7° s−1 ramp. Note that a negative value indicates that the 3rd stick‐slip‐driven PFR was higher than the 2nd, signifying oscillatory activity. B, mean (±SEM) oscillatory index as a function of sick‐slip frequency and cortical layer for stimulus complexes with a 654° s−1 ramp. The x axes are on a logarithmic scale.

Similar articles

Cited by

References

    1. Abdi H (2007). The Bonferonni and Šidák corrections for multiple comparisons In Encyclopedia of Measurement and Statistics, ed. Salkind N. Sage, Thousand Oaks, CA.
    1. Adibi M, Clifford CW & Arabzadeh E (2013a). Informational basis of sensory adaptation: entropy and single‐spike efficiency in rat barrel cortex. J Neurosci 33, 14921–14926. - PMC - PubMed
    1. Adibi M, McDonald JS, Clifford CW & Arabzadeh E (2013b). Adaptation improves neural coding efficiency despite increasing correlations in variability. J Neurosci 33, 2108–2120. - PMC - PubMed
    1. Adibi M, McDonald JS, Clifford CW & Arabzadeh E (2014). Population decoding in the rat barrel cortex: Optimizing the linear readout of correltated population responses. PLoS Comput Biol 10, 1–14. - PMC - PubMed
    1. Ahissar E, Sosnik R & Haidarliu S (2000). Transformation from temporal to rate coding in a somatosensory thalamocortical pathway. Nature 406, 302–306. - PubMed

LinkOut - more resources