

Characterizing trends in fruit and vegetable intake in the USA by self-report and by supply-and-disappearance data: 2001-2014
- PMID: 28929985
- PMCID: PMC10261347
- DOI: 10.1017/S1368980017002385
Characterizing trends in fruit and vegetable intake in the USA by self-report and by supply-and-disappearance data: 2001-2014
Abstract
Objective: To examine the comparability of fruit and vegetable (F&V) intake data in the USA from 2001 to 2014 between data acquired from two national data collection programmes.
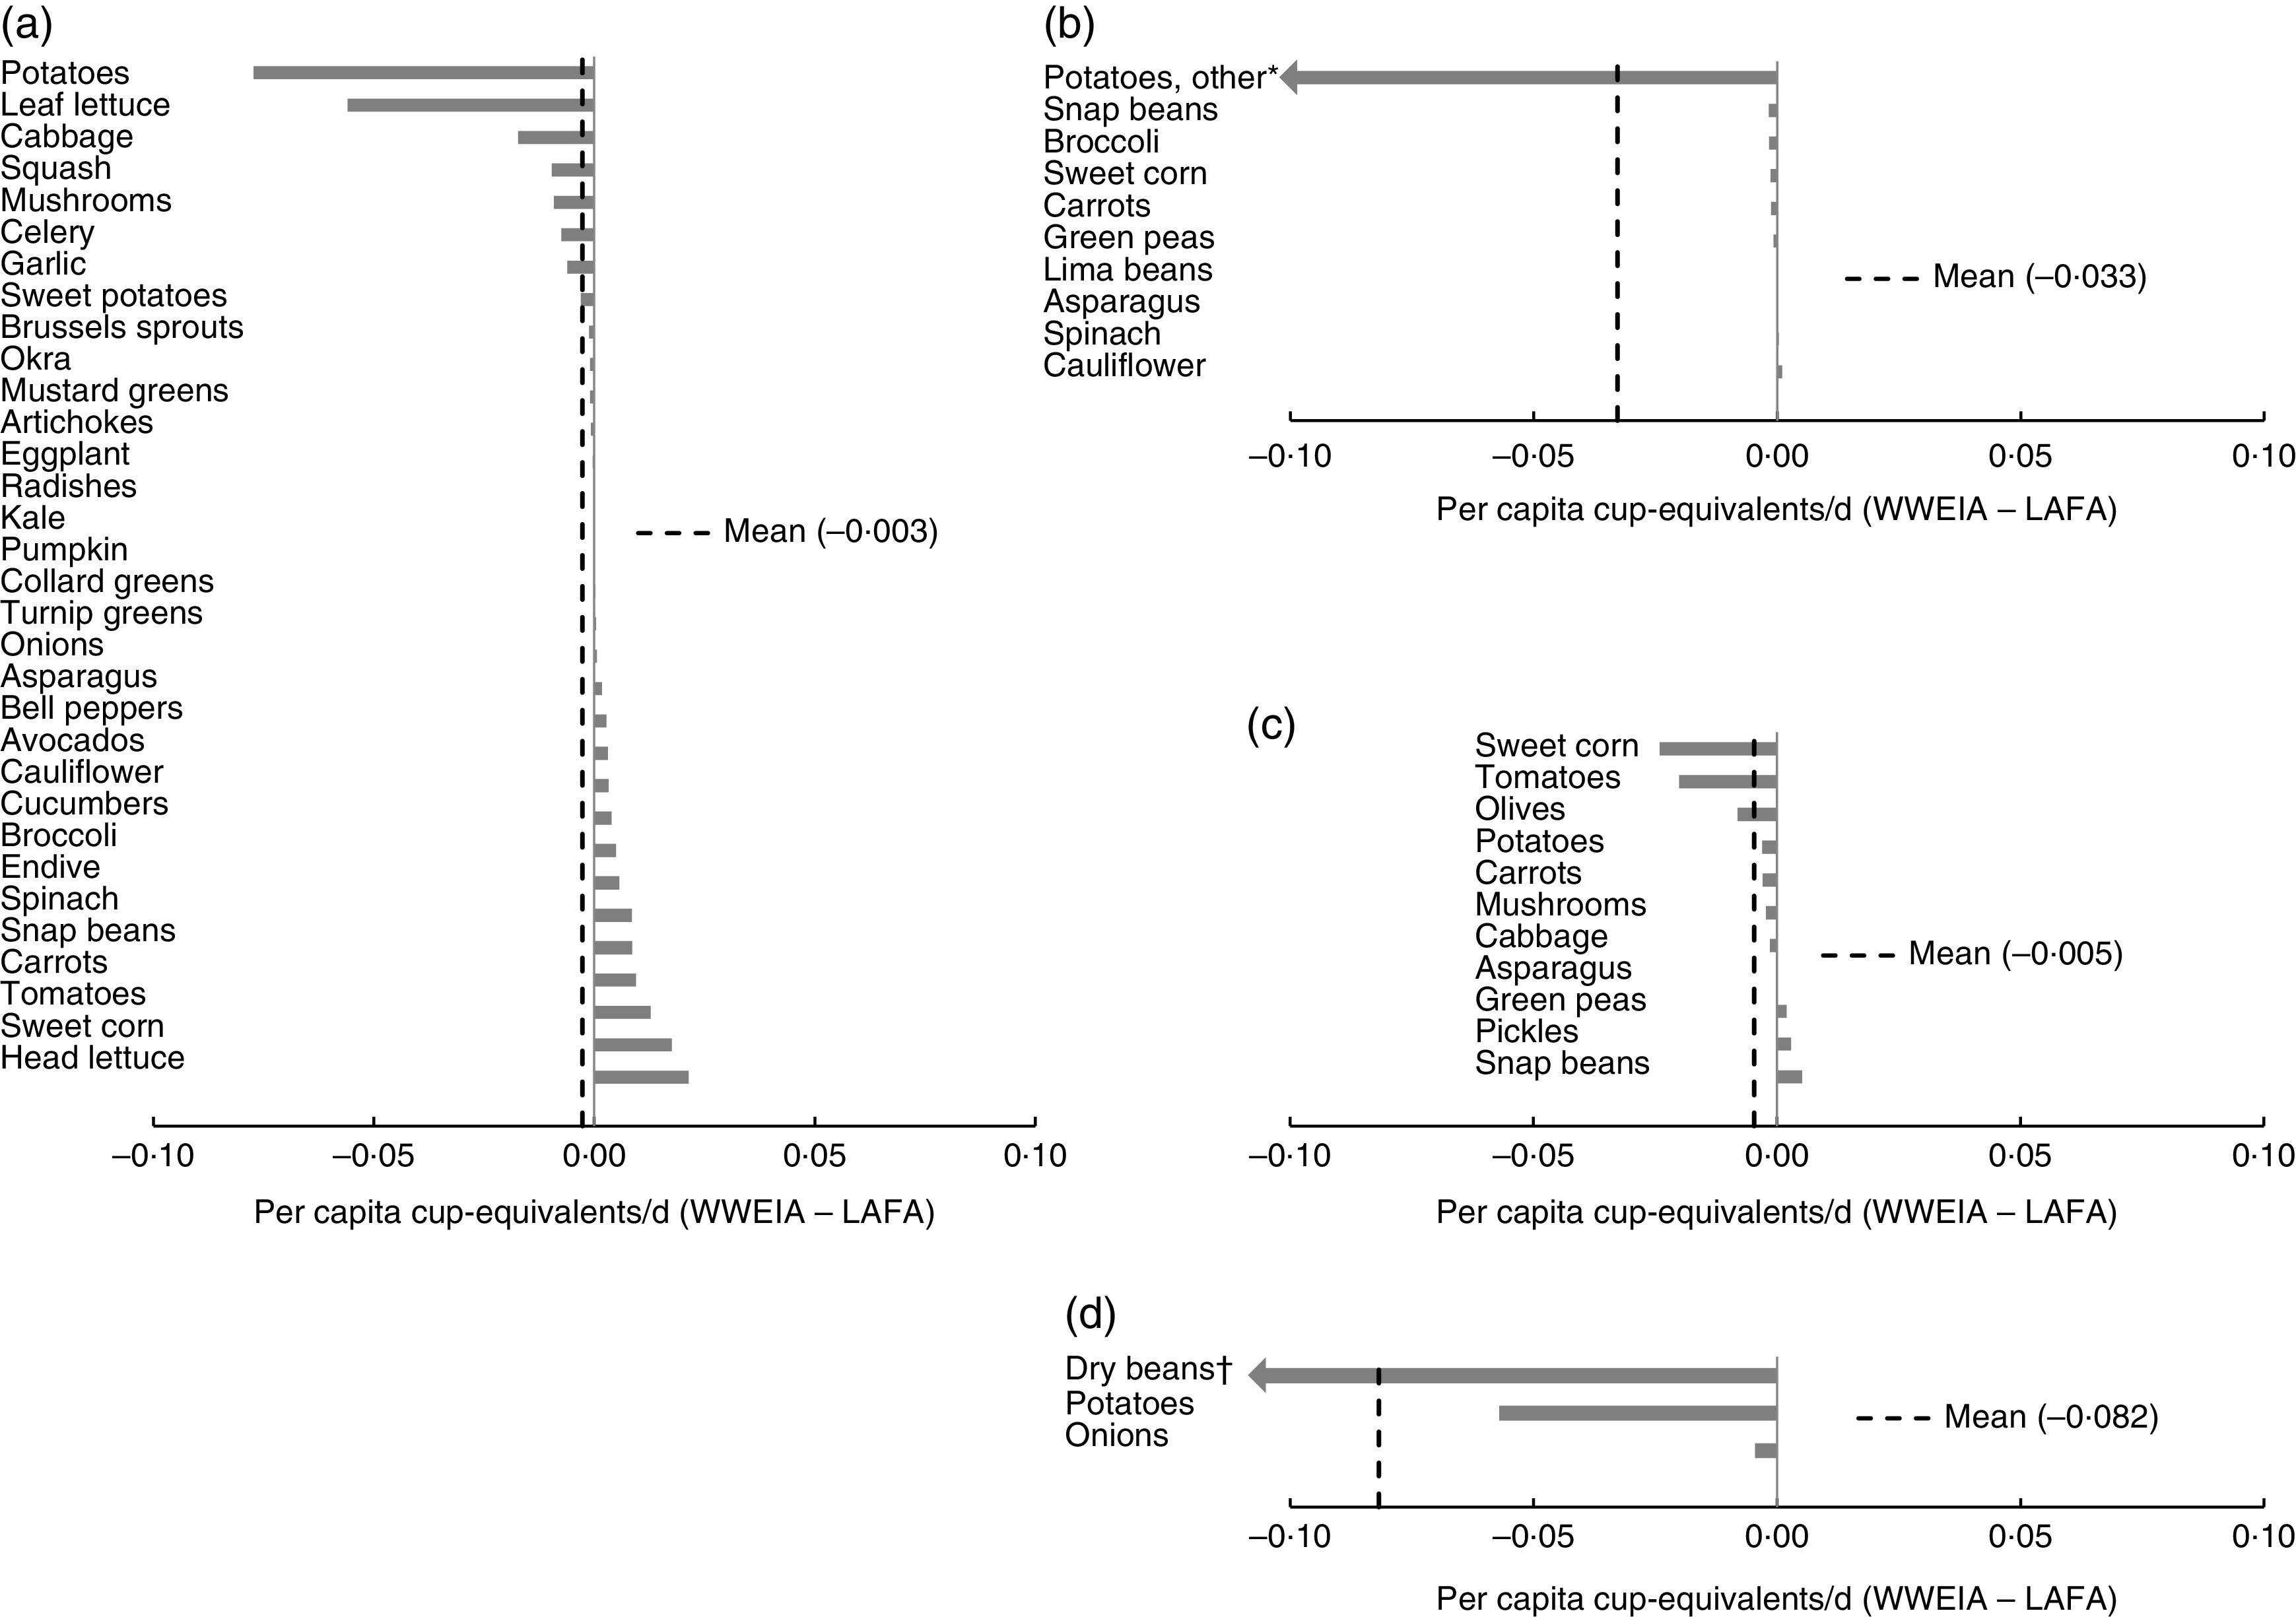
Design: Cross-sectional analysis. Linear regression models estimated trends in daily per capita intake of total F&V. Pooled differences in intake of individual F&V (n 109) were examined by processing form (fresh, frozen, canned, dried and juice).
Setting: What We Eat in America (WWEIA, 2001-2014) and Loss-Adjusted Food Availability data series (LAFA, 2001-2014).
Results: No temporal trends were observed in daily per capita intake of total F&V from 2001 to 2014 using WWEIA and LAFA. Modest differences between WWEIA and LAFA were observed in mean pooled intake of most individual F&V.
Conclusions: WWEIA and LAFA produced similar estimates of F&V intake. However, WWEIA may be best suited for monitoring intake at the national level because it allows for the identification of individual F&V in foods with multiple ingredients, and it is structured for sub-population analysis and covariate control. LAFA does retain advantages for other research protocols, specifically by providing the only nationally representative estimates of food losses at various points in the food system, which makes it useful for examining the adequacy of the food supply at the agricultural, retail and consumer levels.
Keywords: Fruits; Loss-Adjusted Food Availability; Vegetables; What We Eat in America.
Figures
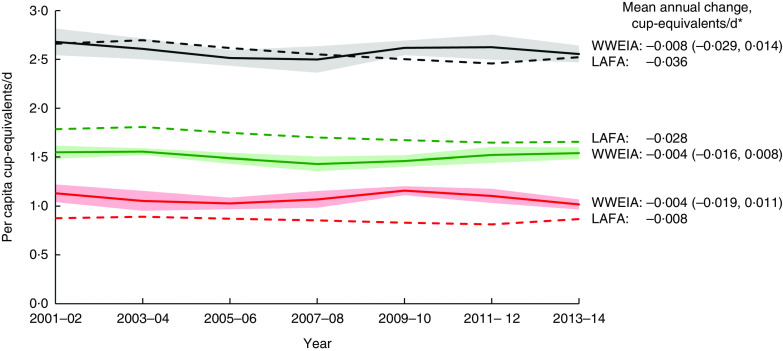
 ), vegetables(
 ) and total fruits and vegetables(
 )from What We Eat in America (WWEIA) and Loss-Adjusted Food Availability data series (LAFA), 2001–2014. Solid lines represent WWEIA, dashed lines represent LAFA. Shaded bands represent 95 % CI for WWEIA; LAFA does not provide data at the individual level so interindividual variation cannot be estimated. *Values in parentheses represent 95 % CI for WWEIA; LAFA does not provide data at the individual level so interindividual variation cannot be estimated
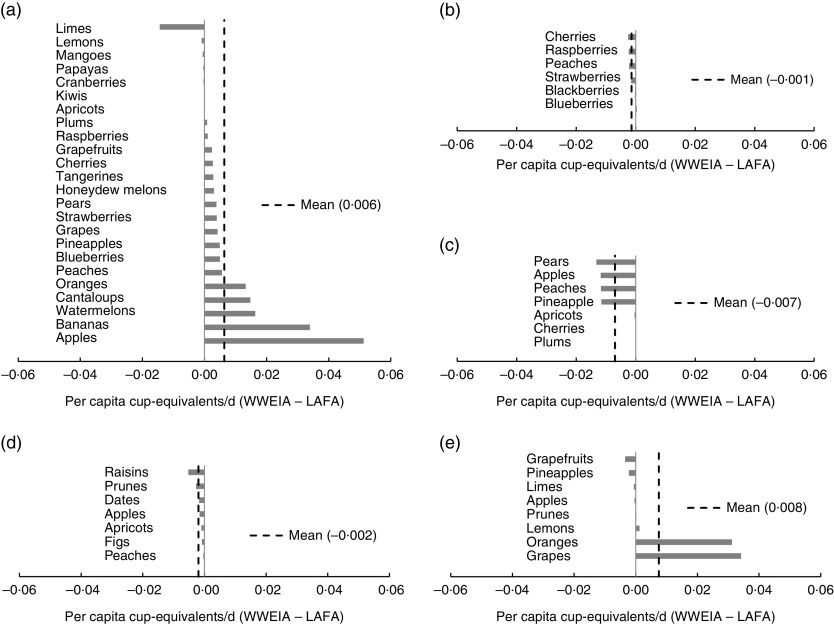
References
-
- US Department of Health and Human Services, Centers for Disease Control and Prevention (2017) About the National Health and Nutrition Examination Survey. https://www.cdc.gov/nchs/nhanes.htm (accessed June 2017).
-
- US Department of Agriculture, Economic Research Service (2017) Loss-Adjusted Food Availability (LAFA) data series documentation. https://www.ers.usda.gov/data-products/food-availability-per-capita-data... (accessed February 2017).
MeSH terms
LinkOut - more resources
Full Text Sources
Other Literature Sources
