. 2017 Sep 20;18(9):2017.
doi: 10.3390/ijms18092017.

Comprehensive Evaluation of TFF3 Promoter Hypomethylation and Molecular Biomarker Potential for Prostate Cancer Diagnosis and Prognosis

Affiliations

Comprehensive Evaluation of TFF3 Promoter Hypomethylation and Molecular Biomarker Potential for Prostate Cancer Diagnosis and Prognosis

Maibritt Nørgaard et al. Int J Mol Sci. .

Abstract

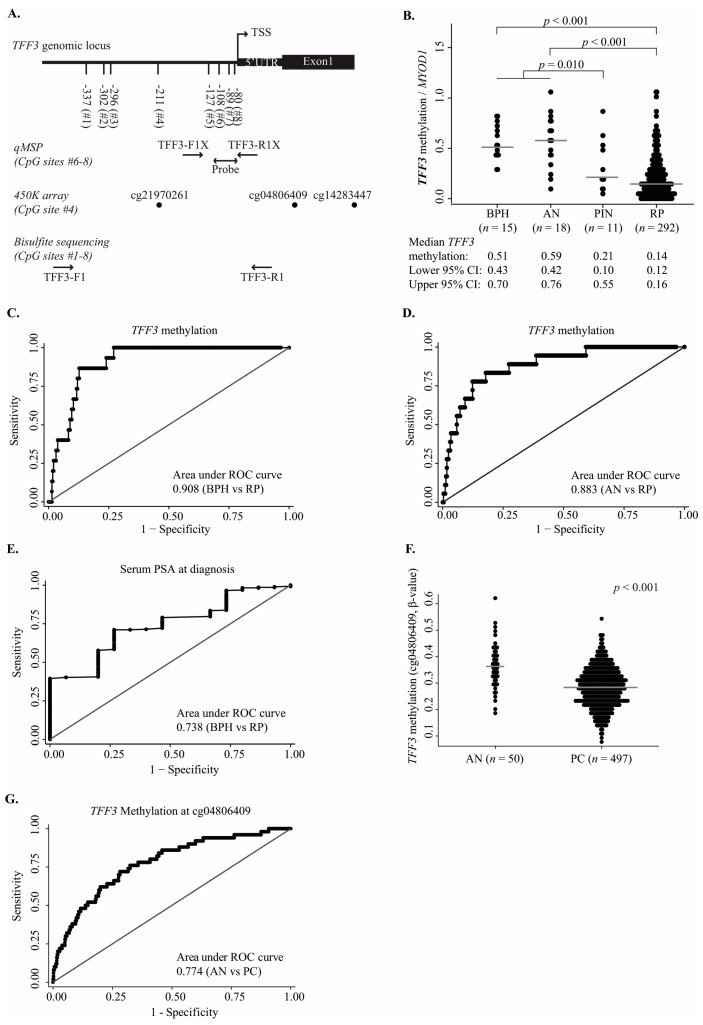
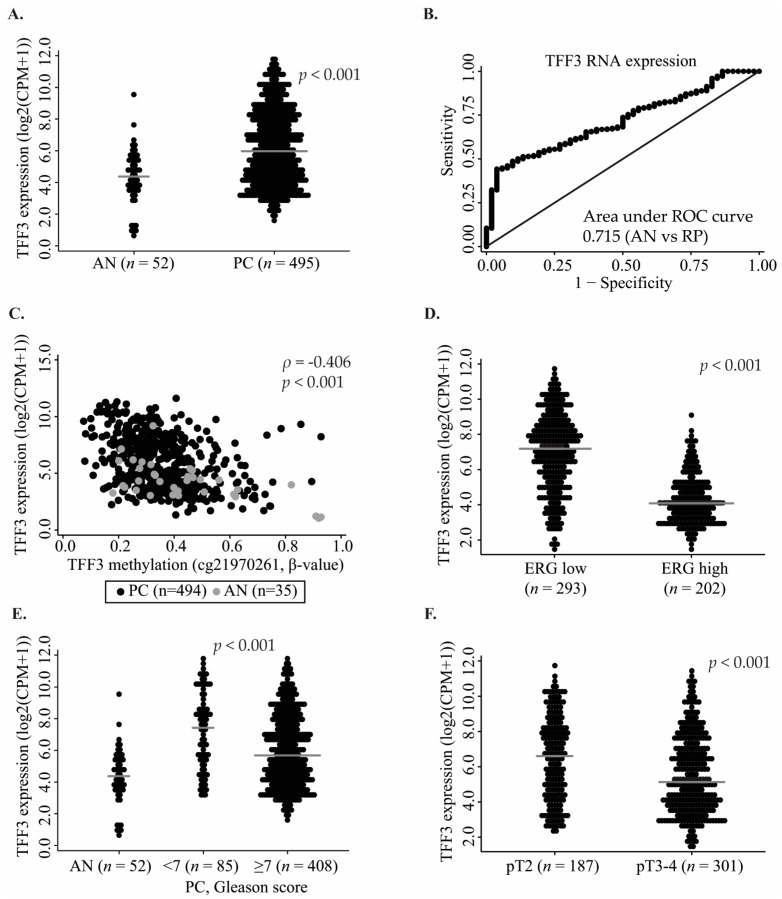
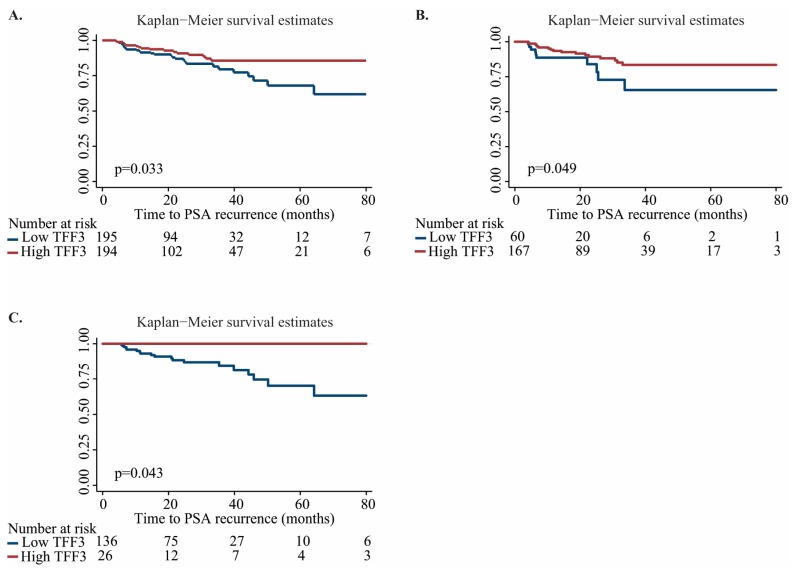
Overdiagnosis and overtreatment of clinically insignificant tumors remains a major problem in prostate cancer (PC) due to suboptimal diagnostic and prognostic tools. Thus, novel biomarkers are urgently needed. In this study, we investigated the biomarker potential of Trefoil factor 3 (TFF3) promoter methylation and RNA expression levels for PC. Initially, by quantitative methylation specific PCR (qMSP) analysis of a large radical prostatectomy (RP) cohort (n = 292), we found that the TFF3 promoter was significantly hypomethylated in PC compared to non-malignant (NM) prostate tissue samples (p < 0.001) with an AUC (area under the curve) of 0.908 by receiver operating characteristics (ROC) curve analysis. Moreover, significant TFF3 promoter hypomethylation (p ≤ 0.010) as well as overexpression (p < 0.001) was found in PC samples from another large independent patient sample set (498 PC vs. 67 NM) analyzed by Illumina 450K DNA methylation arrays and/or RNA sequencing. TFF3 promoter methylation and transcriptional expression levels were inversely correlated, suggesting that epigenetic mechanisms contribute to the regulation of gene activity. Furthermore, low TFF3 expression was significantly associated with high ERG, ETS transcription factor (ERG) expression (p < 0.001), as well as with high Gleason score (p < 0.001), advanced pathological T-stage (p < 0.001), and prostate-specific antigen (PSA) recurrence after RP (p = 0.013; univariate Cox regression analysis). There were no significant associations between TFF3 promoter methylation levels, ERG status, or PSA recurrence in these RP cohorts. In conclusion, our results demonstrated diagnostic biomarker potential of TFF3 promoter hypomethylation for PC as well as prognostic biomarker potential of TFF3 RNA expression. To the best of our knowledge, this is the most comprehensive study of TFF3 promoter methylation and transcriptional expression in PC to date.

Keywords: DNA methylation; TFF3; biomarker; diagnosis; expression; prognosis; prostate cancer.


Conflict of interest statement

The authors declare no conflict of interest.

Figures

Figure 1
Figure 1
Hypomethylation of trefoil factor 3 (TFF3) in prostate cancer (PC) samples. (A) Schematic structure of the promoter region of TFF3 including eight CpG sites (CpG sites #1–8), 5′ UTR, transcription start site (TSS), and exon 1. Regions analyzed by qMSP (CpG sites Nos. 6–8) and bisulfite sequencing (CpG sites #1–8) are marked with arrows, indicating primer/probe positions. The positions of the Illumina 450K probes (cg21970261 (CpG site No. 4), cg04806409, and cg14283447) are indicated with black dots; (B) TFF3 methylation quantified by qMSP in BPH, AN, PIN, and RP samples. Median methylation and 95% confidence intervals (CI) are indicated; (C) ROC curve analysis of cancer specificity of TFF3 promoter methylation in BPH vs. RP samples; (D) ROC curve analysis of cancer specificity of TFF3 promoter methylation in AN vs. RP samples; (E) ROC curve analysis of cancer specificity of serum PSA levels at diagnosis in BPH vs. RP samples; (F) Promoter methylation of TFF3 in 450K data from TCGA (cg04806409) in AN (n = 50) vs. PC (n = 497) samples; (G) ROC curve analysis of cancer specificity of TFF3 promoter methylation in TCGA AN vs. PC samples for Illumina CpG site cg04806409. Abbreviations: 450K, Illumina 450K DNA methylation array; UTR, untranslated region; qMSP, quantitative methylation specific PCR; BPH, benign prostatic hyperplasia; AN, adjacent normal; PIN, prostate intraepithelial neoplasia; RP, radical prostatectomy; p, p-value (Mann–Whitney U test); Grey line, median methylation.
Figure 2
Figure 2
Transcriptional TFF3 expression based on RNAseq data from TCGA. (A) TFF3 RNA expression in AN (n = 52) and PC (n = 495) tissue samples; (B) ROC curve analysis for TFF3 RNA expression in AN vs. PC samples; (C) Correlation between TFF3 promoter methylation (cg21970261; CpG site No. 4) and TFF3 RNA expression in AN (n = 35, grey) and PC (n = 494, black) samples from TCGA. Correlations between TFF3 RNA expression and (D) ERG RNA expression (n = 495), (E) Gleason score (n = 493), and (F) pathological T-stage (n = 488). Abbreviations: CPM, counts per million; AN, adjacent normal; PC, prostate cancer; p, p-value (Mann–Whitney U test or Spearman’s correlation test); ρ, Spearman’s rho; pT, pathological T-stage; Grey line, median expression.
Figure 3
Figure 3
Kaplan–Meier analysis of PSA recurence-free survival based on TFF3 RNA expression levels (low vs. high) in TCGA PC samples. (A) all PC samples; (B) PC samples with low ERG RNA expression; and (C) PC samples with high ERG RNA expression. Blue line, low TFF3 RNA expression; Red line, high TFF3 RNA expression; p, p-value (log-rank test).

Similar articles

Cited by

References

    1. Ferlay J., Steliarova-Foucher E., Lortet-Tieulent J., Rosso S., Coebergh J.W., Comber H., Forman D., Bray F. Cancer incidence and mortality patterns in Europe: Estimates for 40 countries in 2012. Eur. J. Cancer. 2013;49:1374–1403. doi: 10.1016/j.ejca.2012.12.027. - DOI - PubMed
    1. Loeb S., Bjurlin M.A., Nicholson J., Tammela T.L., Penson D.F., Carter H.B., Carroll P., Etzioni R. Overdiagnosis and overtreatment of prostate cancer. Eur. Urol. 2014;65:1046–1055. doi: 10.1016/j.eururo.2013.12.062. - DOI - PMC - PubMed
    1. Jones P.A. Functions of DNA methylation: Islands, start sites, gene bodies and beyond. Nat. Rev. Genet. 2012;13:484–492. doi: 10.1038/nrg3230. - DOI - PubMed
    1. Sproul D., Kitchen R.R., Nestor C.E., Dixon J.M., Sims A.H., Harrison D.J., Ramsahoye B.H., Meehan R.R. Tissue of origin determines cancer-associated CpG island promoter hypermethylation patterns. Genome Biol. 2012;13:R84. doi: 10.1186/gb-2012-13-10-r84. - DOI - PMC - PubMed
    1. Haldrup C., Mundbjerg K., Vestergaard E.M., Lamy P., Wild P., Schulz W.A., Arsov C., Visakorpi T., Borre M., Høyer S., et al. DNA methylation signatures for prediction of biochemical recurrence after radical prostatectomy of clinically localized prostate cancer. J. Clin. Oncol. 2013;31:3250–3258. doi: 10.1200/JCO.2012.47.1847. - DOI - PubMed