. 2017 Dec;119(6):418-428.
doi: 10.1038/hdy.2017.54. Epub 2017 Sep 20.

Trans-oceanic genomic divergence of Atlantic cod ecotypes is associated with large inversions

Affiliations

Trans-oceanic genomic divergence of Atlantic cod ecotypes is associated with large inversions

P R Berg et al. Heredity (Edinb). 2017 Dec.

Abstract

Chromosomal rearrangements such as inversions can play a crucial role in maintaining polymorphism underlying complex traits and contribute to the process of speciation. In Atlantic cod (Gadus morhua), inversions of several megabases have been identified that dominate genomic differentiation between migratory and nonmigratory ecotypes in the Northeast Atlantic. Here, we show that the same genomic regions display elevated divergence and contribute to ecotype divergence in the Northwest Atlantic as well. The occurrence of these inversions on both sides of the Atlantic Ocean reveals a common evolutionary origin, predating the >100 000-year-old trans-Atlantic separation of Atlantic cod. The long-term persistence of these inversions indicates that they are maintained by selection, possibly facilitated by coevolution of genes underlying complex traits. Our data suggest that migratory behaviour is derived from more stationary, ancestral ecotypes. Overall, we identify several large genomic regions-each containing hundreds of genes-likely involved in the maintenance of genomic divergence in Atlantic cod on both sides of the Atlantic Ocean.


Conflict of interest statement

The authors declare no conflict of interest.

Figures

Figure 1
Figure 1
Map showing the sampling locations of the Atlantic cod populations used in the present study. With one exception, red dots indicate the position where the samples were collected; the Icelandic samples were collected at several locations in the waters around Iceland and later categorized as Frontal or Coastal, based on Data Storage Tag profiling. See Figure 1 in Thorsteinsson et al. (2012) for a detailed view of the Icelandic sampling localities and see Table 1 for a detailed description of the populations in the present study. Can-N_PB, Placentia Bay; Can-N_SG, Southern Gulf of St Lawrence; Can-S_SB, Sambro; Can-S_GM, Gulf of Maine; Can-S_BB, Browns Bank; Ice_F, Iceland Frontal; Ice_C, Iceland Coastal; NEAC, Northeast Arctic cod; NCC, Norwegian coastal cod. The map was modified from http://www.graphic-flash-sources.com/world-vector-map/ using Adobe Illustrator CC.
Figure 2
Figure 2
Neutral population divergence between Atlantic cod populations. Population clustering based on 7075 neutral SNPs in 316 individuals of Atlantic cod, using an isolation-by-state (IBS) matrix constructed in PLINK, visualized using the NETVIEW P pipeline at k=50, capturing large-scale genetic differentiation across the Atlantic as well as fine-scale structuring within the Northwest and Northeast Atlantic populations. Edge width is proportional to the genetic distance between individuals. Can-N_PB, Placentia Bay; Can-N_SG, Southern Gulf of St Lawrence; Can-S_SB, Sambro; Can-S_GM, Gulf of Maine; Can-S_BB, Browns Bank; Ice_F, Iceland Frontal; Ice_C, Iceland Coastal; NEAC, Northeast Arctic cod; NCC, Norwegian coastal cod.
Figure 3
Figure 3
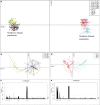
Spatial relationship between and within Northwest and Northeast Atlantic cod based on discriminant analysis of principal components (DAPC). Based on all 8165 SNPs, a distinct trans-Atlantic separation and a clear separation within Northeast and Northwest Atlantic is observed (a). The stratification within the Northwest Atlantic (b) and the Northeast Atlantic (d) is even more evident when these groups are analysed separately. The loading plots based on the DAPC analyses show the contribution of each SNP to the differentiation within the Northwest Atlantic (c) and Northeast Atlantic (e) populations. The analyses are based on n.pca=3 and n.da=2, calculated in ADEGENET that assumes a predefined population designation of the individuals. Can-N_PB, Placentia Bay; Can-N_SG, Southern Gulf of St Lawrence; Can-S_SB, Sambro; Can-S_GM, Gulf of Maine; Can-S_BB, Browns Bank; Ice_F, Iceland Frontal; Ice_C, Iceland Coastal; NEAC, Northeast Arctic cod; NCC, Norwegian coastal cod.
Figure 4
Figure 4
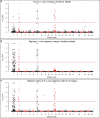
Manhattan plots visualizing the pairwise outlier patterns between ecotypes of Atlantic cod. The observed outlier pattern between Can-N and Can-S (a) indicates that the majority of outliers are clustered within the inversions in LGs 2, 7 and 12, whereas the inversions within LGs 1, 2 and 7 are putatively under selection between migratory and nonmigratory ecotypes in the Northeast Atlantic (b). By grouping all individuals into migratory and nonmigratory groups (see Table 1 for details), outliers are detected within the inversions in LGs 1, 2, 7 and 12 (c). The plots are based on median log10 posterior odds (PO) values from 10 independent runs of BAYESCAN. SNPs are plotted according to linkage group and position within the linkage groups along the x axis as in Berg et al. (2016). The red line at 1 indicates ‘strong association’ according to Jeffreys (1961). The migratory group consists of Can-N_PB (Placentia Bay), Can-N_SG (Southern Gulf of St Lawrence), Ice_F (Iceland Frontal) and NEAC (Northeast Arctic cod), whereas the nonmigratory group consists of Can-S_SB (Sambro), Can-S_GM (Gulf of Maine), Can-S_BB (Browns Bank), Ice_C (Iceland Coastal) and NCC (Norwegian coastal cod). For visualization purposes, maximum log10 (PO) values are set to 5 (all underlying values are found in Supplementary Table S3).
Figure 5
Figure 5
Discriminant analysis of principal components (DAPC) of the SNPs embedded within the inversions in LGs 1, 2, 7 and 12. Within all LGs a clear trimodal pattern, reflecting the inversion ‘genotypes’, is observed in addition to a broad trans-Atlantic division. Each dot represents an individual; NI/NI and I/I denote the homozygote noninverted and inverted clusters, respectively, whereas the NI/I denotes the heterozygote clusters. Inversion frequencies are listed in Supplementary Table S5. The analyses are based on n.pca=2 and n.da=2, calculated in ADEGENET. Can-N_PB, Placentia Bay; Can-N_SG, Southern Gulf of St Lawrence; Can-S_SB, Sambro; Can-S_GM, Gulf of Maine; Can-S_BB, Browns Bank; Ice_F, Iceland Frontal; Ice_C, Iceland Coastal; NEAC, Northeast Arctic cod; NCC, Norwegian coastal cod.

References

    1. Aubin-Horth N, Landry CR, Letcher BH, Hofmann HA. (2005). Alternative life histories shape brain gene expression profiles in males of the same population. Proc R Soc B 272: 1655–1662. - PMC - PubMed
    1. Ayala FJ, Coluzzi M. (2005). Chromosome speciation: humans, Drosophila, and mosquitoes. Proc Natl Acad Sci USA 102 (Suppl 1): 6535–6542. - PMC - PubMed
    1. Árnason E. (2004). Mitochondrial cytochrome b DNA variation in the high-fecundity Atlantic cod: trans-Atlantic clines and shallow gene genealogy. Genetics 166: 1871–1885. - PMC - PubMed
    1. Bangera R, Drangsholt T, Nielsen H, Sae-Lim P, Ødegård J, Puvanendran V et al. (2015). Genotype by environment interaction for growth in Atlantic cod (Gadus morhua L.) in four farms of Norway. J Mar Sci Eng 3: 412–427.
    1. Barney BT, Munkholm C, Walt DR, Palumbi SR. (2017). Highly localized divergence within supergenes in Atlantic cod (Gadus morhua within the Gulf of Maine. BMC Genomics 18: 271. - PMC - PubMed

Publication types