. 2017 Sep 19;20(12):2966-2979.
doi: 10.1016/j.celrep.2017.08.090.

Integrating Enhancer Mechanisms to Establish a Hierarchical Blood Development Program

Affiliations

Integrating Enhancer Mechanisms to Establish a Hierarchical Blood Development Program

Charu Mehta et al. Cell Rep. .

Abstract

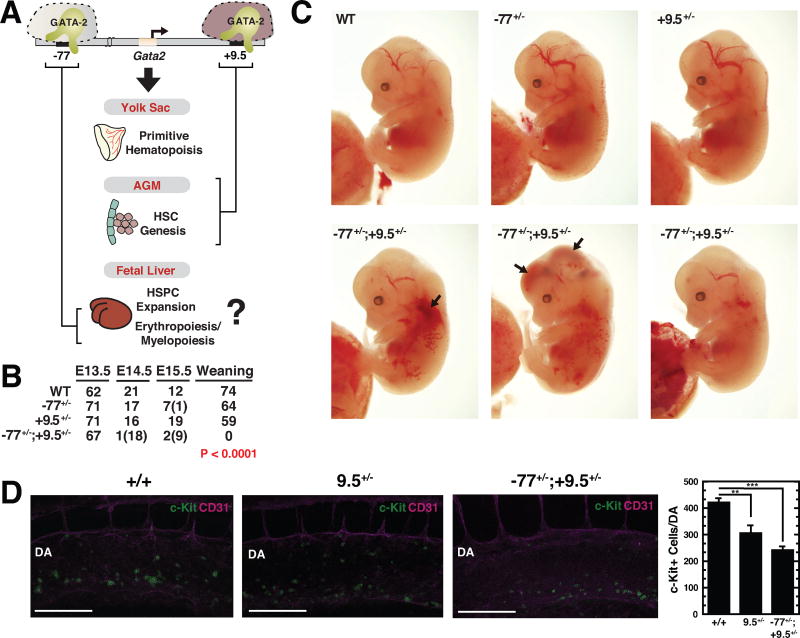
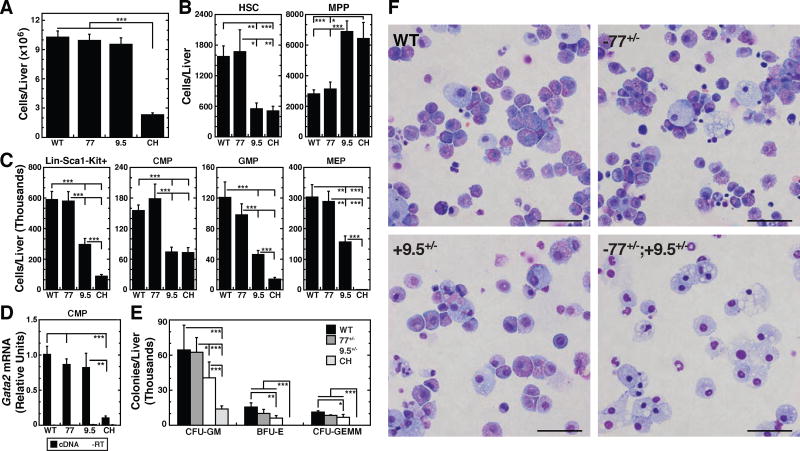
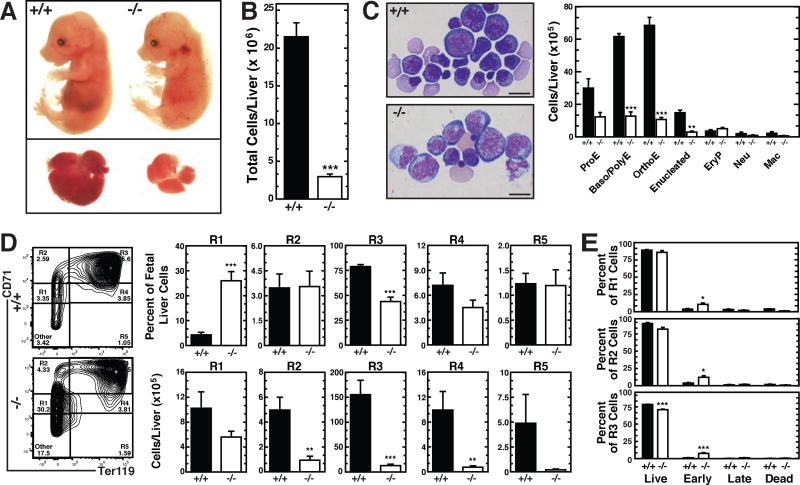
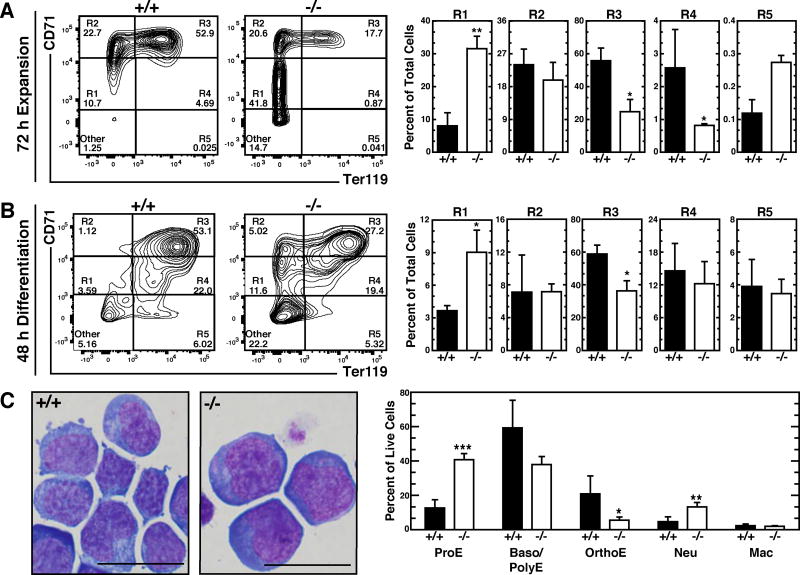
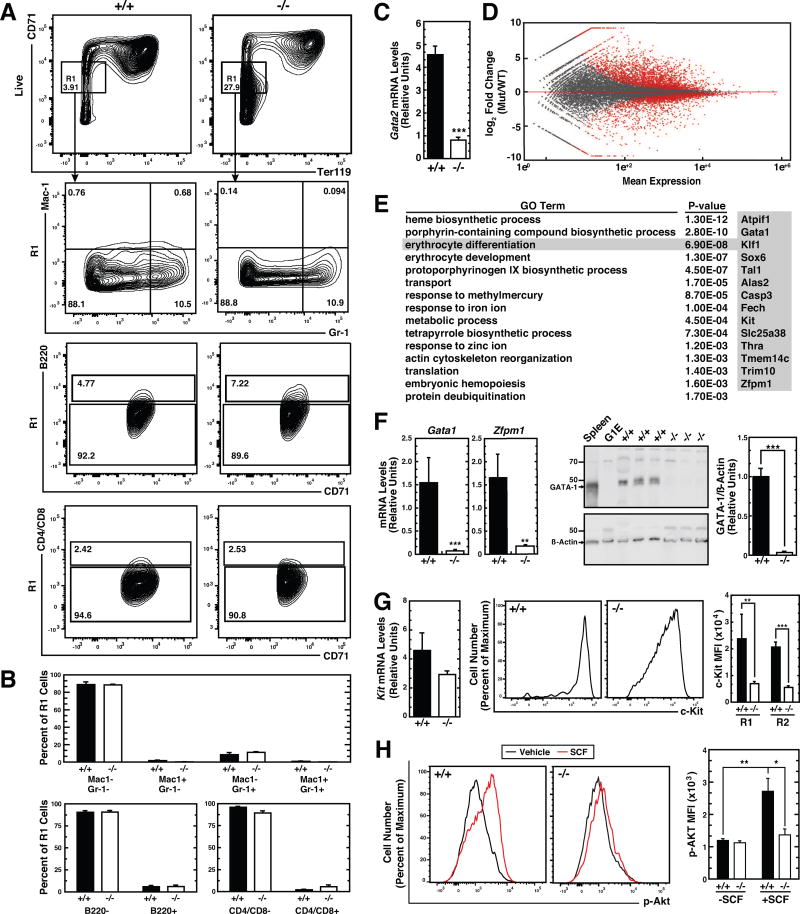
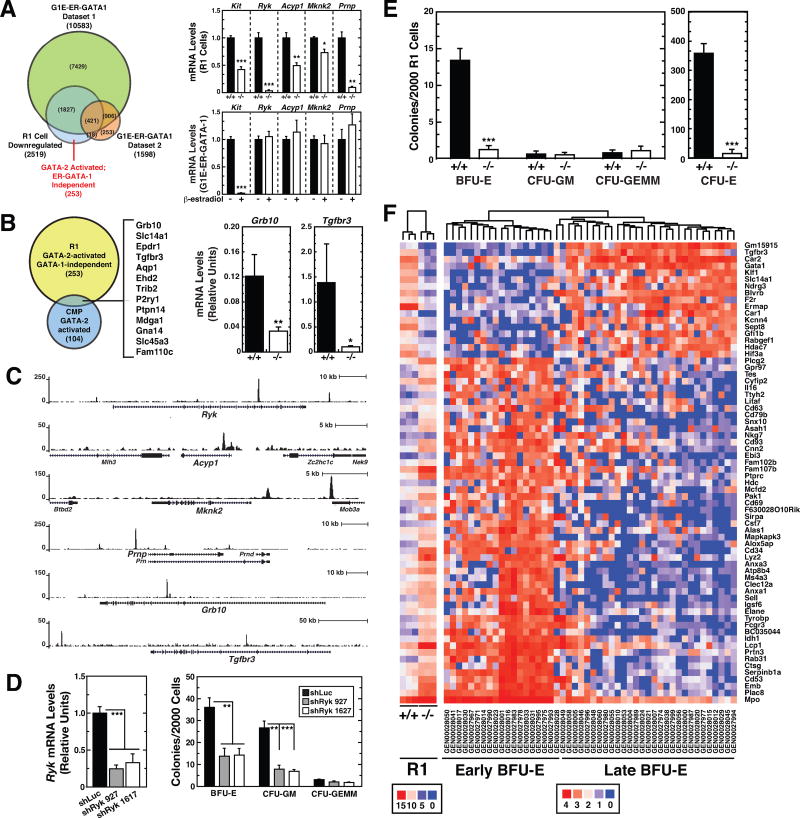
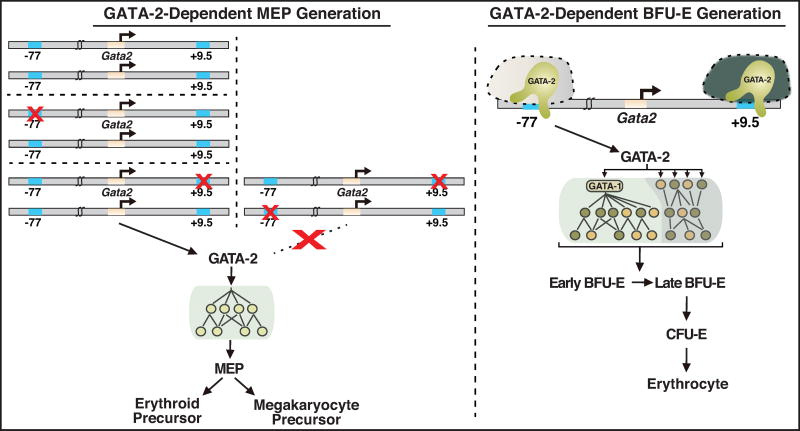
Hematopoietic development requires the transcription factor GATA-2, and GATA-2 mutations cause diverse pathologies, including leukemia. GATA-2-regulated enhancers increase Gata2 expression in hematopoietic stem/progenitor cells and control hematopoiesis. The +9.5-kb enhancer activates transcription in endothelium and hematopoietic stem cells (HSCs), and its deletion abrogates HSC generation. The -77-kb enhancer activates transcription in myeloid progenitors, and its deletion impairs differentiation. Since +9.5-/- embryos are HSC deficient, it was unclear whether the +9.5 functions in progenitors or if GATA-2 expression in progenitors solely requires -77. We further dissected the mechanisms using -77;+9.5 compound heterozygous (CH) mice. The embryonic lethal CH mutation depleted megakaryocyte-erythrocyte progenitors (MEPs). While the +9.5 suffices for HSC generation, the -77 and +9.5 must reside on one allele to induce MEPs. The -77 generated burst-forming unit-erythroid through the induction of GATA-1 and other GATA-2 targets. The enhancer circuits controlled signaling pathways that orchestrate a GATA factor-dependent blood development program.

Keywords: GATA-2; enhancer; erythroid; hematopoiesis; mouse model; myeloid; progenitor.


Conflict of interest statement

The authors declare no competing financial interests.

Figures

Figure 1
Figure 1. Unique Constellation of Hematopoietic Deficits in CH Embryos
(A) Model depicting stage-specific requirement for Gata2 −77 and +9.5 enhancers during developmental hematopoiesis. As the +9.5 enhancer deletion abrogates HSC genesis in the AGM of +9.5−/− embryos, whether it exerts essential activities in fetal liver hematopoietic cells was unclear. (B) Genotypes of WT, +9.5+/−, −77+/− and CH embryos at timed developmental stages and at time of weaning. The numbers of dead embryos at each developmental stage are shown in parentheses. Significance was analyzed using the Chi-squared test. (C) Representative E13.5 CH embryos exhibiting reduced liver size and hemorrhage (arrows). (D) Representative whole-mount staining of E10.5 WT and CH embryos showing CD31+ cells (magenta) and c-Kit+ cells (green) within the dorsal aorta (DA). Scale bar, 100 µm. Quantitation of c-Kit+ cells within the DA (WT [n = 5], +9.5+/− [n = 4] and CH [n = 4]). Graphs depict mean ± SEM; **p < 0.01, ***p < 0.001. Significance was analyzed using the 2-tailed unpaired Student’s t test.
Figure 2
Figure 2. Myelo-erythroid Progenitor Functional Defect in CH Fetal Liver
(A) Total fetal liver cells in E13.5 fetal livers (WT [n = 23]; −77+/− [n = 19]; +9.5+/− [n = 32]; CH [n = 27]). (B) Quantitation of HSCs (LinMac1+CD41CD48CD150+Sca1+Kit+) and MPPs (Lin Mac1+CD41CD48CD150Sca1+Kit+) from flow cytometric analysis of E13.5 fetal livers (WT [n = 12]; −77+/− [n = 6]; +9.5+/− [n = 6]; CH [n = 9]). (C) Quantitation of LinSca1Kit+ cells, CMPs (LinCD34+FcRlowKit+Sca1), GMPs (Lin CD34+FcRhighKit+Sca1), and MEPs (LinCD34FcRlowKit+Sca1) from E13.5 fetal livers (WT [n = 20]; −77+/− [n = 8]; +9.5+/− [n = 20]; CH [n = 20]). (D) Gata2 mRNA quantitation in E13.5 fetal liver CMPs (WT [n = 19]; −77+/− [n = 8]; +9.5+/− [n = 8]; CH [n = 6]). (E) CFU activity of E13.5 fetal liver hematopoietic progenitors. Graphs are adjusted for fetal liver cellularity. Graphs show mean ± SEM; *p < 0.05, **p < 0.01, ***p < 0.001. Significance was analyzed using the 2-tailed unpaired Student’s t test. (F) Representative images of Wright-Giemsa stained cells isolated from all colonies at time of counting. Scale bars, 50 µm.
Figure 3
Figure 3. −77 Gata2 Enhancer Promotes Eythroid Maturation In Vivo
(A) Representative E14.5 −77+/+ and −77−/− embryos and fetal livers. (B) Quantitation of cell numbers in E14.5 fetal livers (−77+/+ [n = 7], −77−/− [n = 7]). (C) Representative Wright-Giemsa images and quantitation of −77+/+ and −77−/− E14.5 total fetal liver populations. Scale bar, 20 µm. ProE, proerythroblast; Baso/Poly, basophilic/polychromatophilic erythroblast; OrthoE, orthochromatic erythroblast; EryP, primitive erythroid; Neu, neutrophil; Mac, macrophage. (−77+/+ [n = 3], −77−/− [n = 3]). (D) Representative flow cytometric analysis and quantitation of R1-R5 populations from E14.5 fetal livers (−77+/+ [n = 7], −77−/− [n = 7]). (E) Quantitation of early (AnnexinV+DRAQ7) and late (AnnexinV+DRAQ7+) apoptotic cells and dead cells (Annexin VDRAQ7+) from R1–R3 populations by flow cytometry (−77+/+ [n = 4]; −77−/− [n = 5]). Graphs show mean ± SEM; *p < 0.05, **p < 0.01, ***p < 0.001. Significance was analyzed using the 2-tailed unpaired Student’s t test.
Figure 4
Figure 4. −77 Gata2 Enhancer Promotes Erythroid Maturation Ex Vivo
Representative flow cytometric analysis and quantitation of R1–R5 populations from E14.5 fetal livers cultured in (A) expansion medium for 72 h (−77+/+ [n = 5]; −77−/− [n = 4]) or (B) expansion media for 72 h then differentiation medium for 48 h (−77+/+ [n=4]; −77−/− [n = 4]). (C) Representative Wright-Giemsa images and quantitation of −77+/+ and −77−/− E14.5 lineage negative cells cultured in expansion system for 72 h. Scale bar, 20 µm. ProE, proerythroblast; Baso/Poly, basophilic/polychromatophilic erythroblast; OrthoE, orthochromatic erythroblast; Neu, neutrophil; Mac, macrophage (−77+/+ [n = 6]; −77−/− [n = 6]). Graphs show means ± SEM; *p < 0.05, **p < 0.01, ***p < 0.001. Significance was analyzed using the 2-tailed unpaired Student’s t test.
Figure 5
Figure 5. −77 Gata2 Enhancer-dependent Transcriptome Establishes Developmental Signaling
(A) Representative flow cytometric analysis of erythroid cells from E14.5 fetal liver using cell surface markers CD71 and Ter119. The R1 (CD71lowTer119) population was also evaluated for presence of monocytes (Mac1+Gr1), granulocytes (Mac1+Gr1+), B cells (B220+) and T cells (CD4/CD8+). (B) Quantitation of Mac1-Gr1, B220, and CD4/CD8 cells in R1 populations (−77+/+ [n = 4]; −77−/− [n = 4]). (C) Quantitation of Gata2 mRNA levels in E14.5 fetal liver R1 cells (−77+/+ [n = 4]; −77−/− [n = 6]). (D) MA plot of RNA-seq–based comparison of R1 transcriptomes from −77+/+ and −77−/− E14.5 fetal livers (−77+/+ [n = 3]; −77−/− [n = 3]). Red points indicate down- or up-regulated genes (false discovery rate (FDR) <0.05). (E) Gene Ontology analysis of genes downregulated in −77−/− R1 cells. The most enriched biological processes are shown with corresponding p values. Genes comprising the erythrocyte differentiation category are shown. (F) Quantitation of Gata1 and Zfpm1 mRNA levels (−77+/+ [n = 4]; −77−/− [n = 6]) and GATA-1 protein levels (−77+/+ [n = 6]; −77−/− [n = 5]) in E14.5 fetal liver R1 cells. (G) Quantitation of Kit mRNA levels (−77+/+ [n = 4]; −77−/− [n = 6]) and cell surface c-Kit mean fluorescence intesity (MFI) (−77+/+ [n = 8]; −77−/− [n = 5]) in E14.5 fetal liver R1 cells. (H) Quantitation of p-Akt MFI after stimulation with 10 ng/ml SCF in −77+/+ and −77−/− Ter119 cells (WT [n = 7]; −77−/− [n = 6]). Graphs show mean ± SEM; *p < 0.05, **p < 0.01, ***p < 0.001. Significance was analyzed using the 2-tailed unpaired Student’s t test.
Figure 6
Figure 6. −77 Gata2 Enhancer Requirement for Burst Forming Unit-Erythroid
(A) Venn diagram depicting overlap between genes regulated by GATA-1 in G1E-ER-GATA-1 cells and by the −77 enhancer in R1 cells. Changes in R1 cell RNA-seq read counts are shown for representative GATA-2-activated genes. Also shown are the relative mRNA levels of these genes in G1E-ER-GATA-1 cells with and without β-estradiol treatment. G1E-ER-GATA-1 Dataset 1; Gene expression changes following 48 h induction of GATA-1 activity by β-estradiol quantified by RNA-seq. G1E-ER-GATA-1 Dataset 2; Gene expression changes following 24 h induction of GATA-1 activity by β-estradiol. Transcripts were quantified by Agilent-028005 SurePrint G3 Mouse GE 8×60K Microarray (Pope and Bresnick, 2013). (B) Venn diagram depicting overlap between GATA-2-activated genes in R1 cells and CMPs (GSE69786). Genes common to both categories are listed. Reductions in Grb10 and Tgfbr3 mRNA expression in −77−/− R1 cells were confirmed by qRT-PCR (−77+/+ [n = 4]; −77−/− [n = 6]). (C) GATA-2 ChIP-seq profiles in GATA-1-null G1E erythroid precursor cells mined from dataset GSM722387. (D) CFU activity of lineage-depleted E14.5 fetal liver cells following shRNA-mediated knockdown of Ryk. Ryk mRNA was quantified by qRT-PCR 3 days post-infection with control (shLuc) or Ryk shRNA-exressing retrovirus. 2000 cells were plated in methylcellulose within 16 h post-infection. Colonies were enumerated on day 8 (n = 6). (E) CFU activity of E14.5 fetal liver R1 cells quantified after 2 (CFU-E) or 8 (BFU-E, CFU-GM and CFU-GEMM) days in methylcellulose. Graphs show mean ± SEM; *p < 0.05, **p < 0.01, ***p < 0.001. Significance was analyzed using the 2-tailed unpaired Student’s t test. (F) Cluster analysis of −77+/+ and −77−/− R1 gene expression and comparison with “early” and “late” BFU-E gene expression signature (Gao et al., 2016).
Figure 7
Figure 7. Model for Gata2 Enhancer-dependent Megakarycytic Erythrocyte Progenitor and Burst Forming Unit-Erythroid Generation
Left, GATA-2-dependent MEP generation. Both −77 and +9.5 enhancers must reside on a single allele to activate Gata2 transcription to establish a genetic network that supports the genesis and/or survival of MEPs, the precursor to erythrocytes and megakaryocytes. Right, GATA-2-dependent BFU-E generation. The −77 enhancer activates Gata2 transcription in erythroid precursors, resulting in a GATA-2-dependent genetic network that supports the genesis and/or survival of BFU-E, the vital erythroid precursor required for erythrocyte development and regeneration. This network parses into two components: (i) GATA-2 activates Gata1 transcription, and GATA-1 regulates a large ensemble of genes that establish the erythroid cell transcriptome. (ii) GATA-2 activates a smaller target gene cohort without a requirement to upregulate GATA-1. In aggregate, the genes establish signaling pathways that support proliferation, differentiation and survival and the vast constituents that comprise the unique phenotype of erythroblasts and their reticulocyte and erythrocyte progeny.

References

    1. Akashi K, Traver D, Miyamoto T, Weissman IL. A clonogenic common myeloid progenitor that gives rise to all myeloid lineages. Nature. 2000;404:193–197. - PubMed
    1. Beck D, Thoms JA, Perera D, Schutte J, Unnikrishnan A, Knezevic K, Kinston SJ, Wilson NK, O'Brien TA, Gottgens B, et al. Genome-wide analysis of transcriptional regulators in human HSPCs reveals a densely interconnected network of coding and noncoding genes. Blood. 2013;122:e12–22. - PubMed
    1. Bresnick EH, Lee HY, Fujiwara T, Johnson KD, Keles S. GATA switches as developmental drivers. J Biol Chem. 2010;285:31087–31093. - PMC - PubMed
    1. Chabot B, Stephenson DA, Chapman VM, Besmer P, Bernstein A. The proto-oncogene c-kit encoding a transmembrane tyrosine kinase receptor maps to the mouse W locus. Nature. 1988;335:88–89. - PubMed
    1. Dang J, Nance S, Ma J, Cheng J, Walsh MP, Vogel P, Easton J, Song G, Rusch M, Gedman AL, et al. AMKL chimeric transcription factors are potent inducers of leukemia. Leukemia 2017 - PMC - PubMed

Substances