

Adductor canal block with local infiltrative analgesia compared with local infiltrate analgesia for pain control after total knee arthroplasty: A meta-analysis of randomized controlled trials
- PMID: 28930857
- PMCID: PMC5617724
- DOI: 10.1097/MD.0000000000008103
Adductor canal block with local infiltrative analgesia compared with local infiltrate analgesia for pain control after total knee arthroplasty: A meta-analysis of randomized controlled trials
Abstract
Background: This meta-analysis aimed to evaluate the efficiency and safety of the combined adductor canal block with peri-articular infiltration versus periarticular infiltration alone for pain control after total knee arthroplasty (TKA).
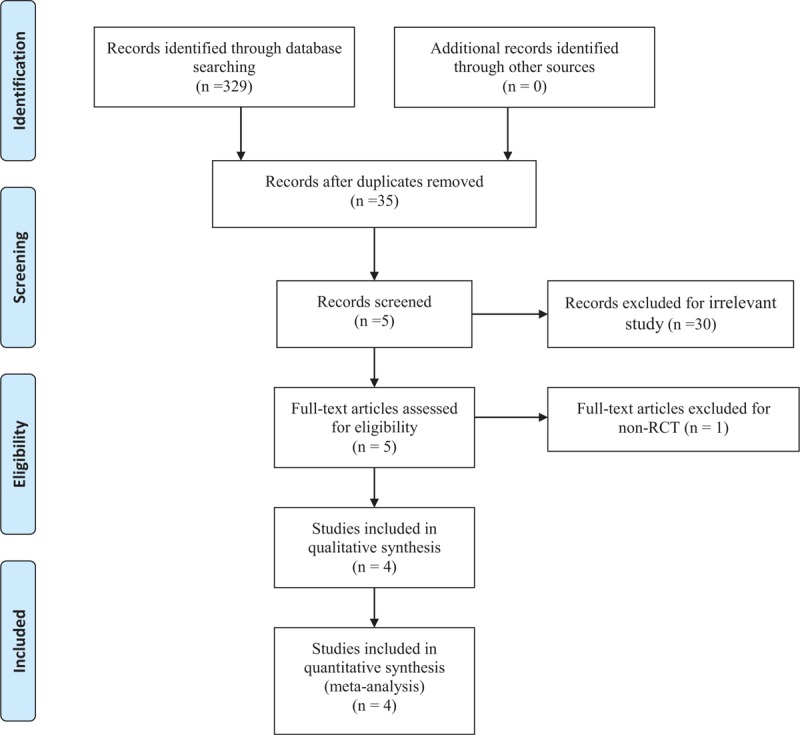
Methods: PubMed, Medline, Embase, Web of Science, and the Cochrane Library were searched to identify articles comparing the combined adductor canal block with peri-articular infiltration and periarticular infiltration alone for pain control after TKA. Main outcomes were numeric rating scale (NRS) at postoperative day (POD) 0-2 and opioid consumption. Meta-analysis was performed using Stata 11.0 software.
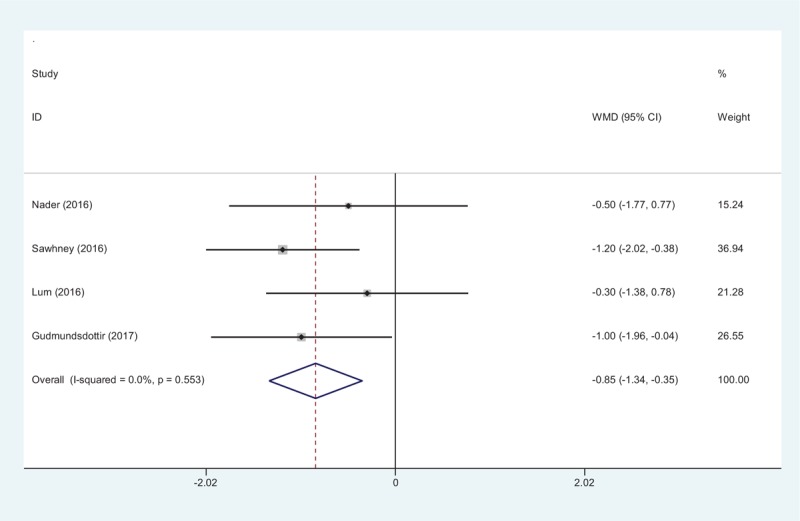
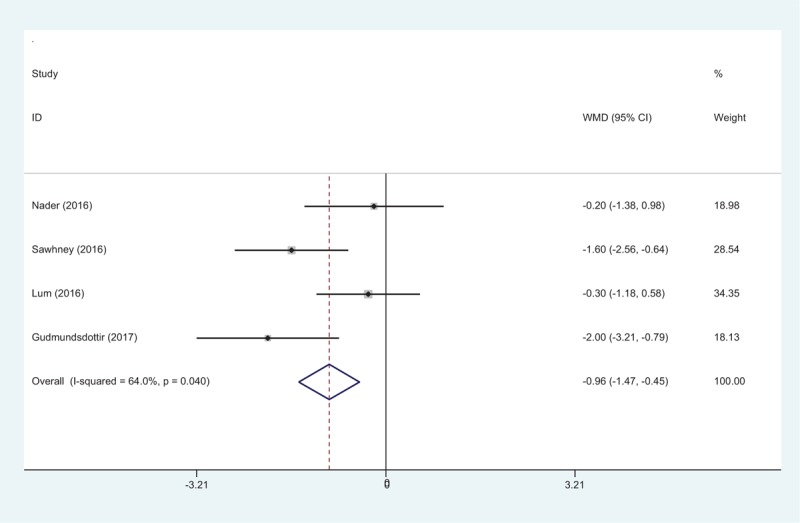
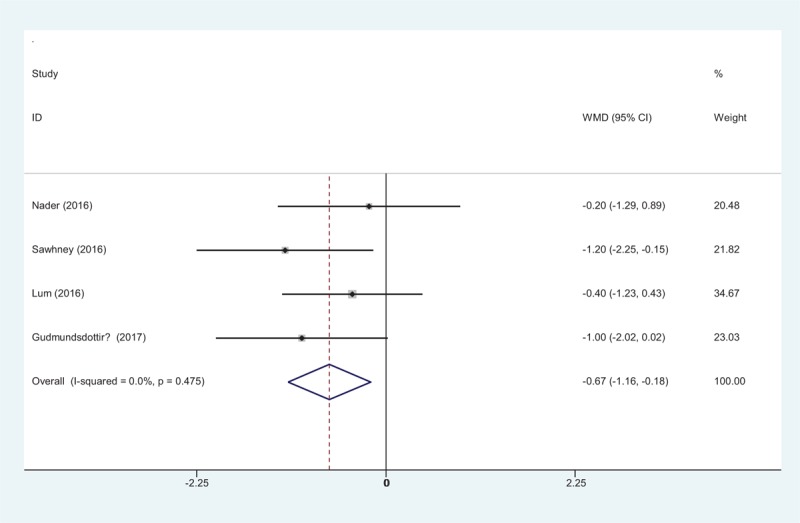
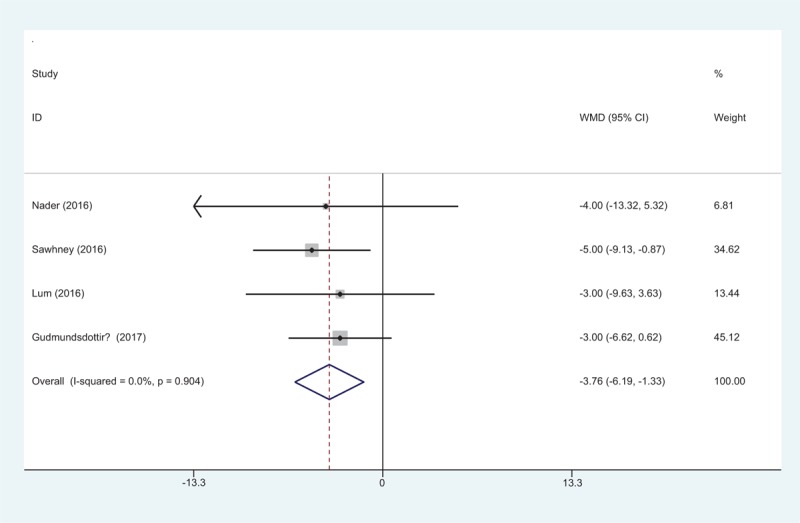
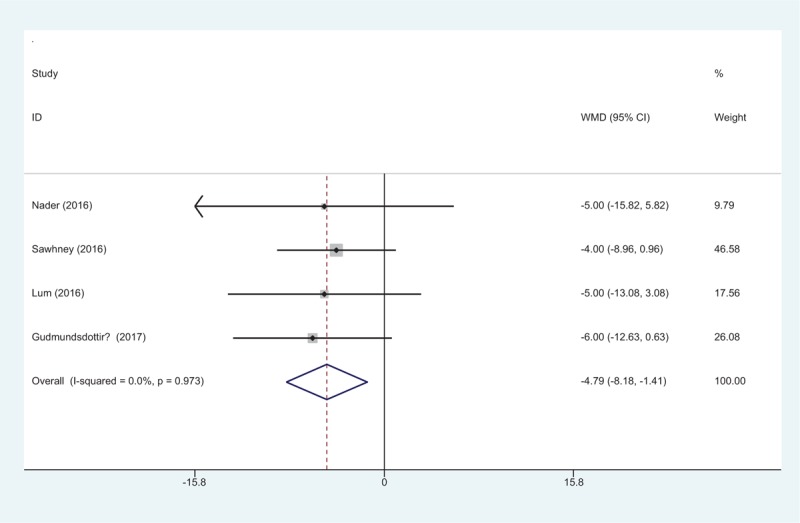
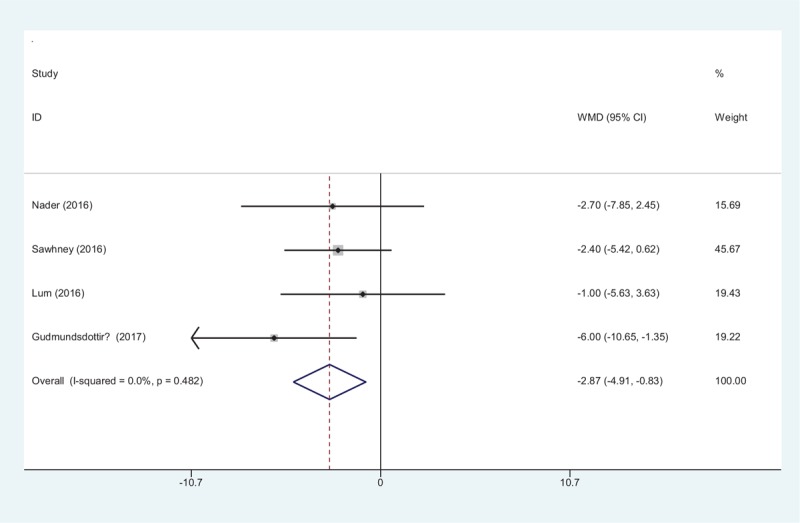
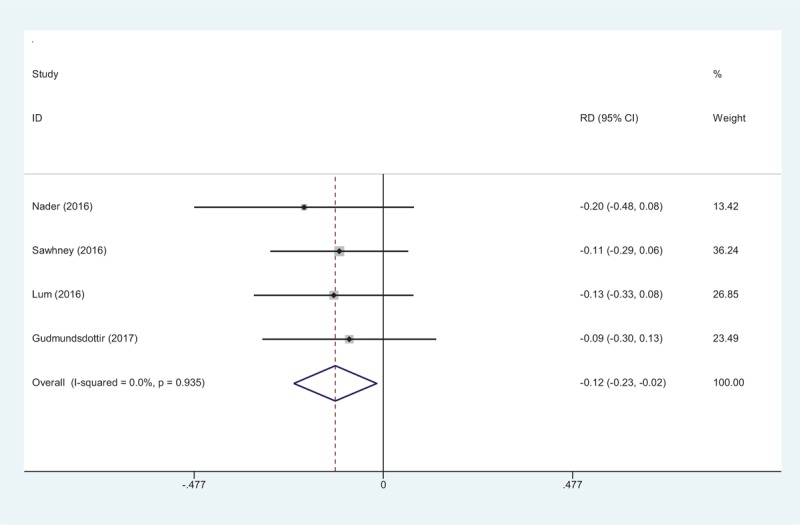
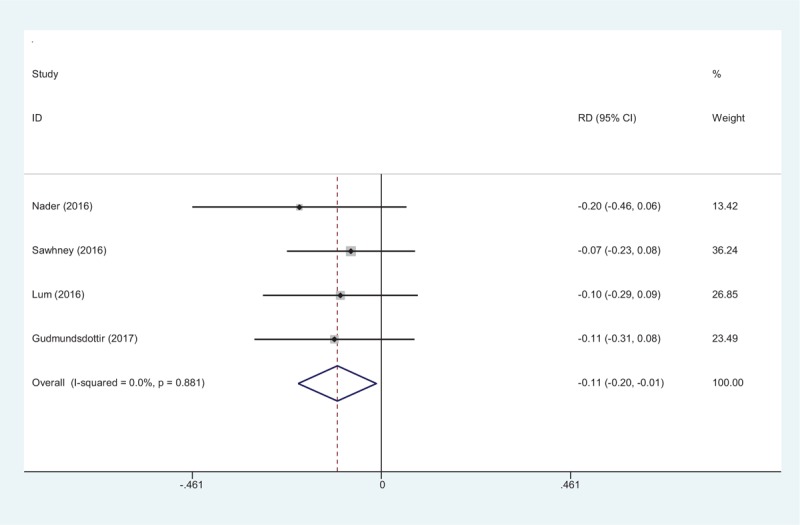
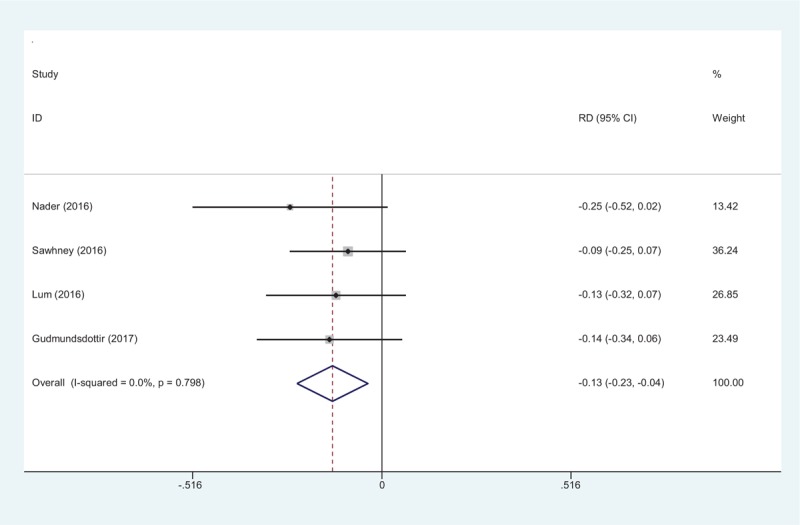
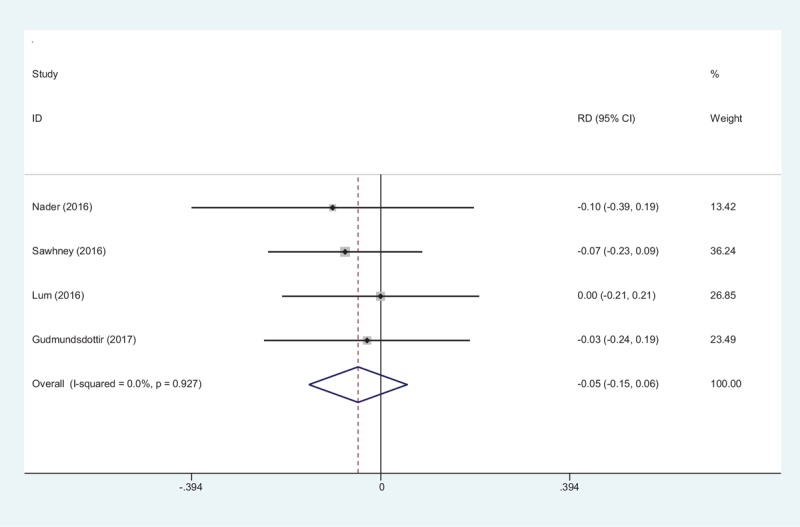
Results: Four randomized controlled trial (RCTs) including 297 patients met the inclusion criteria. The present meta-analysis indicated that there were significant differences between the groups regarding NRS score at POD 0 (weighted mean difference [WMD] = -0.849, 95% confidence interval [CI]: -1.345 to -0.353, P = .001), POD 1 (WMD = -0.960, 95% CI: -1.474 to -0.446, P = .000), and POD 2 (WMD = -0.672, 95% CI: -1.163 to -0.181, P = .007) after TKA. Significant differences were found in terms of opioid consumption at POD 0 (WMD = -3.761, 95% CI: -6.192 to -1.329, P = .002), POD 1 (WMD = -4.795, 95% CI: -8.181 to -1.409, P = .006), and POD 2 (WMD = -2.867, 95% CI: -4.907 to -0.827, P = .006).
Conclusion: Combined adductor canal block with peri-articular infiltration could significantly reduce NRS scores and opioid consumption in comparison with periarticular infiltration alone following TKA. Additionally, there is a lower incidence of nausea and vomiting in the combined groups.
Conflict of interest statement
Conflicts of Interest: The authors declare that they have no competing interests.
Figures
Similar articles
-
Adductor canal block combined with local infiltration analgesia versus isolated adductor canal block in reducing pain and opioid consumption after total knee arthroplasty: a systematic review and meta-analysis.J Int Med Res. 2020 Aug;48(8):300060520926075. doi: 10.1177/0300060520926075. J Int Med Res. 2020. PMID: 32776794 Free PMC article.
-
Dose adductor canal block combined with local infiltration analgesia has a synergistic effect than adductor canal block alone in total knee arthroplasty: a meta-analysis and systematic review.J Orthop Surg Res. 2019 Apr 11;14(1):101. doi: 10.1186/s13018-019-1138-5. J Orthop Surg Res. 2019. PMID: 30971284 Free PMC article.
-
Pain After Unilateral Total Knee Arthroplasty: A Prospective Randomized Controlled Trial Examining the Analgesic Effectiveness of a Combined Adductor Canal Peripheral Nerve Block with Periarticular Infiltration Versus Adductor Canal Nerve Block Alone Versus Periarticular Infiltration Alone.Anesth Analg. 2016 Jun;122(6):2040-6. doi: 10.1213/ANE.0000000000001210. Anesth Analg. 2016. PMID: 27028771 Clinical Trial.
-
Single-Dose Adductor Canal Block With Local Infiltrative Analgesia Compared With Local Infiltrate Analgesia After Total Knee Arthroplasty: A Randomized, Double-Blind, Placebo-Controlled Trial.Reg Anesth Pain Med. 2016 Nov-Dec;41(6):678-684. doi: 10.1097/AAP.0000000000000494. Reg Anesth Pain Med. 2016. PMID: 27776098 Clinical Trial.
-
The Efficacy and Safety of Combined Adductor Canal Block with Periarticular Anesthetic Injection Following Primary Total Knee Arthroplasty: A Meta-Analysis.J Invest Surg. 2020 Dec;33(10):904-913. doi: 10.1080/08941939.2019.1579278. Epub 2019 Mar 19. J Invest Surg. 2020. PMID: 30885020
Cited by
-
Comparison of Efficacy of Adductor Canal Block, Local Infiltration Analgesia and Both Combined in Postoperative Pain Management After Total Knee Arthroplasty: A Randomized Controlled Trial.Indian J Orthop. 2021 Sep 24;55(5):1111-1117. doi: 10.1007/s43465-021-00482-7. eCollection 2021 Oct. Indian J Orthop. 2021. PMID: 34824710 Free PMC article.
-
[Perioperative management and fast track in knee arthroplasty].Orthopadie (Heidelb). 2024 Nov;53(11):833-839. doi: 10.1007/s00132-024-04569-5. Epub 2024 Oct 7. Orthopadie (Heidelb). 2024. PMID: 39373777 Review. German.
-
Adductor Canal Blocks Are Not Associated With Improved Early Postoperative Outcomes in Patients Undergoing Total Knee Arthroplasty.Ochsner J. 2023 Spring;23(1):9-15. doi: 10.31486/toj.22.0074. Ochsner J. 2023. PMID: 36936480 Free PMC article.
-
Local infiltration anesthesia versus epidural analgesia for postoperative pain control in total knee arthroplasty: a systematic review and meta-analysis.J Orthop Surg Res. 2018 May 16;13(1):112. doi: 10.1186/s13018-018-0770-9. J Orthop Surg Res. 2018. PMID: 29769140 Free PMC article.
-
Sublingual sufentanil (Zalviso) patient-controlled analgesia after total knee arthroplasty: a retrospective comparison with oxycodone with or without dexamethasone.J Pain Res. 2018 Dec 14;11:3205-3210. doi: 10.2147/JPR.S185197. eCollection 2018. J Pain Res. 2018. PMID: 30588072 Free PMC article. Review.
References
-
- Begue T, Mebtouche N, Levante S. One-stage procedure for total knee arthroplasty in post-traumatic osteoarthritis of the knee with wound defect. Usefulness of navigation and flap surgery. Knee 2012;19:948–50. - PubMed
-
- Hadzic A, Houle TT, Capdevila X, et al. Femoral nerve block for analgesia in patients having knee arthroplasty. Anesthesiology 2010;113:1014–5. - PubMed
-
- Ritter MA. Postoperative pain after total knee arthroplasty. J Arthroplasty 1997;12:337–9. - PubMed
-
- Li D, Tan Z, Kang P, et al. Effects of multi-site infiltration analgesia on pain management and early rehabilitation compared with femoral nerve or adductor canal block for patients undergoing total knee arthroplasty: a prospective randomized controlled trial. Int Orthop 2017;41:75–83. - PubMed
-
- Ilahi OA, Davidson JP, Tullos HS. Continuous epidural analgesia using fentanyl and bupivacaine after total knee arthroplasty. Clin Orthop Relat Research 1994;44–52. - PubMed
Publication types
MeSH terms
Substances
LinkOut - more resources
Full Text Sources
Other Literature Sources
Medical
Miscellaneous
