

Challenges and advances for transcriptome assembly in non-model species
- PMID: 28931057
- PMCID: PMC5607178
- DOI: 10.1371/journal.pone.0185020
Challenges and advances for transcriptome assembly in non-model species
Abstract
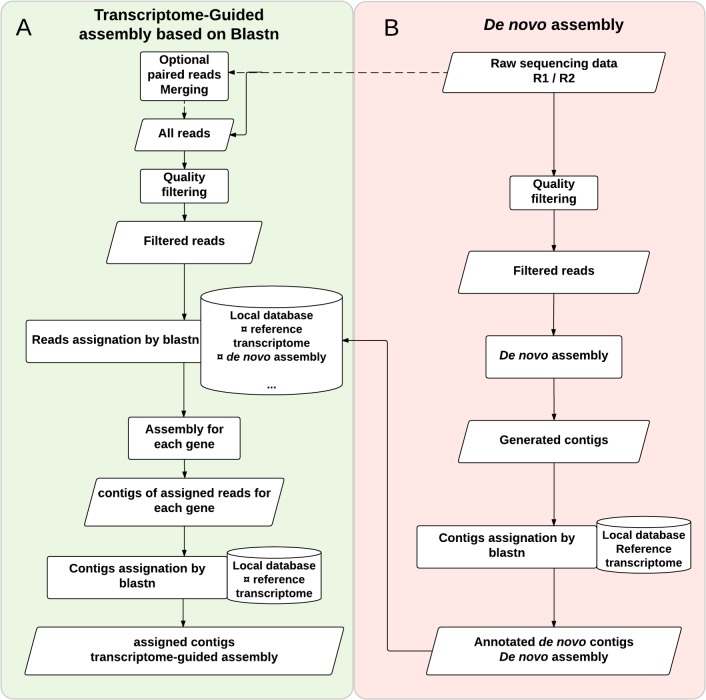
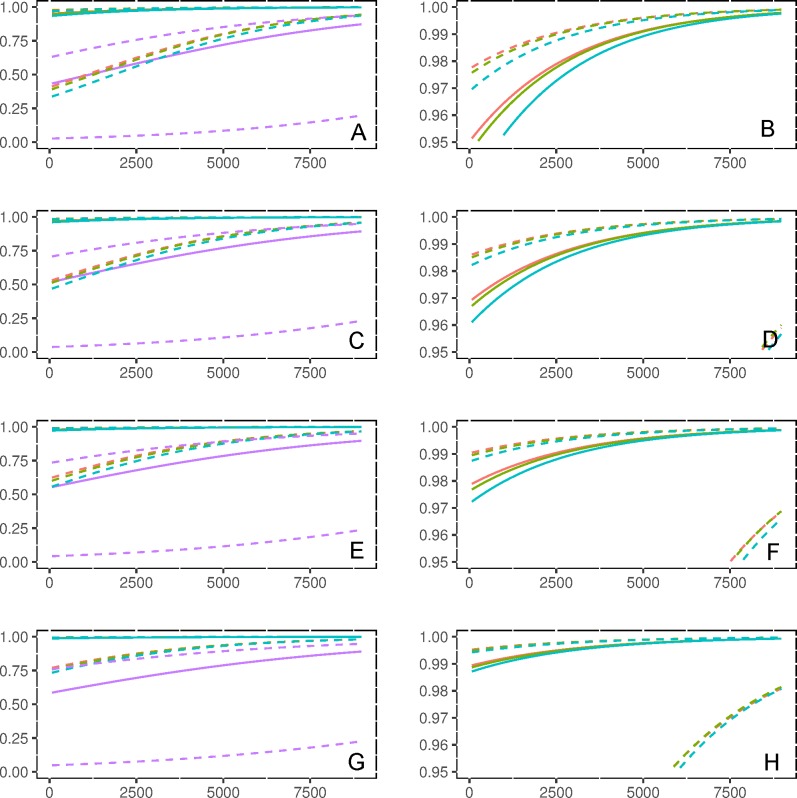
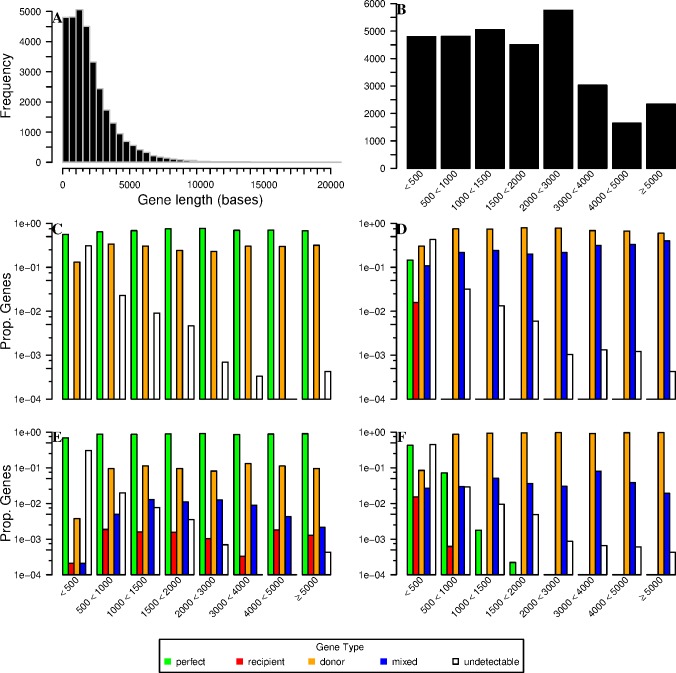
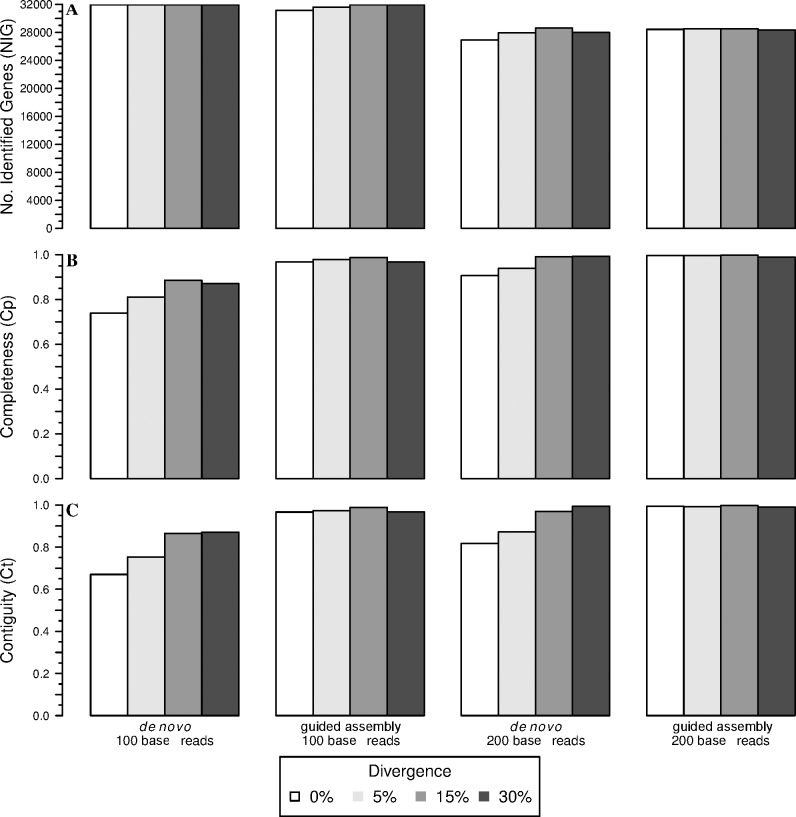
Analyses of high-throughput transcriptome sequences of non-model organisms are based on two main approaches: de novo assembly and genome-guided assembly using mapping to assign reads prior to assembly. Given the limits of mapping reads to a reference when it is highly divergent, as is frequently the case for non-model species, we evaluate whether using blastn would outperform mapping methods for read assignment in such situations (>15% divergence). We demonstrate its high performance by using simulated reads of lengths corresponding to those generated by the most common sequencing platforms, and over a realistic range of genetic divergence (0% to 30% divergence). Here we focus on gene identification and not on resolving the whole set of transcripts (i.e. the complete transcriptome). For simulated datasets, the transcriptome-guided assembly based on blastn recovers 94.8% of genes irrespective of read length at 0% divergence; however, assignment rate of reads is negatively correlated with both increasing divergence level and reducing read lengths. Nevertheless, we still observe 92.6% of recovered genes at 30% divergence irrespective of read length. This analysis also produces a categorization of genes relative to their assignment, and suggests guidelines for data processing prior to analyses of comparative transcriptomics and gene expression to minimize potential inferential bias associated with incorrect transcript assignment. We also compare the performances of de novo assembly alone vs in combination with a transcriptome-guided assembly based on blastn both via simulation and empirically, using data from a cyprinid fish species and from an oak species. For any simulated scenario, the transcriptome-guided assembly using blastn outperforms the de novo approach alone, including when the divergence level is beyond the reach of traditional mapping methods. Combining de novo assembly and a related reference transcriptome for read assignment also addresses the bias/error in contigs caused by the dependence on a related reference alone. Empirical data corroborate these findings when assembling transcriptomes from the two non-model organisms: Parachondrostoma toxostoma (fish) and Quercus pubescens (plant). For the fish species, out of the 31,944 genes known from D. rerio, the guided and de novo assemblies recover respectively 20,605 and 20,032 genes but the performance of the guided assembly approach is much higher for both the contiguity and completeness metrics. For the oak, out of the 29,971 genes known from Vitis vinifera, the transcriptome-guided and de novo assemblies display similar performance, but the new guided approach detects 16,326 genes where the de novo assembly only detects 9,385 genes.
Conflict of interest statement
Figures
References
-
- Nikinmaa M, McCairns RJS, Nikinmaa MW, Vuori KA, Kanerva M, Leinonen T, et al. Transcription and redox enzyme activities: comparison of equilibrium and disequilibrium levels in the three-spined stickleback. Proceedings of the Royal Society B: Biological Sciences. 2013;280: 20122974–20122974. doi: 10.1098/rspb.2012.2974 - DOI - PMC - PubMed
-
- Bar-Even A, Paulsson J, Maheshri N, Carmi M, O’Shea E, Pilpel Y, et al. Noise in protein expression scales with natural protein abundance. Nat Genet. 2006;38: 636–643. doi: 10.1038/ng1807 - DOI - PubMed
-
- Alvarado S, Rajakumar R, Abouheif E, Szyf M. Epigenetic variation in the Egfr gene generates quantitative variation in a complex trait in ants. Nat Commun. 2015;6: 6513 doi: 10.1038/ncomms7513 - DOI - PubMed
-
- Ayroles JF, Carbone MA, Stone EA, Jordan KW, Lyman RF, Magwire MM, et al. Systems genetics of complex traits in Drosophila melanogaster. Nat Genet. 2009;41: 299–307. doi: 10.1038/ng.332 - DOI - PMC - PubMed
-
- Leder EH, McCairns RJS, Leinonen T, Cano JM, Viitaniemi HM, Nikinmaa M, et al. The evolution and adaptive potential of transcriptional variation in sticklebacks—signatures of selection and widespread heritability. Mol Biol Evol. 2015;32: 674–689. doi: 10.1093/molbev/msu328 - DOI - PMC - PubMed
MeSH terms
LinkOut - more resources
Full Text Sources
Other Literature Sources
