Semi-automated quantification of hard exudates in colour fundus photographs diagnosed with diabetic retinopathy
- PMID: 28931389
- PMCID: PMC5607622
- DOI: 10.1186/s12886-017-0563-7
Semi-automated quantification of hard exudates in colour fundus photographs diagnosed with diabetic retinopathy
Abstract
Background: Hard exudates (HEs) are the classical sign of diabetic retinopathy (DR) which is one of the leading causes of blindness, especially in developing countries. Accordingly, disease screening involves examining HEs qualitatively using fundus camera. However, for monitoring the treatment response, quantification of HEs becomes crucial and hence clinicians now seek to measure the area of HEs in the digital colour fundus (CF) photographs. Against this backdrop, we proposed an algorithm to quantify HEs using CF images and compare with previously reported technique using ImageJ.
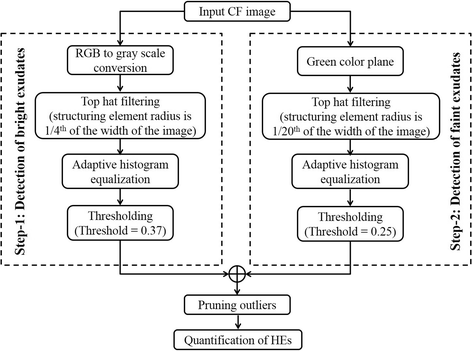
Methods: CF photographs of 30 eyes (20 patients) with diabetic macular edema were obtained. A robust semi-automated algorithm was developed to quantify area covered by HEs. In particular, the proposed algorithm, a two pronged methodology, involved performing top-hat filtering, second order statistical filtering, and thresholding of the colour fundus images. Subsequently, two masked observers performed HEs measurements using previously reported ImageJ-based protocol and compared with those obtained through proposed method. Intra and inter-observer grading was performed for determining percentage area of HEs identified by the individual algorithm.
Results: Of the 30 subjects, 21 were males and 9 were females with a mean age of the 50.25 ± 7.80 years (range 33-66 years). The correlation between the two measurements of semi-automated and ImageJ were 0.99 and 0.99 respectively. Previously reported method detected only 0-30% of the HEs area in 9 images, 30-60% in 12 images and 60-90% in remaining images, and more than 90% in none. In contrast, proposed method, detected 60-90% of the HEs area in 13 images and 90-100% in remaining 17 images.
Conclusion: Proposed method semi-automated algorithm achieved acceptable accuracy, qualitatively and quantitatively, on a heterogeneous dataset. Further, quantitative analysis performed based on intra- and inter-observer grading showed that proposed methodology detects HEs more accurately than previously reported ImageJ-based technique. In particular, we proposed algorithm detect faint HEs also as opposed to the earlier method.
Keywords: Automated quantification; Colour fundus photography; Diabetic retinopathy; Disease management; Hard exudates; ImageJ; Macular edema.
Conflict of interest statement
Ethics approval and consent to participate
Approval from Intuitional Review Board, L V Prasad Eye Institute, Hyderabad, India. The study was conducted in accordance with the tenets of the Declaration of Helsinki.
Consent for publication
None
Competing interests
The authors declare that they have no competing interests.
Publisher’s Note
Springer Nature remains neutral with regard to jurisdictional claims in published maps and institutional affiliations.
Figures


References
-
- Yamaguchi M, Nakao S, Kaizu Y, Kobayashi Y, Nakama T, Arima M, Yoshida S, Oshima Y, Takeda A, Ikeda Y. High-resolution imaging by adaptive optics scanning laser ophthalmoscopy reveals two morphologically distinct types of retinal hard exudates. Sci Rep. 2016;6:33574. doi: 10.1038/srep33574. - DOI - PMC - PubMed
Publication types
MeSH terms
LinkOut - more resources
Full Text Sources
Other Literature Sources
Medical

