. 2017 Sep 20;18(1):180.
doi: 10.1186/s13059-017-1310-3.

Topological organization and dynamic regulation of human tRNA genes during macrophage differentiation

Affiliations

Topological organization and dynamic regulation of human tRNA genes during macrophage differentiation

Kevin Van Bortle et al. Genome Biol. .

Abstract

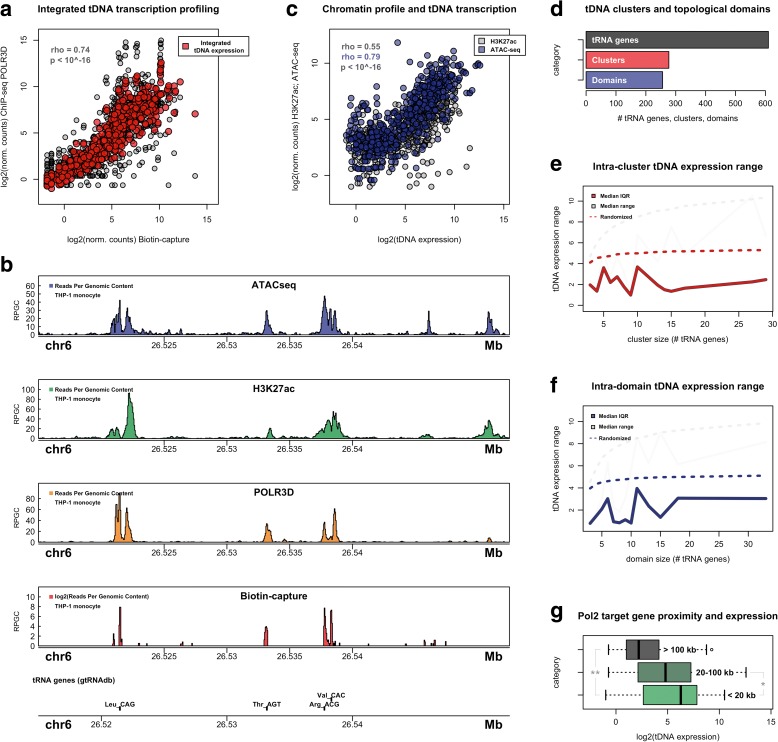
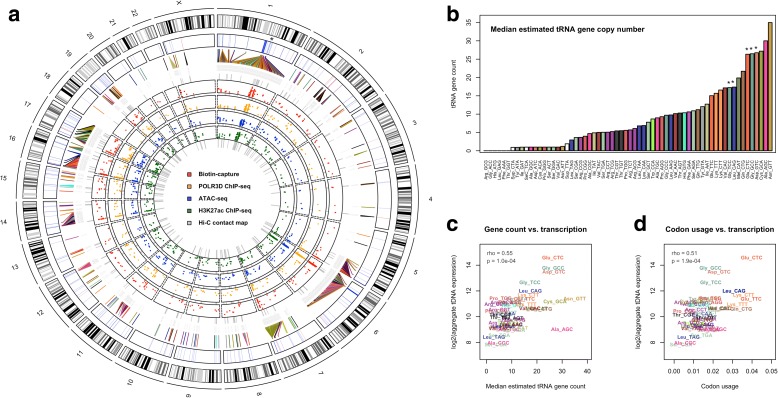
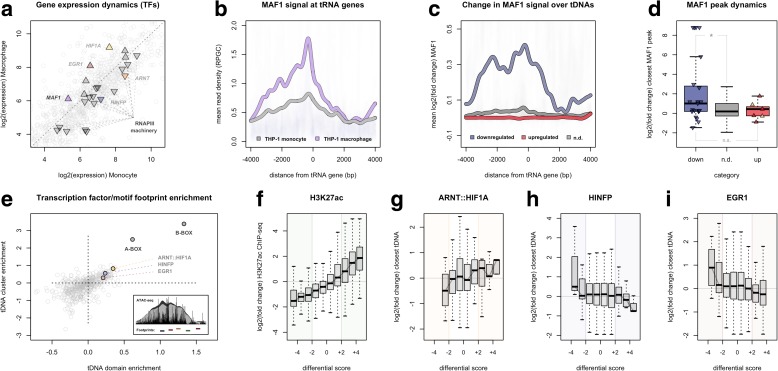
Background: The human genome is hierarchically organized into local and long-range structures that help shape cell-type-specific transcription patterns. Transfer RNA (tRNA) genes (tDNAs), which are transcribed by RNA polymerase III (RNAPIII) and encode RNA molecules responsible for translation, are dispersed throughout the genome and, in many cases, linearly organized into genomic clusters with other tDNAs. Whether the location and three-dimensional organization of tDNAs contribute to the activity of these genes has remained difficult to address, due in part to unique challenges related to tRNA sequencing. We therefore devised integrated tDNA expression profiling, a method that combines RNAPIII mapping with biotin-capture of nascent tRNAs. We apply this method to the study of dynamic tRNA gene regulation during macrophage development and further integrate these data with high-resolution maps of 3D chromatin structure.

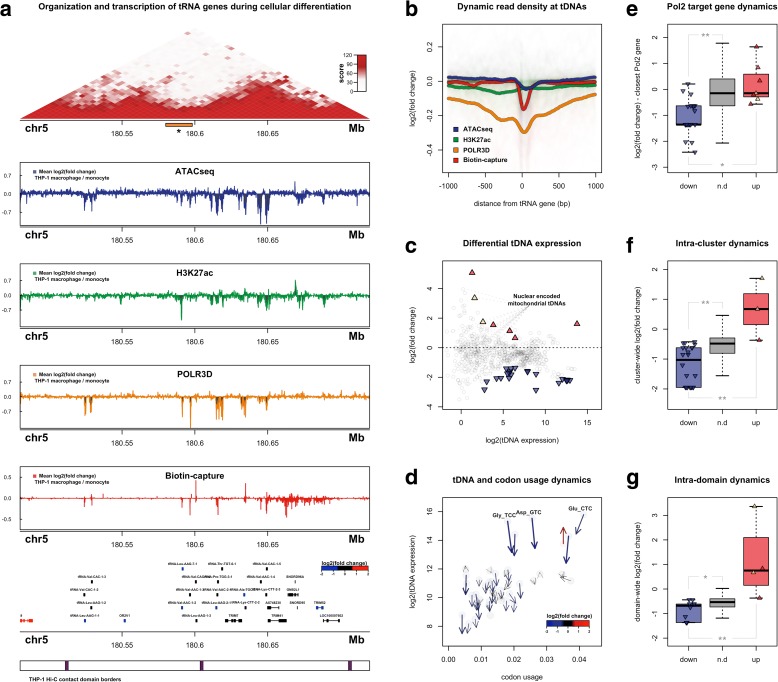
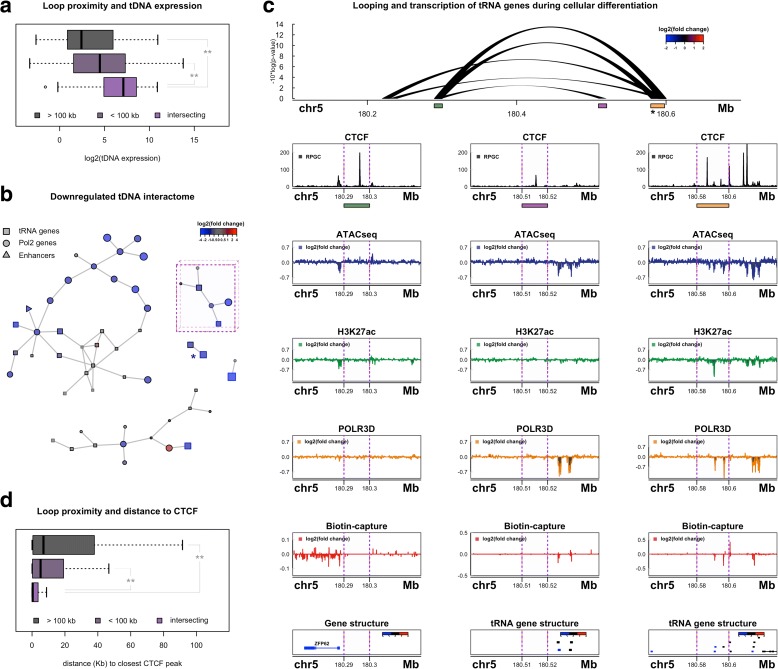
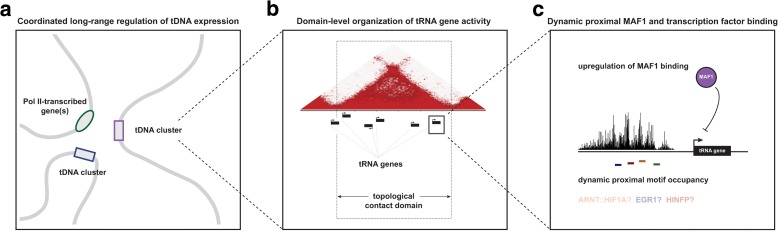
Results: Integrated tDNA expression profiling reveals domain-level and loop-based organization of tRNA gene transcription during cellular differentiation. tRNA genes connected by DNA loops, which are proximal to CTCF binding sites and expressed at elevated levels compared to non-loop tDNAs, change coordinately with tDNAs and protein-coding genes at distal ends of interactions mapped by in situ Hi-C. We find that downregulated tRNA genes are specifically marked by enhanced promoter-proximal binding of MAF1, a transcriptional repressor of RNAPIII activity, altogether revealing multiple levels of tDNA regulation during cellular differentiation.

Conclusions: We present evidence of both local and coordinated long-range regulation of human tDNA expression, suggesting the location and organization of tRNA genes contribute to dynamic tDNA activity during macrophage development.

Keywords: Biotin-capture; CTCF; Hi-C; TFIIIC; Topologically associating domains; tDNA; tRNAome.


Conflict of interest statement

Ethics approval and consent to participate

Not applicable.

Competing interests

MPS is a founder and member of the science advisory board of Personalis and Qbio and a science advisory board member of Genapsys and Epinomics.

Publisher’s Note

Springer Nature remains neutral with regard to jurisdictional claims in published maps and institutional affiliations.

Figures

Fig. 1
Fig. 1
Integrated tDNA expression and chromatin profiling in THP-1 monocytes. a Correlation between tRNA gene expression as measured by biotin-capture of nascent, demethylated tRNAs and by RNA polymerase III occupancy mapping by ChIP-seq (black; Spearman’s rank correlation coefficient = 0.74; p < 10^-16). Integrated tDNA expression profile (red) utilizes the mean normalized count for each tRNA gene. b Example signal track representation of the chromatin accessibility (ATAC-seq, blue), active histone signature H3K27 acetylation (ChIP-seq, green), RNA polymerase III occupancy (ChIP-seq, orange), and nascently transcribed RNA (Biotin-capture, red) at a tDNA cluster located on chromosome 6. RPGC mean normalized reads per genomic content. c Correlation between integrated tDNA expression profile with H3K27ac ChIP-seq levels surrounding tRNA genes (black; Spearman’s rank correlation coefficient = 0.55; p < 10^-16) and with chromatin accessibility at tRNA genes as measured by ATAC-seq (blue; Spearman’s rank correlation coefficient = 0.79; p < 10^-16). d Number of tRNA genes, tDNA clusters, and physical contact domains containing tRNA genes in human THP-1 cells. e Median intra-cluster tDNA expression range (gray) and interquartile range (IQR; red) as a function of tDNA cluster size (number of tRNA genes present within each cluster). Dotted lines represent median range and IQR for randomly shuffled tRNA genes within tDNA clusters (100,000 permutations). f Median intra-domain tDNA expression range (gray) and IQR (blue) as a function of tDNA contact domain size (number of tRNA genes located within each contact domain). Dotted lines represent median range and IQR for randomly shuffled tRNA genes within contact domains (100,000 permutations). In the case of overlapping contact domains, tRNA genes were assigned to the single smallest resident domain. g Distribution of integrated tDNA expression values segregated by proximity to nearest RNA polymerase II-transcribed gene (>100 Kb; n = 81; 20–100 Kb; n = 232; < 20 Kb; n = 295; **p = 1.18^-10, *p = 0.02, Wilcoxon rank-sum test)
Fig. 2
Fig. 2
Organization and transcription of multicopy tRNA genes in humans. a Circular visualization of human tRNA gene coordinates across human chromosomes. Track descriptions from outermost moving inward: (1) Individual chromosome ideograms and cytogenetic band positions. (2) Location of tRNA genes (blue) and nuclear-encoded mitochondrial nmt-tRNA genes (red). *Asterisk represents approximate location of variable number tandem repeat (VNTR) on chromosome 1. (3) tRNA genes labeled by tRNA anticodon family and colored by amino acid isoacceptor family (note: not all tDNAs are directly labeled due to size and legibility constraints). (4) Biotin-capture based assay measuring nascent demethylated tRNAs (red). (5) ChIP-seq experiments mapping RNA polymerase III occupancy on tRNA genes (orange). (6) ATAC-seq experiments measuring chromatin accessibility at tRNA genes (blue). (7) ChIP-seq experiments capturing H3K27 acetylation levels at tRNA genes (green). (8) Link-plot of DNA loops identified by in situ Hi-C experiments proximal to tRNA genes (gray). b Median estimated human tRNA gene count for each anticodon tRNA family, colored by amino acid, as determined using a read-depth approach over several deeply sequenced whole-genome datasets from the 1000 Genomes Project. *Asterisks represent tRNA-types located on VNTR that show significant variation across sampled individuals. c Correlation between integrated tDNA expression, collapsed by anticodon tRNA family, with multi-copy tRNA gene count (Spearman’s rank correlation coefficient = 0.55; p = 1.0e-04). d Correlation between integrated tDNA expression, collapsed by anticodon tRNA family, and the frequency of cognate codon usage in the THP-1 transcriptome for multicopy tRNA genes (Spearman’s rank correlation coefficient = 0.51; p = 1.9e-04)
Fig. 3
Fig. 3
Dynamic domain-level regulation of tRNA gene transcription during macrophage differentiation. a Visualization of chromatin and transcriptional dynamics at an example tDNA locus on chromosome 5. Top: in situ Hi-C contact frequency matrix in THP-1 monocytes. *Asterisk represents long-range loop anchor region presented in Fig. 4c. Middle: mean log2(fold change) signal tracks for chromatin accessibility (ATAC-seq; blue), H3K27 acetylation (ChIP-seq; green), RNA polymerase III occupancy (ChIP-seq; orange), and nascent RNA (Biotin-capture RNA-seq; red) across two adjacent contact domains and neighboring tDNA clusters. Bottom: gene structure and physical contact domain border locations. log2(fold change) represents ± 72 h PMA treatment. Gene structure includes both tRNA genes and proximal RNAPII-transcribed genes. Lower panel depicts corresponding contact domain borders in THP-1 monocytes. b Mean log2(fold change) in normalized signal track read density for ATAC-seq, H3K27ac, POLR3D, and Biotin-capture RNA-seq across all human tRNA genes ± 1 Kb (−1000 upstream, +1000 downstream). c Mean log2(fold change) of integrated tDNA expression values across individual tRNA genes and mean log2(integrated tDNA expression) comparing THP-1 cells ± 72 h PMA treatment. Triangles represent individual tRNA genes that are upregulated (red) and downregulated (blue) at an FDR threshold of 0.15, including significant nmt-tDNAs (gold). d Arrow plot representation of aggregate nascent tRNA dynamics collapsed by tRNA-type vs. codon usage frequency (labeled by anticodon). Arrow-head represents log2(tDNA expression) and cognate codon usage after 72 h PMA treatment; arrow-bottom represents log2(tDNA expression) and cognate codon usage in untreated THP-1 monocytes. e log2(fold change) in closest RNAPII-transcribed genes for downregulated (blue), upregulated (red), and non-differential (n.d., gray) tRNA genes (top **p = 1.58^-5; bottom *p = 0.047, Wilcoxon rank-sum test). f Median cluster-wide log2(fold change) for tDNA clusters harboring downregulated (blue), upregulated (red), and non-differential (gray) tRNA genes (top **p = 0.0056, bottom **p = 6.41^-6, Wilcoxon rank-sum test). g Median contact domain-wide log2(fold change) for tDNA clusters harboring downregulated (blue), upregulated (red), and non-differential (gray) tRNA genes (top *p = 0.016; bottom **p = 0.0022, Wilcoxon rank-sum test)
Fig. 4
Fig. 4
Coordinated long-range regulation of tRNA genes during cellular differentiation. a Distribution of integrated tDNA expression levels for tRNA genes > 100 Kb from a DNA loop end, within 100 Kb of a DNA loop end, and for tRNA genes that directly intersect DNA loop ends (left **p = 1.12^-6, right **p = 2.49^-11, Wilcoxon rank-sum test). b Network analysis of long-range interactions connecting tRNA genes downregulated in THP-1-derived macrophages. Each edge represents a DNA loop connecting two vertices (DNA loop anchors) that contain tRNA genes (square), RNAPII-transcribed genes (circle), or intergenic enhancers marked by H3K27 acetylation (triangle). Vertices with black frames represent loop anchors in which the identified feature (i.e. tRNA gene(s)) directly intersects the DNA loop end. Vertices without black frames represent loop anchors in which the identified feature is proximal to the DNA loop end (within 20 Kb). Both the size and color of each vertex is scaled by the mean log2(fold change) for resident feature(s). Purple outline marks the sub-community example further depicted in Fig. 4c. *Asterisk represents sub-community example further depicted in Additional file 1: Figure S5. c Visualization of chromatin and transcriptional dynamics at an example tDNA loop community located on chromosome 5. Colored rectangles define loop anchor regions further depicted below. *Asterisk represents loop anchor region depicted in Fig. 3a. Bottom left: signal track representation of CTCF binding sites (black, RPGC mean normalized reads per genomic content) and mean log2(fold change) for ATAC-seq (blue), H3K27ac (green), RNAPIII (orange), and nascent RNA (red) at the far-left loop anchor (green rectangle). Gene structure below includes RNAPII-transcribed gene ZFP62. Vertical dotted lines demarcate the actual loop anchor region. Bottom middle: analogous signal tracks depicting chromatin and transcriptional landscape at the middle loop anchor (purple rectangle) and proximal tDNA cluster. Bottom right: analogous signal tracks for the far-right loop anchor (orange rectangle) and intersecting tRNA genes. d Nearest distance to a CTCF binding site for tRNA genes that intersect DNA loop anchors, are within 100 Kb of a DNA loop anchor, or farther than 100 Kb from a DNA loop anchor (left **p = 2.31^-8, right **p = 6.61^-9, Wilcoxon rank-sum test)
Fig. 5
Fig. 5
Differential transcription of tRNA genes coincides with enhanced MAF1 occupancy and dynamic TF binding. a Comparison of log2(expression) levels for TFs in THP-1 monocytes (x-axis) and THP-1 macrophages (y-axis). Triangles represent relevant genes encoding RNAPIII transcription machinery (black), MAF1 (purple), ARNT (orange), HIF1A (yellow), HINFP (blue), and EGR1 (red). Triangles do not denote statistical significance. b Mean read density of MAF1 ChIP-seq (RPGC mean normalized read per genomic content) at all tRNA genes in THP-1 cells before (gray) and after treatment with PMA (purple). c Mean log2(fold change) of MAF1 ChIP-seq read density at all downregulated (blue), upregulated (red), and non-differential (gray, n.d.) tRNA genes. d log2(fold change) of the closest MAF1 ChIP-seq peak for all downregulated (blue), upregulated (red), and non-differential (gray) tRNA genes (*p = 0.024, n.s. not statistically significant; Wilcoxon rank-sum test). e Enrichment of TF footprints identified by PIQ [75] within tDNA domains (x-axis) and clusters (y-axis). Enrichment measured as log10(observed/expected). Inset: illustration of ATAC-seq based footprinting analysis. Read ends represent hyperaccessible DNA adjacent to protected TF binding sites. f Comparison of dynamic H3K27ac levels at all footprints identified by PIQ. Differential accessibility scores were binned by the number of standard deviations from the average differential score across more than 2 million footprints (Additional file 1: Figure S6b). (+) denotes increased accessibility score, (−) denotes decreased accessibility score. Colored overlay represents strong differential accessibility score (≥2 standard deviations from the mean differential score) in THP-1-derived macrophages. g Comparison of dynamic ARNT::HIF1A footprint accessibility with the change in integrated tDNA expression at the nearest tDNA. h Comparison of dynamic HINFP footprint accessibility with the change in integrated tDNA expression at the nearest tDNA. i Comparison of dynamic EGR1 footprint accessibility with the change in integrated tDNA expression at the nearest tDNA
Fig. 6
Fig. 6
Model of multi-level tRNA gene regulation during macrophage development. a DNA loops bring together distal tRNA genes, RNAPII-transcribed genes, and enhancers that are coordinately downregulated during macrophage differentiation. b tDNAs are locally organized into clusters and physical contact domains that share similar activity and differential expression patterns in THP-1 cells. c Dynamic tDNA transcription correlates with proximal motif occupancy for specific, putative regulatory factors, such as HIF1A and EGR1. Downregulation of tRNA genes coincides with enhanced promoter-proximal binding of MAF1, a negative effector of RNAPIII activity

References

    1. Qian W, Yang JR, Pearson NM, Maclean C, Zhang J. Balanced codon usage optimizes eukaryotic translational efficiency. PLoS Genet. 2012;8:e1002603. doi: 10.1371/journal.pgen.1002603. - DOI - PMC - PubMed
    1. Novoa EM, Ribas de Pouplana L. Speeding with control: codon usage, tRNAs, and ribosomes. Trends Genet. 2012;28:574–81. doi: 10.1016/j.tig.2012.07.006. - DOI - PubMed
    1. Gingold H, Tehler D, Christoffersen NR, Nielsen MM, Asmar F, Kooistra SM, et al. A dual program for translation regulation in cellular proliferation and differentiation. Cell. 2014;158:1281–92. doi: 10.1016/j.cell.2014.08.011. - DOI - PubMed
    1. Pelechano V, Wei W, Steinmetz LM. Widespread co-translational RNA decay reveals ribosome dynamics. Cell. 2015;161:1400–12. doi: 10.1016/j.cell.2015.05.008. - DOI - PMC - PubMed
    1. Pang YL, Abo R, Levine SS, Dedon PC. Diverse cell stresses induce unique patterns of tRNA up- and down-regulation: tRNA-seq for quantifying changes in tRNA copy number. Nucleic Acids Res. 2014;42:e170. doi: 10.1093/nar/gku945. - DOI - PMC - PubMed

Publication types

LinkOut - more resources