

Role of GABAA receptors in alcohol use disorders suggested by chronic intermittent ethanol (CIE) rodent model
- PMID: 28931433
- PMCID: PMC5605989
- DOI: 10.1186/s13041-017-0325-8
Role of GABAA receptors in alcohol use disorders suggested by chronic intermittent ethanol (CIE) rodent model
Abstract
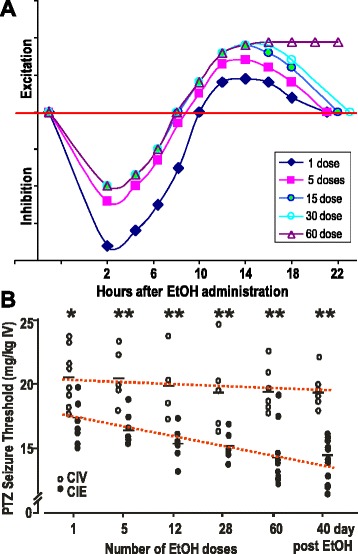
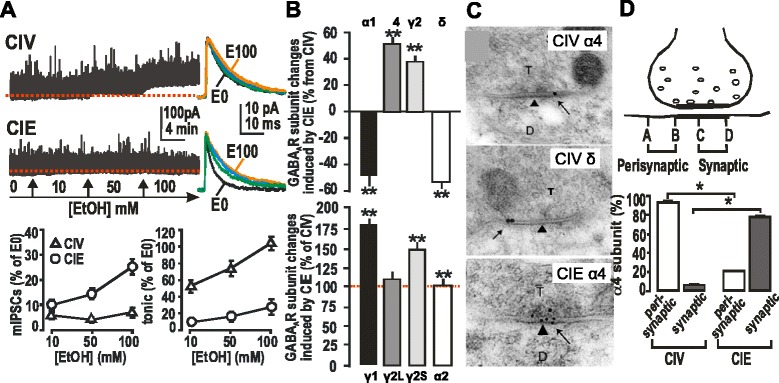
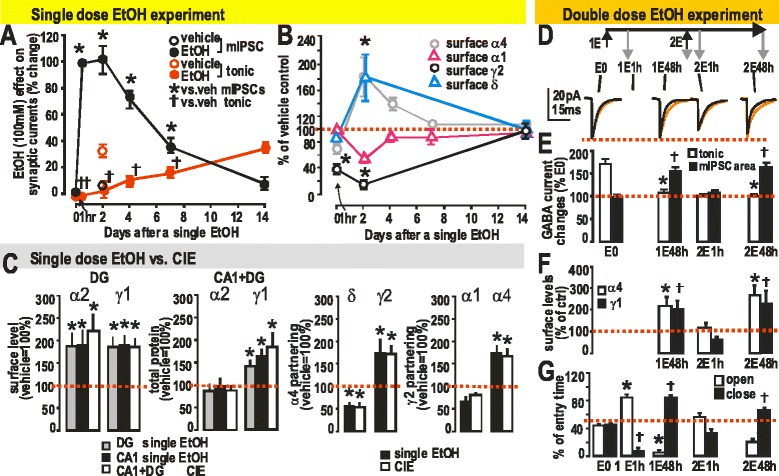
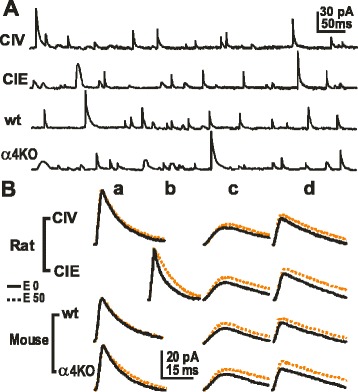
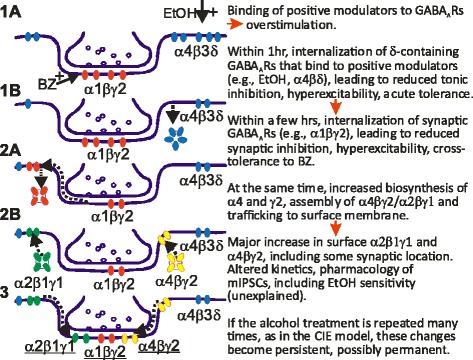
GABAergic inhibitory transmission is involved in the acute and chronic effects of ethanol on the brain and behavior. One-dose ethanol exposure induces transient plastic changes in GABAA receptor subunit levels, composition, and regional and subcellular localization. Rapid down-regulation of early responder δ subunit-containing GABAA receptor subtypes mediating ethanol-sensitive tonic inhibitory currents in critical neuronal circuits corresponds to rapid tolerance to ethanol's behavioral responses. Slightly slower, α1 subunit-containing GABAA receptor subtypes mediating ethanol-insensitive synaptic inhibition are down-regulated, corresponding to tolerance to additional ethanol behaviors plus cross-tolerance to other GABAergic drugs including benzodiazepines, anesthetics, and neurosteroids, especially sedative-hypnotic effects. Compensatory up-regulation of synaptically localized α4 and α2 subunit-containing GABAA receptor subtypes, mediating ethanol-sensitive synaptic inhibitory currents follow, but exhibit altered physio-pharmacology, seizure susceptibility, hyperexcitability, anxiety, and tolerance to GABAergic positive allosteric modulators, corresponding to heightened alcohol withdrawal syndrome. All these changes (behavioral, physiological, and biochemical) induced by ethanol administration are transient and return to normal in a few days. After chronic intermittent ethanol (CIE) treatment the same changes are observed but they become persistent after 30 or more doses, lasting for at least 120 days in the rat, and probably for life. We conclude that the ethanol-induced changes in GABAA receptors represent aberrant plasticity contributing critically to ethanol dependence and increased voluntary consumption. We suggest that the craving, drug-seeking, and increased consumption in the rat model are tied to ethanol-induced plastic changes in GABAA receptors, importantly the development of ethanol-sensitive synaptic GABAA receptor-mediating inhibitory currents that participate in maintained positive reward actions of ethanol on critical neuronal circuits. These probably disinhibit nerve endings of inhibitory GABAergic neurons on dopamine reward circuit cells, and limbic system circuits mediating anxiolysis in hippocampus and amygdala. We further suggest that the GABAA receptors contributing to alcohol dependence in the rat and presumably in human alcohol use disorders (AUD) are the ethanol-induced up-regulated subtypes containing α4 and most importantly α2 subunits. These mediate critical aspects of the positive reinforcement of ethanol in the dependent chronic user while alleviating heightened withdrawal symptoms experienced whenever ethanol is absent. The speculative conclusions based on firm observations are readily testable.
Keywords: Chronic intermittent ethanol; GABAA receptors; Inhibitory synaptic plasticity; Rodent model of alcoholism.
Conflict of interest statement
Ethics approval
Human research: not applicable.
Animal research: all data presented are published in peer-reviewed journals as cited, except those data presented in Fig. 6 (unpublished). The animals used in those experiments were cared for in the AAALAC-approved vivarium facilities at UCLA, and the research protocols approved (#1993–099-61, #2002–047-08, and #2015–083-01) by the UCLA campus IACUC, monitored by the UCLA Office of Animal Research Oversight.
Consent for publication
Not applicable.
Competing interests
The authors declare that they have no competing interests.
Publisher’s Note
Springer Nature remains neutral with regard to jurisdictional claims in published maps and institutional affiliations.
Figures
Similar articles
-
Altered pharmacology of synaptic and extrasynaptic GABAA receptors on CA1 hippocampal neurons is consistent with subunit changes in a model of alcohol withdrawal and dependence.J Pharmacol Exp Ther. 2004 Sep;310(3):1234-45. doi: 10.1124/jpet.104.067983. Epub 2004 May 4. J Pharmacol Exp Ther. 2004. PMID: 15126642
-
Withdrawal from chronic intermittent ethanol treatment changes subunit composition, reduces synaptic function, and decreases behavioral responses to positive allosteric modulators of GABAA receptors.Mol Pharmacol. 2003 Jan;63(1):53-64. doi: 10.1124/mol.63.1.53. Mol Pharmacol. 2003. PMID: 12488536
-
GABAA Receptor Plasticity in Alcohol Withdrawal.In: Noebels JL, Avoli M, Rogawski MA, Olsen RW, Delgado-Escueta AV, editors. Jasper's Basic Mechanisms of the Epilepsies [Internet]. 4th edition. Bethesda (MD): National Center for Biotechnology Information (US); 2012. In: Noebels JL, Avoli M, Rogawski MA, Olsen RW, Delgado-Escueta AV, editors. Jasper's Basic Mechanisms of the Epilepsies [Internet]. 4th edition. Bethesda (MD): National Center for Biotechnology Information (US); 2012. PMID: 22787640 Free Books & Documents. Review.
-
α2 Subunit-Containing GABAA Receptor Subtypes Are Upregulated and Contribute to Alcohol-Induced Functional Plasticity in the Rat Hippocampus.Mol Pharmacol. 2017 Aug;92(2):101-112. doi: 10.1124/mol.116.107797. Epub 2017 May 23. Mol Pharmacol. 2017. PMID: 28536106 Free PMC article.
-
GABAA receptors in the thalamus: alpha4 subunit expression and alcohol sensitivity.Alcohol. 2007 May;41(3):177-85. doi: 10.1016/j.alcohol.2007.03.010. Epub 2007 May 23. Alcohol. 2007. PMID: 17521848 Review.
Cited by
-
Review of Ethanol Intoxication Sensing Technologies and Techniques.Sensors (Basel). 2022 Sep 9;22(18):6819. doi: 10.3390/s22186819. Sensors (Basel). 2022. PMID: 36146167 Free PMC article. Review.
-
A Novel Sulfonamide, 4-FS, Reduces Ethanol Drinking and Physical Withdrawal Associated With Ethanol Dependence.Int J Mol Sci. 2020 Jun 21;21(12):4411. doi: 10.3390/ijms21124411. Int J Mol Sci. 2020. PMID: 32575871 Free PMC article.
-
Preventive Effects of Baclofen but Not Diazepam on Hippocampal Memory and Glucocorticoid Alterations After Prolonged Alcohol Withdrawal in Mice.Front Psychiatry. 2022 May 24;13:799225. doi: 10.3389/fpsyt.2022.799225. eCollection 2022. Front Psychiatry. 2022. PMID: 35686185 Free PMC article.
-
Imaging of Microtubules in a Nonhuman Primate Model of Alcohol Use Disorder.ACS Pharmacol Transl Sci. 2025 Apr 8;8(5):1313-1319. doi: 10.1021/acsptsci.4c00682. eCollection 2025 May 9. ACS Pharmacol Transl Sci. 2025. PMID: 40370993
-
Concomitant taurine exposure counteracts ethanol-induced changes in locomotor and anxiety-like responses in zebrafish.Psychopharmacology (Berl). 2020 Mar;237(3):735-743. doi: 10.1007/s00213-019-05410-0. Epub 2019 Nov 30. Psychopharmacology (Berl). 2020. PMID: 31786647 Free PMC article.
References
-
- NIH/NIAAA: National Institute on Alcohol Abuse and Alcoholism FIVE YEAR STRATEGIC PLAN 2006. FY07–11 https://www.pubsniaaanihgov/publications/StrategicPlan/ NIAAASTRATEGICPL....
-
- NIH/NIAAA: Alcohol use disorder: A comparison between DSM–IV and DSM–5. NIH Publication 2016 No 13–7999.
-
- WHO: Alcohol. Fact sheet Updated January 2015. http://www.whoint/mediacentre/factsheets /fs349/en/.
-
- MayoClinic: Alcohol use disorder. 2015 http://www.mayoclinicorg/diseases-conditions/alcohol-use-disorder/basics....
Publication types
MeSH terms
Substances
Grants and funding
LinkOut - more resources
Full Text Sources
Other Literature Sources
Medical
