

Development and validation of QMortality risk prediction algorithm to estimate short term risk of death and assess frailty: cohort study
- PMID: 28931509
- PMCID: PMC5606253
- DOI: 10.1136/bmj.j4208
Development and validation of QMortality risk prediction algorithm to estimate short term risk of death and assess frailty: cohort study
Abstract
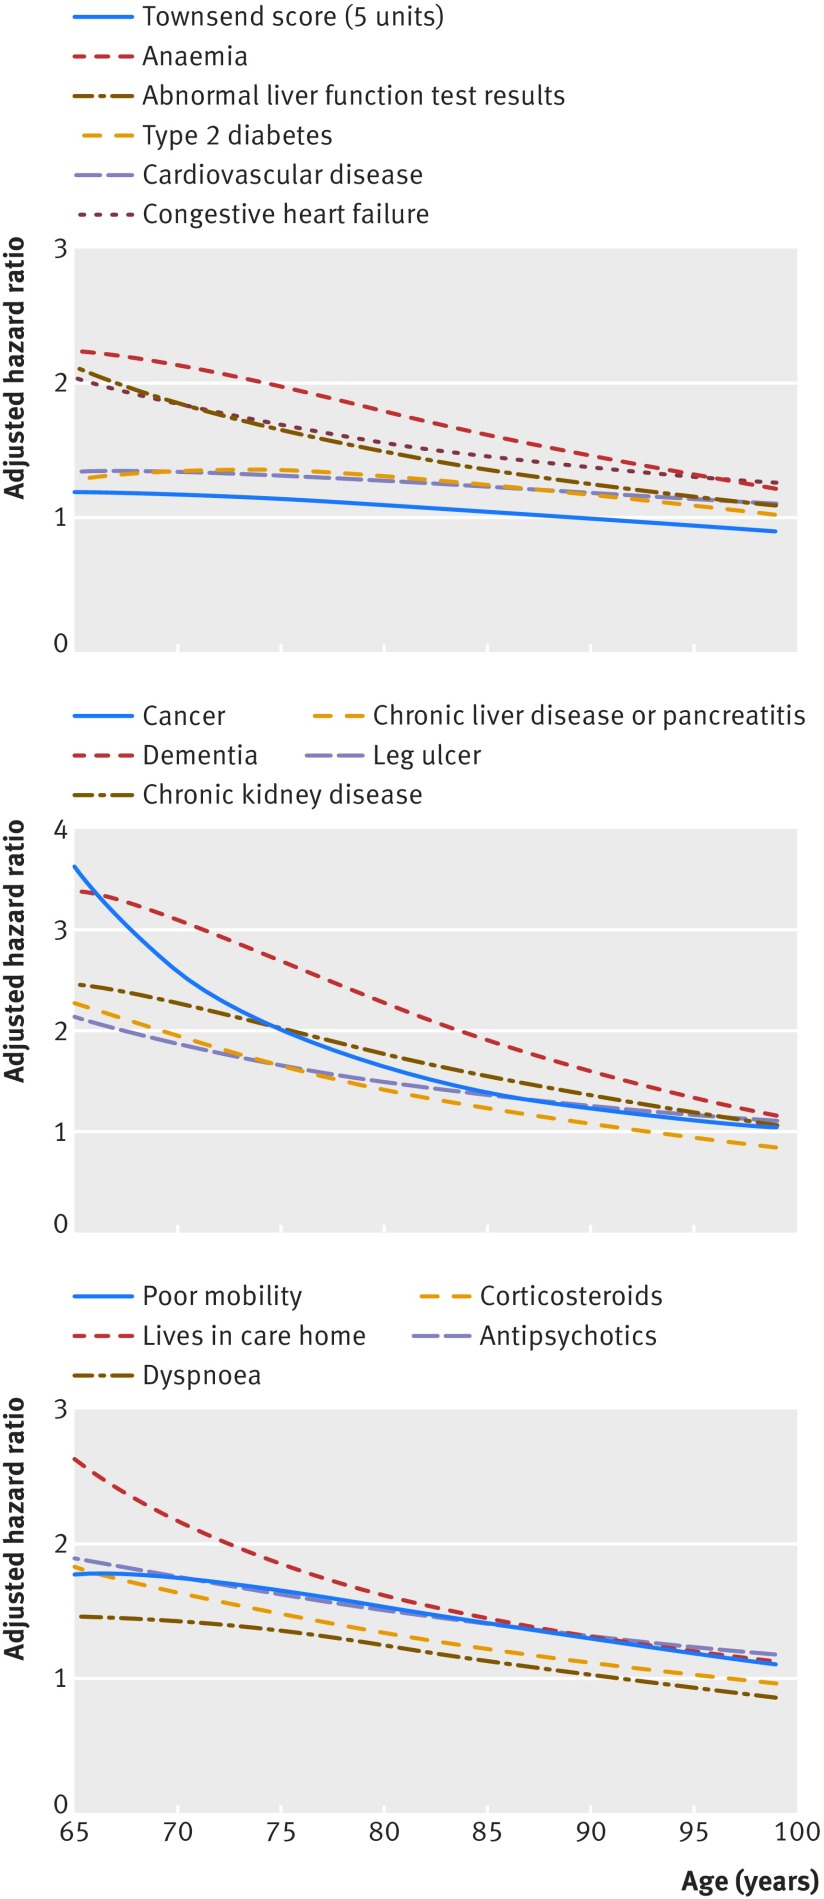
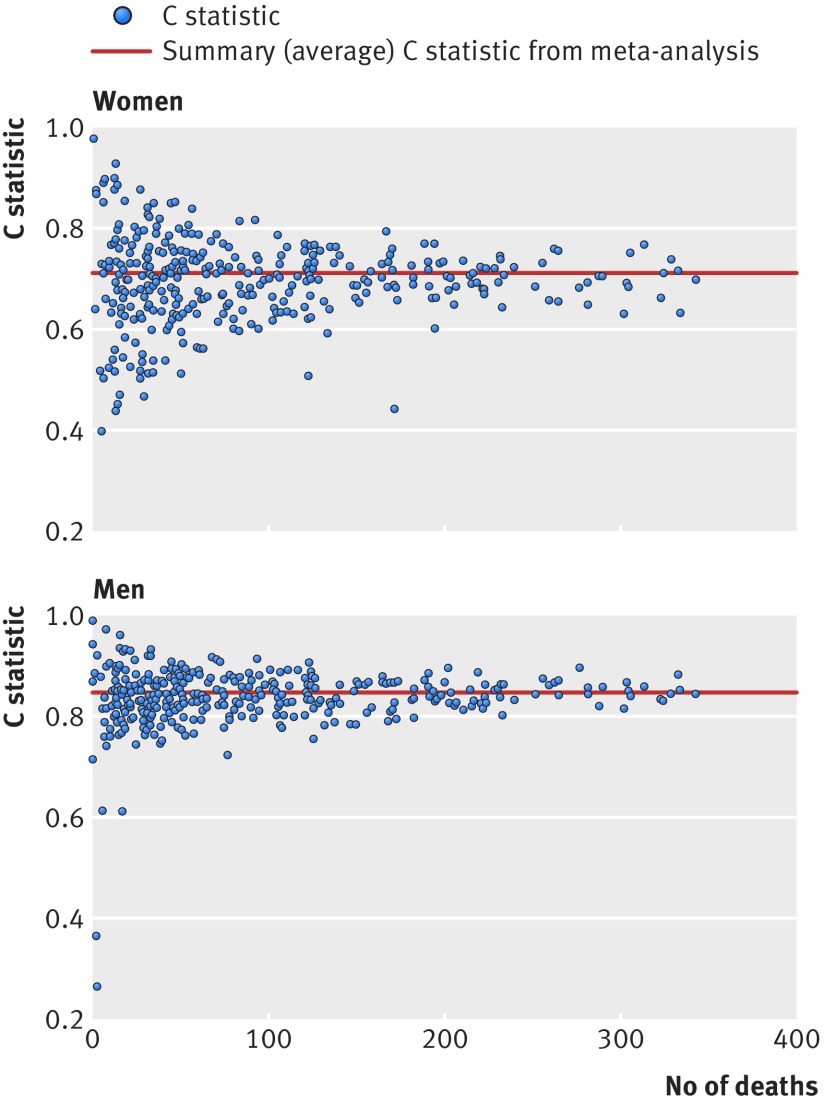
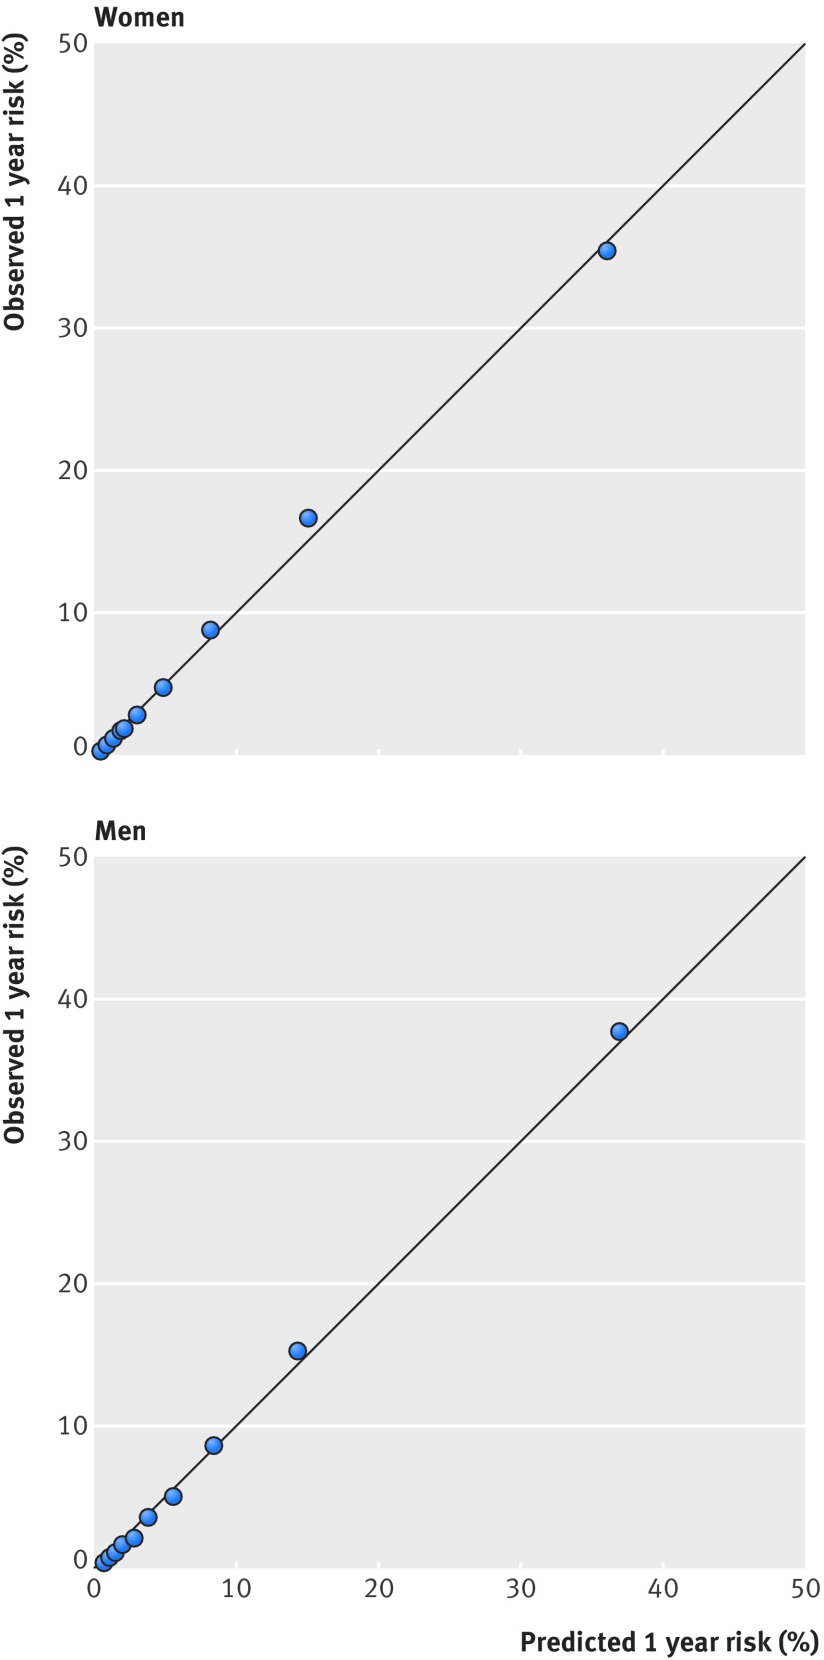
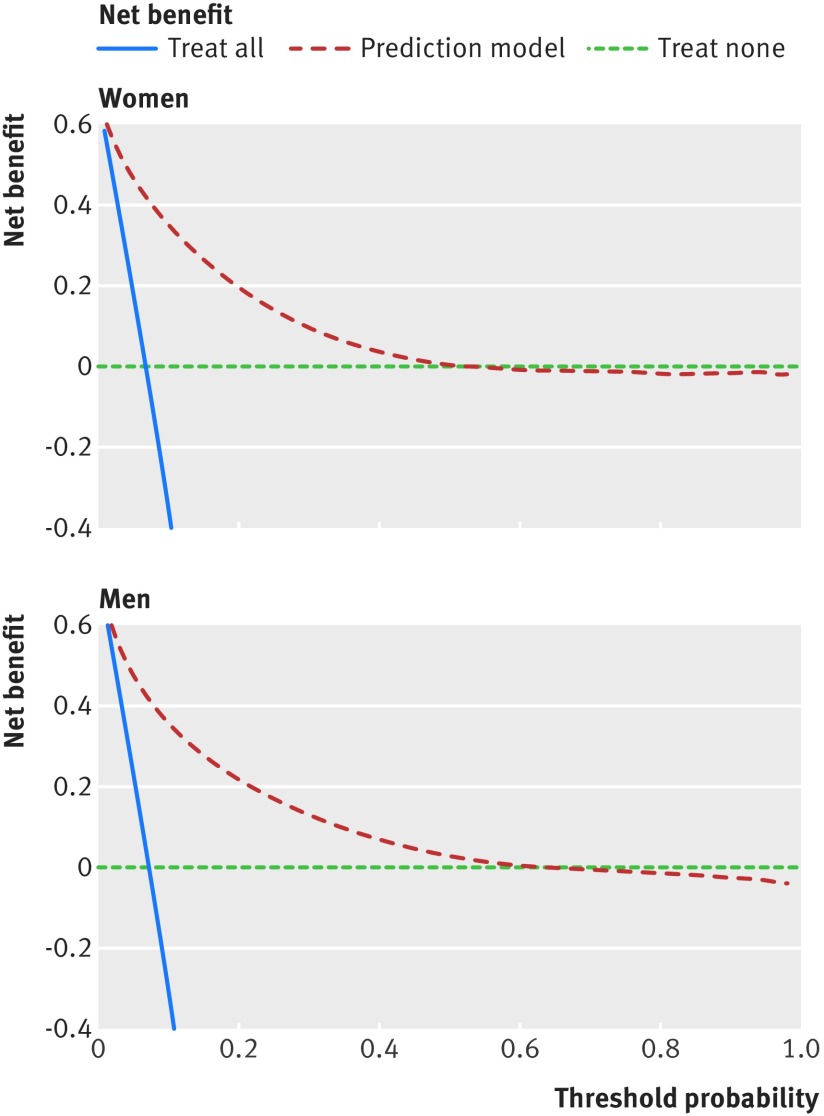
Objectives To derive and validate a risk prediction equation to estimate the short term risk of death, and to develop a classification method for frailty based on risk of death and risk of unplanned hospital admission.Design Prospective open cohort study.Participants Routinely collected data from 1436 general practices contributing data to QResearch in England between 2012 and 2016. 1079 practices were used to develop the scores and a separate set of 357 practices to validate the scores. 1.47 million patients aged 65-100 years were in the derivation cohort and 0.50 million patients in the validation cohort.Methods Cox proportional hazards models in the derivation cohort were used to derive separate risk equations in men and women for evaluation of the risk of death at one year. Risk factors considered were age, sex, ethnicity, deprivation, smoking status, alcohol intake, body mass index, medical conditions, specific drugs, social factors, and results of recent investigations. Measures of calibration and discrimination were determined in the validation cohort for men and women separately and for each age and ethnic group. The new mortality equation was used in conjunction with the existing QAdmissions equation (which predicts risk of unplanned hospital admission) to classify patients into frailty groups.Main outcome measure The primary outcome was all cause mortality.Results During follow-up 180 132 deaths were identified in the derivation cohort arising from 4.39 million person years of observation. The final model included terms for age, body mass index, Townsend score, ethnic group, smoking status, alcohol intake, unplanned hospital admissions in the past 12 months, atrial fibrillation, antipsychotics, cancer, asthma or chronic obstructive pulmonary disease, living in a care home, congestive heart failure, corticosteroids, cardiovascular disease, dementia, epilepsy, learning disability, leg ulcer, chronic liver disease or pancreatitis, Parkinson's disease, poor mobility, rheumatoid arthritis, chronic kidney disease, type 1 diabetes, type 2 diabetes, venous thromboembolism, anaemia, abnormal liver function test result, high platelet count, visited doctor in the past year with either appetite loss, unexpected weight loss, or breathlessness. The model had good calibration and high levels of explained variation and discrimination. In women, the equation explained 55.6% of the variation in time to death (R2), and had very good discrimination-the D statistic was 2.29, and Harrell's C statistic value was 0.85. The corresponding values for men were 53.1%, 2.18, and 0.84. By combining predicted risks of mortality and unplanned hospital admissions, 2.7% of patients (n=13 665) were classified as severely frail, 9.4% (n=46 770) as moderately frail, 43.1% (n=215 253) as mildly frail, and 44.8% (n=223 790) as fit.Conclusions We have developed new equations to predict the short term risk of death in men and women aged 65 or more, taking account of demographic, social, and clinical variables. The equations had good performance on a separate validation cohort. The QMortality equations can be used in conjunction with the QAdmissions equations, to classify patients into four frailty groups (known as QFrailty categories) to enable patients to be identified for further assessment or interventions.
Published by the BMJ Publishing Group Limited. For permission to use (where not already granted under a licence) please go to http://group.bmj.com/group/rights-licensing/permissions.
Conflict of interest statement
Competing interests: Both authors have completed the uniform disclosure form at www.icmje.org/coi_disclosure.pdf (available on request from the corresponding author) and declare: JHC is codirector of QResearch, a not-for-profit organisation, which is a joint partnership between the University of Nottingham and Egton Medical Information Systems (leading commercial supplier of IT for 55% of general practices in the UK). JHC is also a paid director of ClinRisk, which produces open and closed source software to ensure the reliable and updatable implementation of clinical risk equations within clinical computer systems to help improve patient care. CC is a paid consultant statistician for ClinRisk. This work and any views expressed within it are solely those of the authors and not of any affiliated bodies or organisations.
Figures

Comment in
-
Identifying frailty in primary care.BMJ. 2017 Sep 27;358:j4478. doi: 10.1136/bmj.j4478. BMJ. 2017. PMID: 28954723 No abstract available.
References
-
- Searle SD, Mitnitski A, Gahbauer EA, Gill TM, Rockwood K. A standard procedure for creating a frailty index. BMC Geriatr 2008;8:24 10.1186/1471-2318-8-24. pmid:18826625. - DOI - PMC - PubMed
-
- Clegg A, Bates C, Young J, et al. Development and validation of an electronic frailty index using routine primary care electronic health record data. Age Ageing 2016;45:353-60. 10.1093/ageing/afw039. pmid:26944937. - DOI - PMC - PubMed
-
- National Institute for Clinical Excellence. Multimorbidity: clinical assessment and management, NICE guidelines NG56. In: NICE, ed. London, 2016:443.
-
- Hippisley-Cox J, Coupland C. Predicting risk of emergency admission to hospital using primary care data: derivation and validation of QAdmissions score. BMJ Open 2013;3:e003482 10.1136/bmjopen-2013-003482. pmid:23959760. - DOI - PMC - PubMed
-
- Donnan PT, Dorward DWT, Mutch B, Morris AD. Development and validation of a model for predicting emergency admissions over the next year (PEONY): a UK historical cohort study. Arch Intern Med 2008;168:1416-22. 10.1001/archinte.168.13.1416. pmid:18625922. - DOI - PubMed
Publication types
MeSH terms
LinkOut - more resources
Full Text Sources
Other Literature Sources
Miscellaneous