. 2017 Dec 28;130(26):2872-2883.
doi: 10.1182/blood-2017-02-768176. Epub 2017 Sep 20.

Cellubrevin/vesicle-associated membrane protein-3-mediated endocytosis and trafficking regulate platelet functions

Affiliations

Cellubrevin/vesicle-associated membrane protein-3-mediated endocytosis and trafficking regulate platelet functions

Meenakshi Banerjee et al. Blood. .

Abstract

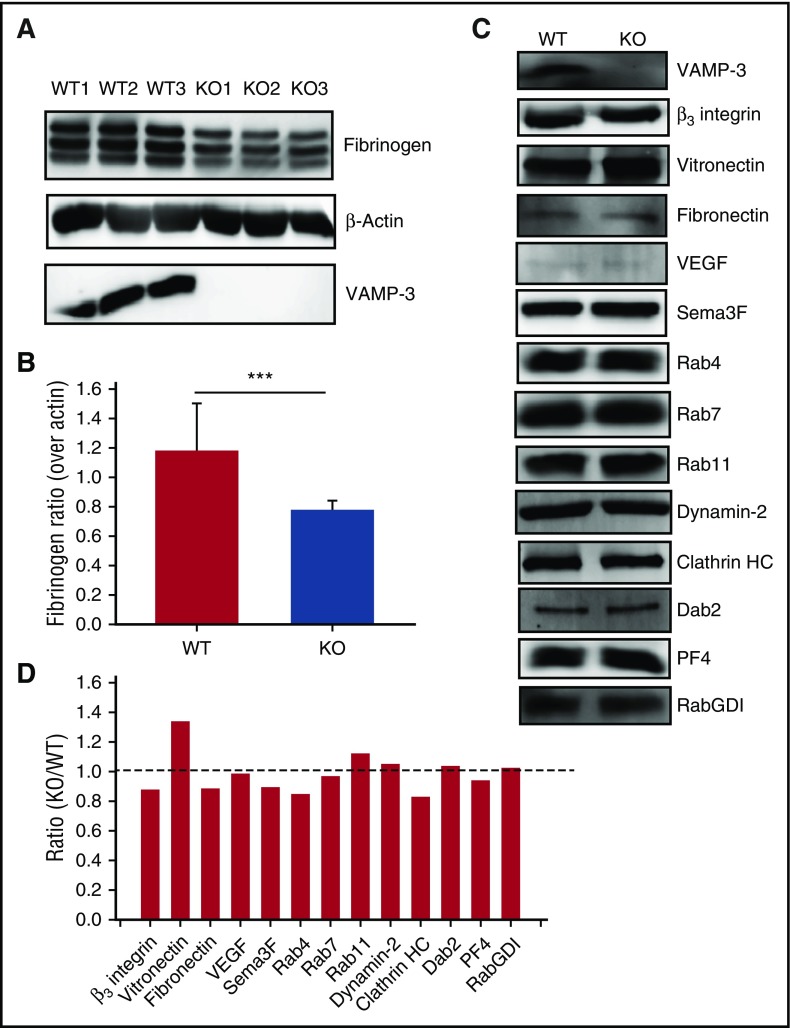
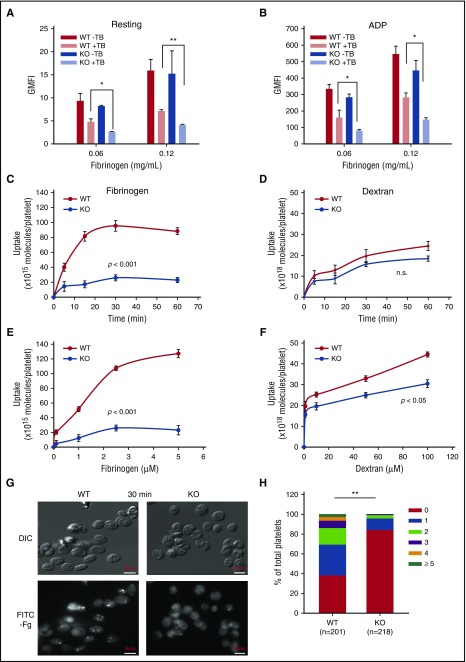
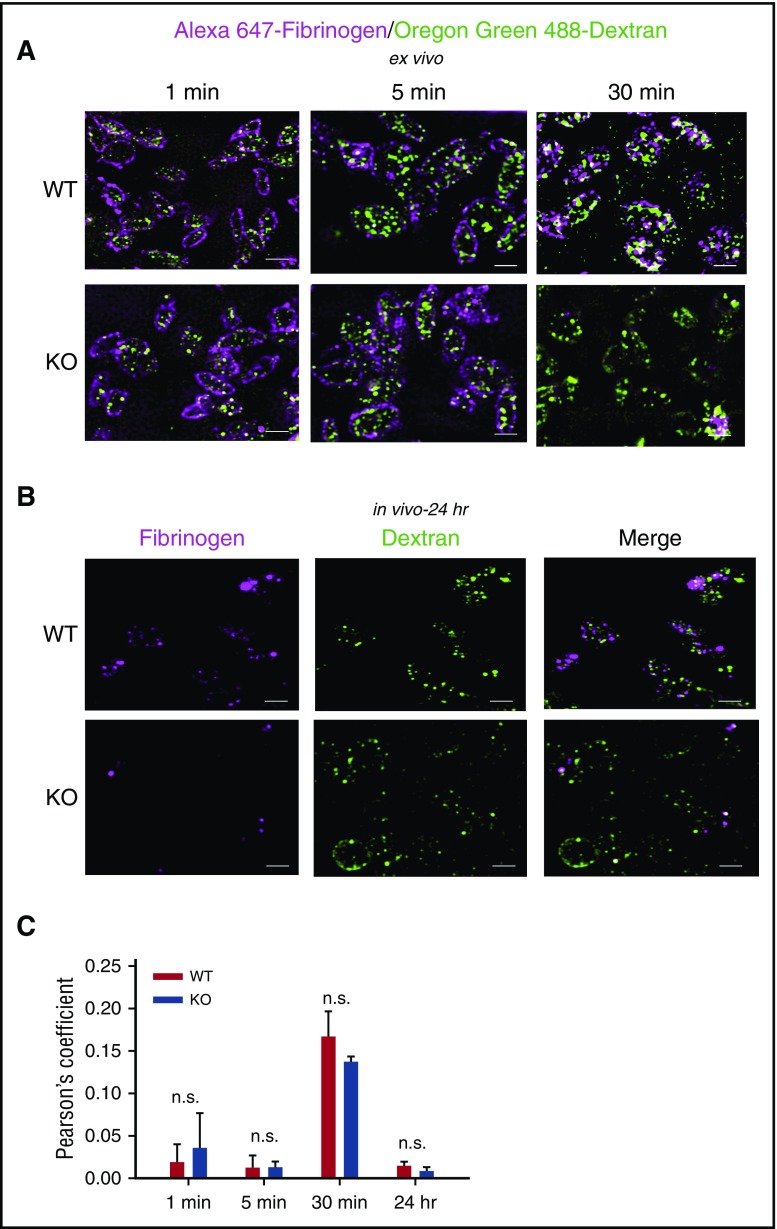
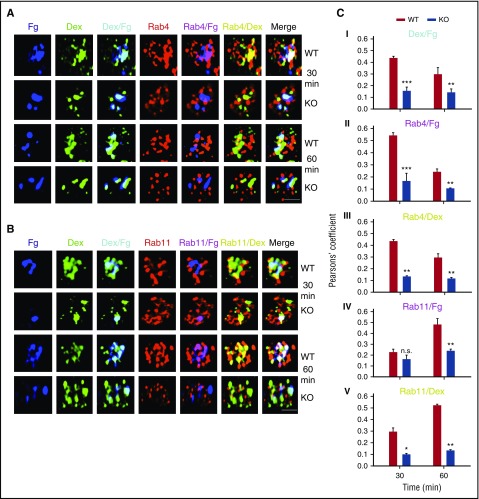
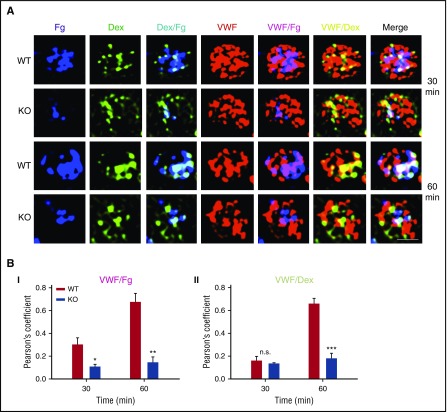
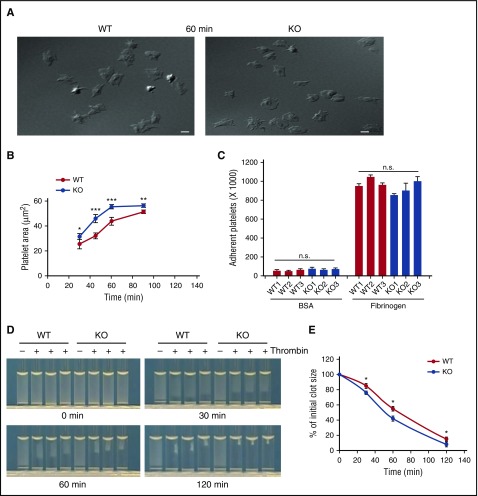
Endocytosis is key to fibrinogen (Fg) uptake, trafficking of integrins (αIIbβ3, αvβ3), and purinergic receptors (P2Y1, P2Y12), and thus normal platelet function. However, the molecular machinery required and possible trafficking routes are still ill-defined. To further identify elements of the platelet endocytic machinery, we examined the role of a vesicle-residing, soluble N-ethylmaleimide factor attachment protein receptor (v-SNARE) called cellubrevin/vesicle-associated membrane protein-3 (VAMP-3) in platelet function. Although not required for normal platelet exocytosis or hemostasis, VAMP-3-/- mice had less platelet-associated Fg, indicating a defect in Fg uptake/storage. Other granule markers were unaffected. Direct experiments, both in vitro and in vivo, showed that loss of VAMP-3 led to a robust defect in uptake/storage of Fg in platelets and cultured megakaryocytes. Uptake of the fluid-phase marker, dextran, was only modestly affected. Time-dependent uptake and endocytic trafficking of Fg and dextran were followed using 3-dimensional-structured illumination microscopy. Dextran uptake was rapid compared with Fg, but both cargoes progressed through Rab4+, Rab11+, and von Willebrand factor (VWF)+ compartments in wild-type platelets in a time-dependent manner. In VAMP-3-/- platelets, the 2 cargoes showed limited colocalization with Rab4, Rab11, or VWF. Loss of VAMP-3 also affected some acute platelet functions, causing enhanced spreading on Fg and fibronectin and faster clot retraction compared with wild-type. In addition, the rate of Janus kinase 2 phosphorylation, initiated through the thrombopoietin receptor (TPOR/Mpl) activation, was affected in VAMP-3-/- platelets. Collectively, our studies show that platelets are capable of a range of endocytosis steps, with VAMP-3 being pivotal in these processes.


Conflict of interest statement

Conflict-of-interest disclosure: The authors declare no competing financial interests.

Figures

Figure 1.
Figure 1.
VAMP-3−/−platelets had lower fibrinogen levels. (A) Fg levels in washed platelet extracts from WT and VAMP-3−/− mice (3 each) were measured by western blotting. β-actin was used as loading control. (B) Quantification of Fg levels in panel A was performed using ImageQuantTL and plotted with SigmaPLot software (v13.0). (C) Comparison of protein levels by western blotting between WT and VAMP-3−/− platelets. Washed platelet extracts (5 × 10⁷ platelets/lane) were loaded, and the indicated proteins were probed by western blotting. (D) Quantification of protein levels was performed using ImageQuantTL, and data were plotted as the ratio of VAMP-3−/− over WT. The dashed line represents the ratio 1 of KO/WT protein levels. Statistical analyses were done using Student t test; ***P ≤ .001. Data for panels C and D are representative of platelets pooled from 2 to 3 mice in at least 2 independent experiments.
Figure 2.
Figure 2.
VAMP-3−/−platelets had defective fibrinogen uptake. WT and VAMP-3−/− platelets (1.0 × 10⁹/mL) were kept resting (A) or stimulated with ADP (10µM) (B), then incubated with FITC-Fg (0.06 or 0.12 mg/mL) at 37°C for 30 minutes. The platelets were then put on ice for 20 minutes and fixed with 2% PFA (final concentration), and geometric mean fluorescent intensity measurements were taken by flow cytometry before and after the addition of 0.04% TB. Quantification of data shows both geometric mean fluorescence intensity measurements before addition of TB (WT/ VAMP-3−/−–TB; dark bars), which gives the total fluorescence, and after addition of TB (WT/ VAMP-3−/−+ TB; light bars), which gives the measure of internal fluorescence. As explained in Methods, WT and VAMP-3−/− platelets were added to each well in an opaque 96-well plate and either incubated with FITC-Fg (2 µM) (C) or low-molecular-weight (10 kDa) Oregon Green 488-Dextran (2 µM) (D) for times from 0 to 60 minutes at 37°C. Similarly, WT and VAMP-3−/− platelets were incubated with either FITC-Fg (0.1-5 µM) (E) or low-molecular-weight (10 kDa) Oregon Green 488-Dextran (1-100 µM) (F) for 30 minutes at 37°C. Reactions were stopped at given points, and fluorescence was measured before and after the addition of 0.04% TB. Data were plotted using SigmaPlot software (v13.0) and graphed as numbers of molecules of Fg or dextran endocytosed per platelet. No ADP was added to the plate assays. Statistical analyses were performed using 1-way ANOVA test; *P ≤ 0.05; **P ≤ 0.01; ***P ≤ .001; n.s., not significant. (G) Washed WT and VAMP-3−/− platelets (1 × 10⁹/mL) were incubated with FITC-Fg at final concentrations of 1 µM at 37°C for increasing times up to 30 minutes. Platelets were fixed with 2% PFA (final concentration) and mixed with 0.1% TB before imaging. Platelets were visualized as described in the supplemental Methods. Exposure times for DIC were 100 ms, whereas for the FITC, laser were 500 ms. Scale bars, 5 µM. (H) Quantification of the number of FITC+ puncta/platelet in both WT and VAMP-3−/− samples were plotted using SigmaPlot software (v13.0). Statistical significance determined using Mann-Whitney U test; **P ≤ .01. Data are representative of 3 independent experiments (mean ± standard error of the mean [SEM]) for all.
Figure 3.
Figure 3.
Receptor-mediated and fluid-phase cargoes took different endocytic routes in platelets. (A) Washed WT and VAMP-3−/− platelets (1.0 × 10⁹/mL) were incubated ex vivo with Alexa 647-Fg and Oregon Green 488-Dextran at final concentrations of 1 µM each and incubated at 37°C for 1 to 30 minutes and prepared for 3D-structured illumination microscopy imaging as described in Methods. (B) WT and VAMP-3−/ mice were injected with Alexa 647-Fg and Oregon Green 488-Dextran at a concentration of 2 µM each per fluorophore through the retroorbital sinus. Twenty-four hours postinjection, platelets were harvested and prepared for 3D-structured illumination microscopy imaging. Slides from panels A and B were then imaged using the Nikon Ti-E N-STORM/N-SIM super-resolution microscope, and images were processed using the NIS-Elements v3.2 N-SIM/STORM suite software. Scale bars, 5 µm. Data are representative of at least 2 independent experiments. (C) Pearson’s correlation coefficients were calculated using the NIS-Elements v3.2 N-SIM/STORM suite software to show overlap between Alexa 647-Fg and Oregon Green 488-Dextran (depicted in white) at the indicated points. Graph shows the mean ± SEM of 2 independent experiments, with at least 30 cells per field, taken over 3 to 4 fields per time. Statistical analyses were performed using Student t test; n.s., not significant.
Figure 4.
Figure 4.
Loss of VAMP-3 affected transit of cargoes to endosomes. Washed platelets (1 × 10⁹/mL) were incubated with Alexa 647-Fg and Oregon Green 488-Dextran at final concentrations of 1 µM each and incubated at 37°C for 30 to 60 minutes and prepared for immunofluorescence microscopy, as described in Methods. Platelets were incubated with anti-Rab4 rabbit polyclonal antibody (1:250 dilution) and anti-Rab11 rabbit polyclonal antibody (1:250 dilution), and then with Alexa 568-conjugated goat anti-rabbit IgG secondary antibody (1:1,000 dilution). Images were taken using the Nikon Ti-E N-STORM/N-SIM super-resolution microscope and digitally magnified by ×30. The Alexa 647-Fg signal was faux-colored blue to aid in identifying overlaps. Scale bars, 1 µm. Data are representative of 2 independent experiments. (C) Pearson’s correlation coefficients were calculated using the NIS-Elements v3.2 N-SIM/STORM suite software to show overlap among (i) Alexa 647-Fg and Oregon Green 488-Dextran (depicted in cyan), (ii) Alexa 568-Rab4 and Alexa 647-Fg (depicted in magenta), (iii) Alexa 568-Rab4 and Oregon Green 488-Dextran (depicted in yellow), (iv) Alexa 568-Rab11 and Alexa 647-Fg (depicted in magenta), and (v) Alexa 568-Rab11 and Oregon Green 488-Dextran (depicted in yellow), at the indicated times. Overlap of all 3 fluorophores is depicted in white in the merge panel. Graph shows the mean ± SEM of 2 independent experiments, with at least 30 cells per field, taken over 3 to 4 fields per time. Statistical analyses were performed using Student t test; *P ≤ .05; **P ≤ .01; ***P ≤ .001; n.s., not significant.
Figure 5.
Figure 5.
Loss of VAMP-3 affected transit of cargoes to α-granules. (A) Washed platelets (1 × 10⁹/mL) were incubated with Alexa 647-Fg and Oregon green 488-Dextran at final concentrations of 1 µM each and incubated at 37°C for 30 to 60 minutes and prepared for immunofluorescence microscopy, as described in Methods. Platelets were incubated with anti-VWF rabbit polyclonal antibody (1:500 dilution) and then with Alexa 568-conjugated goat anti-rabbit immunoglobulin G secondary antibody (1:1,000 dilution). Images were taken using the Nikon Ti-E N-STORM/N-SIM super-resolution microscope, and digitally magnified by ×30. The Alexa 647-Fg signal was faux colored blue to aid in identifying overlaps. Scale bar, 1 µm. Data are representative of 2 independent experiments. (B) Pearson’s correlation coefficients were calculated using the NIS-Elements v3.2 N-SIM/STORM suite software to show overlap between (i) Alexa 568-VWF and Alexa 647-Fg (depicted in magenta) and (ii) Alexa 568-VWF and Oregon Green 488-Dextran (depicted in yellow) at the indicated times. Overlap of all 3 fluorophores is depicted in white in the merge panel. Graph shows the mean ± SEM of 2 independent experiments, with at least 30 cells per field, taken over 3 to 4 fields per time. Statistical analyses were performed using Student t test; *P ≤ .05; **P ≤ .01; ***P ≤ .001; n.s., not significant.
Figure 6.
Figure 6.
VAMP-3−/−platelets spread faster on Fg and had enhanced clot retraction. (A) Representative images of WT and VAMP-3−/− platelets allowed to spread on fibrinogen (50 µg/mL in 1× PBS) for 60 minutes are shown. Images of spread platelets were taken using DIC microscopy as described in supplemental Methods. Exposure times for DIC images were 100 ms. Scale bars, 5 μm. (B) Quantification of platelet surface area from WT and VAMP-3−/− Fg-spread platelets for indicated times. Data are representative of 2 independent experiments (mean ± SEM). (C) Quantification of static adhesion on 50 μg/mL human Fg and 5% bovine serum albumin-coated surfaces for WT and VAMP-3−/− calcein-labeled platelets harvested from 3 different VAMP-3−/− and WT mice. Adherent platelets were measured by fluorescence, using a SpectraMax plate reader. Data were plotted using SigmaPlot software (v13.0). (D) Representative images of thrombin-stimulated (0.05 U/mL; denoted by +) clot retraction in WT and VAMP-3−/− platelets at increasing times. (E) Clot sizes were measured, and the percentages of clot size relative to initial suspension volume (measured at time 0 and set as 100%) were determined and plotted. Three different VAMP-3−/− and corresponding WT littermate controls were used in this experiment. Statistical analyses were performed using the Student t test; *P ≤ .05; **P ≤ .01; ***P ≤ .001; n.s., not significant.

Comment in

Similar articles

Cited by

References

    1. Joshi S, Whiteheart SW. The nuts and bolts of the platelet release reaction. Platelets. 2017;28(2):129-137. - PMC - PubMed
    1. Zucker-Franklin D. Endocytosis by human platelets: metabolic and freeze-fracture studies. J Cell Biol. 1981;91(3 Pt 1):706-715. - PMC - PubMed
    1. Harrison P, Wilbourn B, Debili N, et al. . Uptake of plasma fibrinogen into the alpha granules of human megakaryocytes and platelets. J Clin Invest. 1989;84(4):1320-1324. - PMC - PubMed
    1. Klement GL, Yip TT, Cassiola F, et al. . Platelets actively sequester angiogenesis regulators. Blood. 2009;113(12):2835-2842. - PMC - PubMed
    1. Banerjee M, Whiteheart SW. The ins and outs of endocytic trafficking in platelet functions. Curr Opin Hematol. 2017;24(5):467-474. - PMC - PubMed

Publication types