. 2017 Nov 6;216(11):3509-3520.
doi: 10.1083/jcb.201702033. Epub 2017 Sep 20.

Cancer-associated fibroblasts lead tumor invasion through integrin-β3-dependent fibronectin assembly

Affiliations

Cancer-associated fibroblasts lead tumor invasion through integrin-β3-dependent fibronectin assembly

Youmna Attieh et al. J Cell Biol. .

Abstract

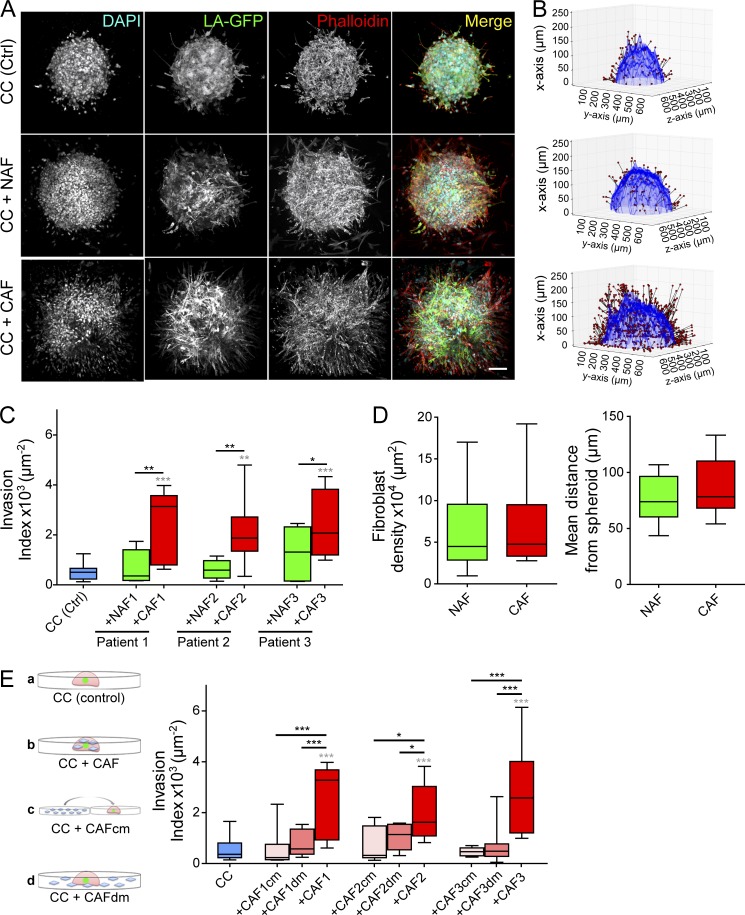
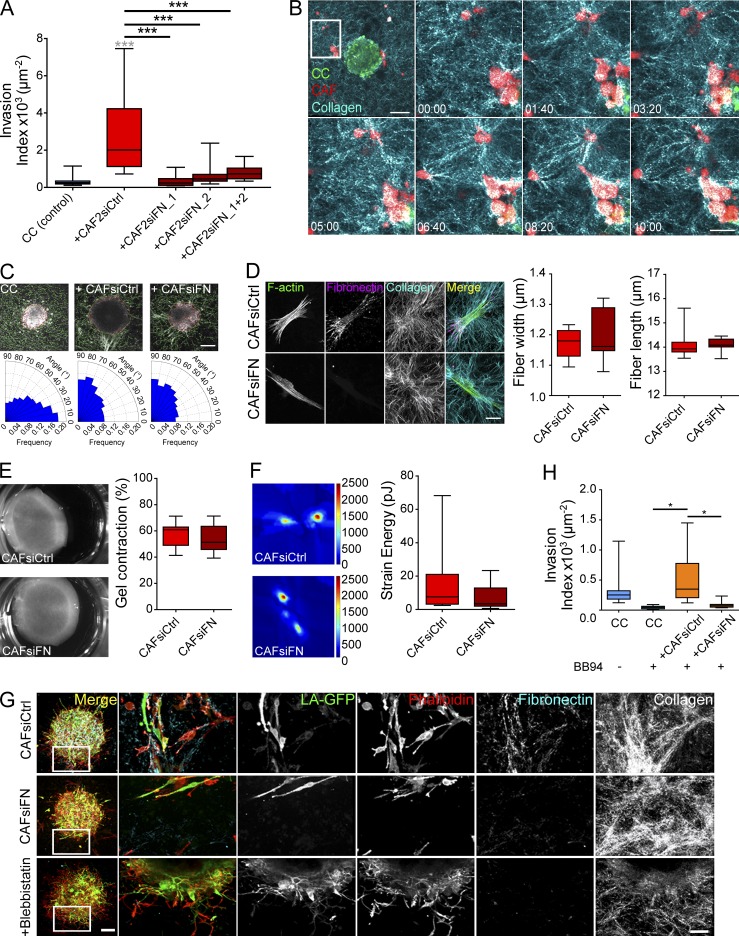
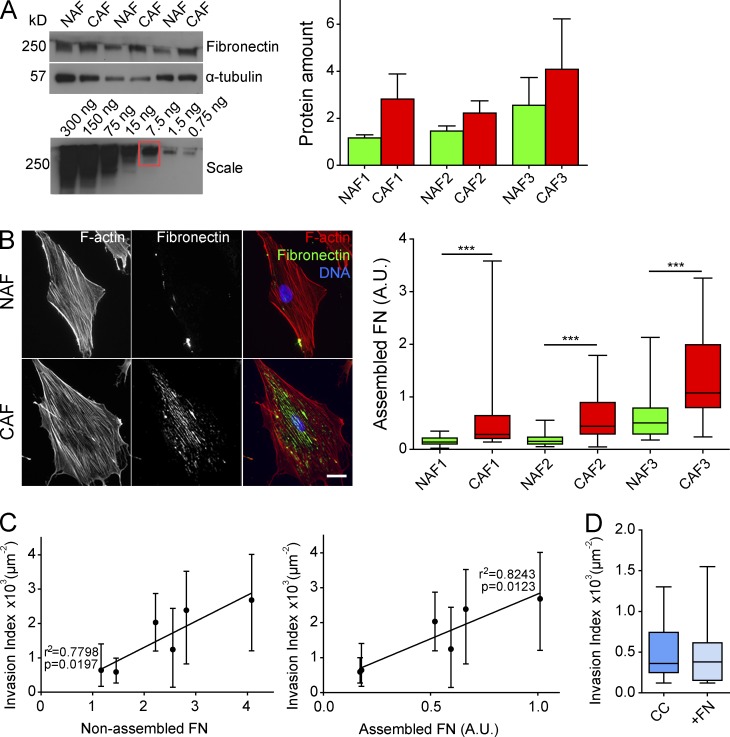
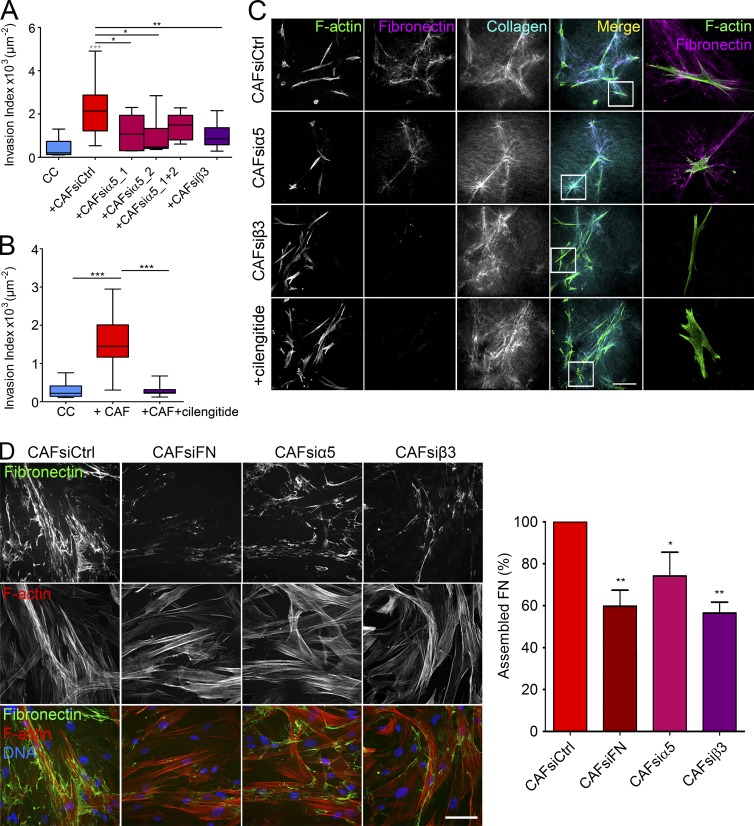
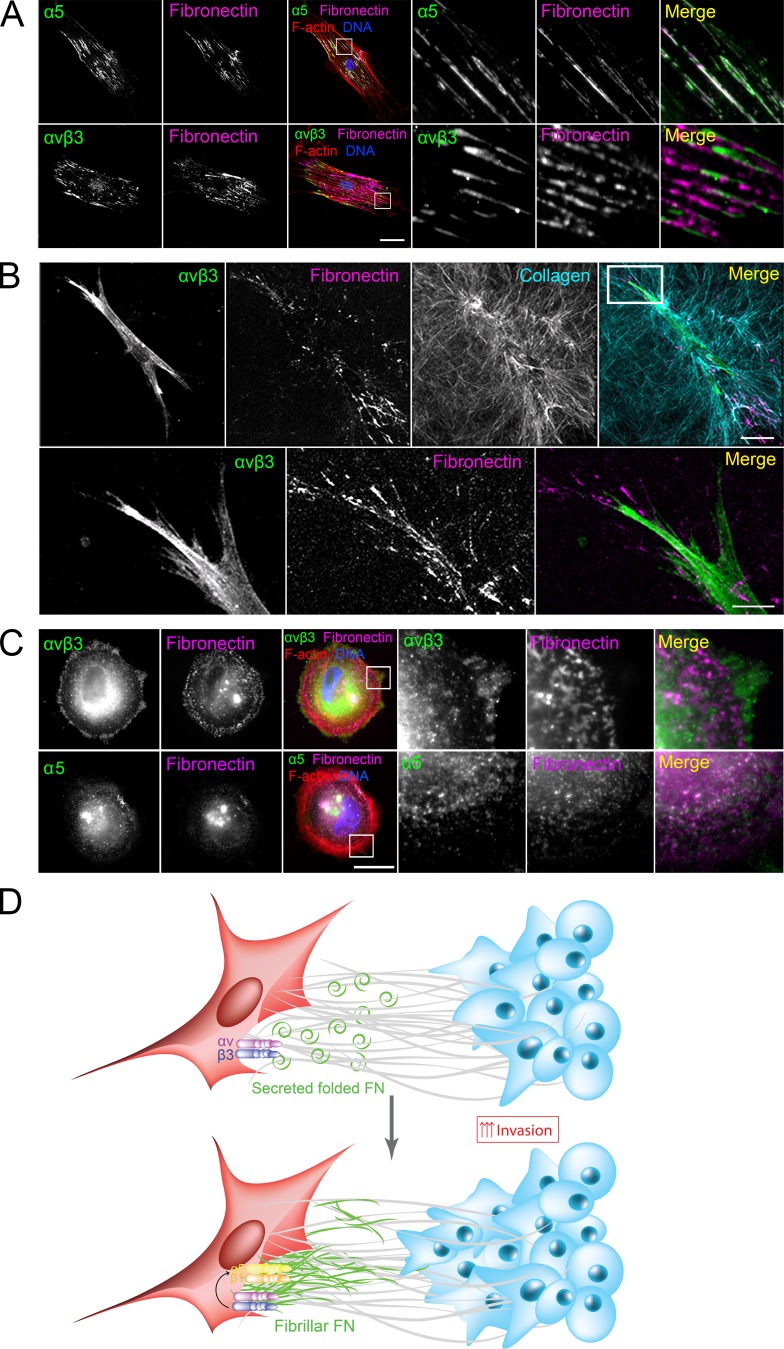
Cancer-associated fibroblasts (CAFs) are the most abundant cells of the tumor stroma. Their capacity to contract the matrix and induce invasion of cancer cells has been well documented. However, it is not clear whether CAFs remodel the matrix by other means, such as degradation, matrix deposition, or stiffening. We now show that CAFs assemble fibronectin (FN) and trigger invasion mainly via integrin-αvβ3. In the absence of FN, contractility of the matrix by CAFs is preserved, but their ability to induce invasion is abrogated. When degradation is impaired, CAFs retain the capacity to induce invasion in an FN-dependent manner. The level of expression of integrins αv and β3 and the amount of assembled FN are directly proportional to the invasion induced by fibroblast populations. Our results highlight FN assembly and integrin-αvβ3 expression as new hallmarks of CAFs that promote tumor invasion.


Figures

Figure 1.
Figure 1.
CAFs induce invasion of cancer cells through matrix remodeling. (A) Maximum intensity projections of cancer cell spheroids in collagen I, with or without fibroblasts, at day 3. CT26 cancer cells express LifeAct-GFP (green); F-actin (red) and DNA (cyan) were stained with phalloidin-rhodamine and DAPI, respectively. Bar, 100 µm. (B) 3D rendering of spheroids at day 3. Invasion is quantified using the invasion counter software. Red dots represent nuclei of invading GFP cancer cells (migrated out of the spheroid). (C) Quantification of cancer cell invasion alone (blue box) and in the presence of NAFs (green boxes) or CAFs (red boxes) for three different patients. P-values are compared with cancer cells alone (in gray) and to cancer cells with CAFs (in black) using Newman-Keuls multiple comparisons test (*, P < 0.05; **, P < 0.01; ***, P < 0.001). (D, left) Quantification of the density of NAFs and CAFs from all three patients around the spheroid. Fibroblast density is defined as the number of nuclei of non-GFP cells normalized to the surface area of the spheroid contour in 3D. P-value is calculated using Mann–Whitney test. (Right) Quantification of the mean distance of NAFs and CAFs from the spheroid. The mean distance from the spheroid was defined as the distance from the nuclei of non-GFP cells to the closest point along the cancer cell spheroid contour. P-value is calculated using Mann–Whitney test. (E, left) Schematic representation of the experiment. Cancer cells were embedded in collagen gels (a). CAFs were either mixed with cancer cells in the collagen droplet (b), their conditioned media was added to cancer cells (c), or they were plated around the collagen droplet (d). (Right) Quantification of cancer cell invasion alone, in the presence of CAFcm or CAFdm, or in the presence of CAFs for three different patients. Invasion index is defined as the ratio between the number of invading nuclei of GFP cancer cells and the area of the spheroid contour. Quantification results are expressed as box and whiskers (minimum to maximum) of at least n = 3 separate experiments. P-values are compared with cancer cells alone (in gray) and to cancer cells with CAFs (in black) using Newman-Keuls multiple comparisons test (*, P < 0.05; **, P < 0.01; ***, P < 0.001). CC, cancer cells.
Figure 2.
Figure 2.
CAFs deposit FN to induce cancer cell invasion. (A) Quantification of cancer cell invasion alone or in the presence of CAFs from patient 2, depleted or not for FN. P-values are compared with cancer cells alone (in gray) and to cancer cells with CAFs (in black) using Newman-Keuls multiple comparisons test (***, P < 0.001). (B) Time-lapse sequence of CT26 cancer cells and CAFs from patient 1 in collagen. CT26 cancer cells express LifeAct-GFP (green), CAFs are stained with a lyophilic carbocyanine dye (red), and collagen is acquired by reflection (blue). Time is in hours and minutes (HH:mm). Bar, 200 µm. The magnified region is represented by the white square. Bar, 100 µm. (C, top) Overlaid images of collagen I matrices containing cancer cell spheroids alone or together with control or FN-depleted CAFs from patient 1 generated using CurveAlign. The yellow line indicates the edge of the spheroid, and the green lines indicate fiber orientation with respect to the closest point on the spheroid edge. Bar, 100 µm. (Bottom) Rose plots representing the frequency of distribution of the absolute angles of collagen fibers within the range of 0–90° with respect to the closest point on the spheroid edge. (D, left) Maximum intensity projections of CAFs from patient 1 treated with siRNA scrambled control (CAFsiCtrl) or with siRNA targeting FN (CAFsiFN). F-actin is stained with phalloidin-rhodamine (green), FN is immunostained (magenta), and collagen is acquired using second harmonic generation (cyan). Bar, 20 µm. (Right) Quantification of collagen fiber width and length using CT-FIRE. P-value is calculated using Mann–Whitney test for at least n = 3 stacks over n = 2 separate experiments. (E, left) Control and FN-depleted CAFs from patient 1 cultured in collagen I gels 1 d after embedding. (Right) Percentage of gel contraction of control and FN-depleted CAFs from patient 1 calculated using the formula 100×[gel area (T0)gel area(T1)]/gel area (T0). P-value is calculated using Mann–Whitney test for n = 3 over n = 6 separate experiments. (F, left) Traction force map of control and FN-depleted CAFs from patient 1 on collagen-coated polyacrylamide gels with Young’s modulus of 5 kPa. Color code gives the magnitude of traction stress in Pa, which corresponds to forces of piconewton/squared micrometers. (Right) Corresponding mean force (strain energy) exerted by CAFs over a 30-min time lapse. P-value is calculated using Mann–Whitney test for n = 10 cells over n = 2 separate experiments. (G) Maximum intensity projections of cancer cell spheroids in collagen I gels with CAFs from patient 1 treated with siRNA scrambled control, siRNA against FN, or blebbistatin at day 3. Bar, 100 µm. Magnified regions are represented by the white squares. CT26 cancer cells express LifeAct-GFP (green), F-actin is stained with phalloidin-rhodamine (red), FN is immunostained (cyan), and collagen is acquired using reflection (white). Bar, 50 µm. (H) Quantification of cancer cell invasion alone or in the presence of control or FN-depleted CAFs treated with BB94 from patient 3. Invasion index is defined as the ratio between the number of invading nuclei of GFP cancer cells and the area of the spheroid contour. All quantification results are expressed as box and whiskers (minimum to maximum) of at least n = 3 separate experiments. P-values are compared with cancer cells alone (in gray) and to cancer cells with CAFs (in black) using Newman-Keuls multiple comparisons test (*, P < 0.05; **, P < 0.01; ***, P < 0.001).
Figure 3.
Figure 3.
CAFs secrete and assemble more FN than NAFs. (A) Immunoblot analysis. Conditioned media prepared from NAFs and CAFs from three patients were probed with FN antibody. α-Tubulin served as a loading control. Protein amount is represented by normalizing to α-tubulin. Results are represented as column bars for n = 3 separate experiments. For the FN scale: soluble FN loaded at a range of 300 to 0.75 ng. (B, left) Immunostaining of FN (green) in NAFs and CAFs from three patients. F-actin is stained with phalloidin-rhodamine (red), and DNA was stained with DAPI (blue). Bar, 20 µm. (Right) Quantification of assembled FN. Amount of assembled FN is defined as the amount of fluorescence in a cell (integrated density) normalized to the area of the cell and the background fluorescence. P-value is calculated using Mann–Whitney test for n = 20 cells over n = 2 separate experiments. (C) Scatter dot graphs correlating the invasion index of cancer cells in the presence of fibroblasts from all three patients with the amount of secreted (left) and assembled FN (right) by fibroblasts. Quality of linear regression is represented by the values of p and r2. (D) Quantification of cancer cell invasion in a collagen matrix or in a collagen and FN matrix. Invasion index is defined as the ratio between the number of invading nuclei of GFP cancer cells and the area of the spheroid contour. Quantification results are expressed as box and whiskers (minimum to maximum) for at least n = 3 separate experiments. ***, P < 0.001. A.U., arbitrary units.
Figure 4.
Figure 4.
Integrin-αvβ3 is necessary for FN assembly. (A) Quantification of cancer cell invasion alone or in the presence of control CAFs, α5-depleted CAFs, and β3-depleted CAFs from patient 3. (B) Quantification of cancer cell invasion in the presence of CAFs from patient 2, with or without cilengitide treatment. (A and B) Invasion index is defined as the ratio between the number of invading nuclei of GFP cancer cells and the area of the spheroid contour. All quantification results are expressed as box and whiskers (minimum to maximum) of at least n = 3 separate experiments. P-values are compared with cancer cells alone (in gray) and to cancer cells with CAFs (in black) using Newman-Keuls multiple comparisons test (*, P < 0.05; **, P < 0.01; ***, P < 0.001). (C) Maximum intensity projections of CAFs from patient 2 treated with siRNA scrambled control, siRNA against integrin-α5 or integrin-β3, or cilengitide. Bar, 100 µm. Magnified regions are represented by the white squares. F-actin is stained with phalloidin-rhodamine (green), FN is immunostained (magenta), and collagen is acquired using second harmonic generation (cyan). Bar, 20 µm. (D, left) Immunostaining of FN (green) in control CAFs, FN-depleted CAFs, α5-depleted CAFs, and β3-depleted CAFs from patient 2, 3 d after plating. F-actin was stained with phalloidin-rhodamine (red), and DNA was stained with DAPI (blue). Bar, 40 µm. (Right) Graph represents the percentage of assembled FN relative to control conditions defined as the amount of fluorescence in a monolayer (integrated density) normalized to the number of nuclei. Quantification results are expressed as column bars with mean ± SEM. Depleted CAFs were compared with control CAFs for n = 10 frames over n = 4 separate experiments. P-value is calculated using Newman Keuls multiple comparisons test (*, P < 0.05; **, P < 0.01; ***, P < 0.001).
Figure 5.
Figure 5.
Integrin-α5 and -β3 are required at different stages of FN fibrillogenesis. (A) Immunostaining of CAFs on 2D coverslips for integrins α5 and αvβ3 (green) and FN (magenta). F-actin was stained with phalloidin-rhodamine (red), and DNA was stained with DAPI (blue). Bar, 40 µm. (B) Maximum intensity projections of CAFs in 3D collagen matrices immunostained for integrin-αvβ3 (green) and FN (magenta). Collagen was acquired using second harmonic generation (cyan). Bars: (main image) 40 µm; (magnified image) 10 µm. (C) Immunostaining of CAFs 2 h after plating for integrin-α5 or -αvβ3 (green) and FN (magenta). F-actin was stained with phalloidin-rhodamine (red), and DNA was stained with DAPI (blue). Bar, 20 µm. (A–C) Magnified regions are represented by white squares. (D) Model: CAFs present in the collagen I–rich tumor stroma secrete FN. (Top) Contractile forces exerted by CAFs align the ECM and activate αvβ3 at the sites of focal adhesions. (Bottom) αvβ3 activation leads to the formation of fibrillar adhesions and FN fibrillogenesis.

Similar articles

Cited by

References

    1. Amatangelo M.D., Bassi D.E., Klein-Szanto A.J., and Cukierman E.. 2005. Stroma-derived three-dimensional matrices are necessary and sufficient to promote desmoplastic differentiation of normal fibroblasts. Am. J. Pathol. 167:475–488. 10.1016/S0002-9440(10)62991-4 - DOI - PMC - PubMed
    1. Attieh Y., and Vignjevic D.M.. 2016. The hallmarks of CAFs in cancer invasion. Eur. J. Cell Biol. 95:493–502. 10.1016/j.ejcb.2016.07.004 - DOI - PubMed
    1. Aung A., Seo Y.N., Lu S., Wang Y., Jamora C., del Álamo J.C., and Varghese S.. 2014. 3D traction stresses activate protease-dependent invasion of cancer cells. Biophys. J. 107:2528–2537. 10.1016/j.bpj.2014.07.078 - DOI - PMC - PubMed
    1. Calvo F., Ege N., Grande-Garcia A., Hooper S., Jenkins R.P., Chaudhry S.I., Harrington K., Williamson P., Moeendarbary E., Charras G., and Sahai E.. 2013. Mechanotransduction and YAP-dependent matrix remodelling is required for the generation and maintenance of cancer-associated fibroblasts. Nat. Cell Biol. 15:637–646. 10.1038/ncb2756 - DOI - PMC - PubMed
    1. Changede R., Xu X., Margadant F., and Sheetz M.P.. 2015. Nascent Integrin Adhesions Form on All Matrix Rigidities after Integrin Activation. Dev. Cell. 35:614–621. 10.1016/j.devcel.2015.11.001 - DOI - PubMed

Publication types

MeSH terms