Review
. 2017 Oct 1;97(4):1469-1528.
doi: 10.1152/physrev.00035.2016.

Towards Precision Medicine for Hypertension: A Review of Genomic, Epigenomic, and Microbiomic Effects on Blood Pressure in Experimental Rat Models and Humans

Affiliations
Review

Towards Precision Medicine for Hypertension: A Review of Genomic, Epigenomic, and Microbiomic Effects on Blood Pressure in Experimental Rat Models and Humans

Sandosh Padmanabhan et al. Physiol Rev. .

Abstract

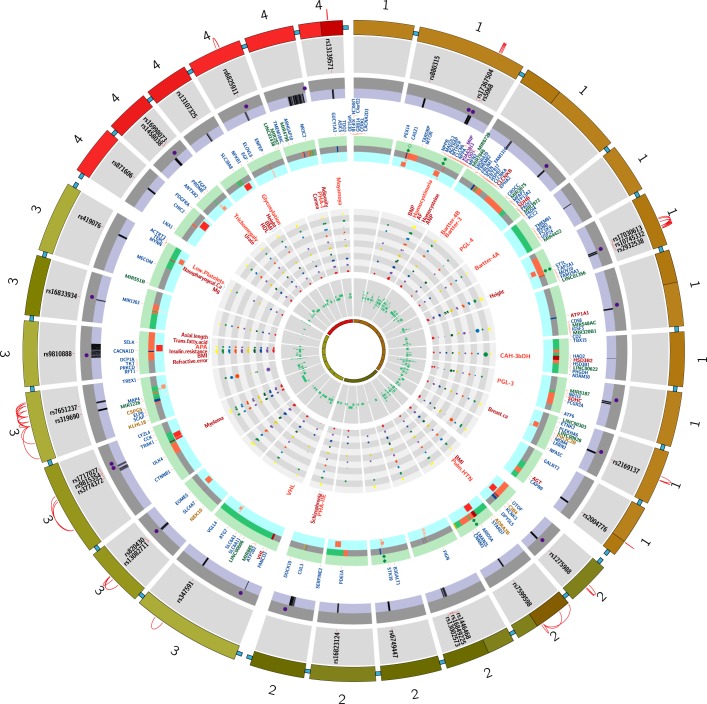
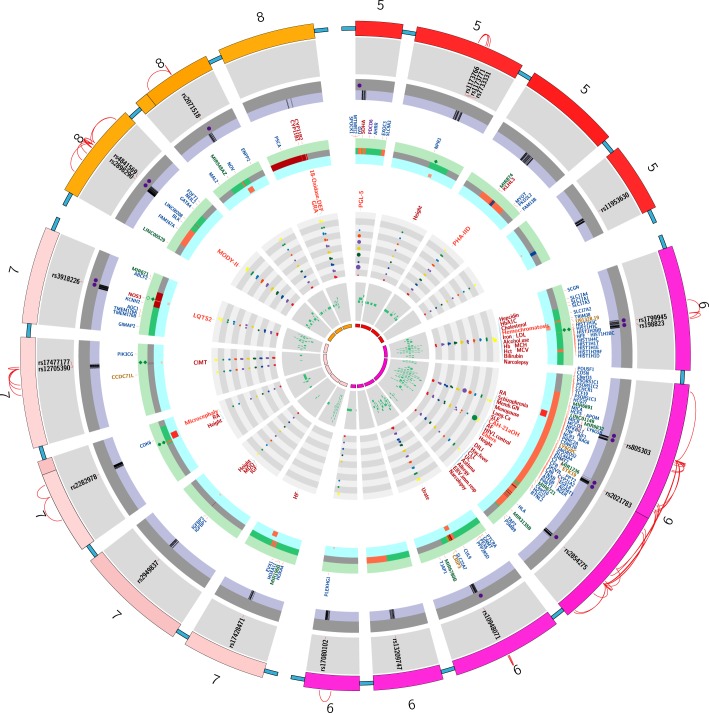
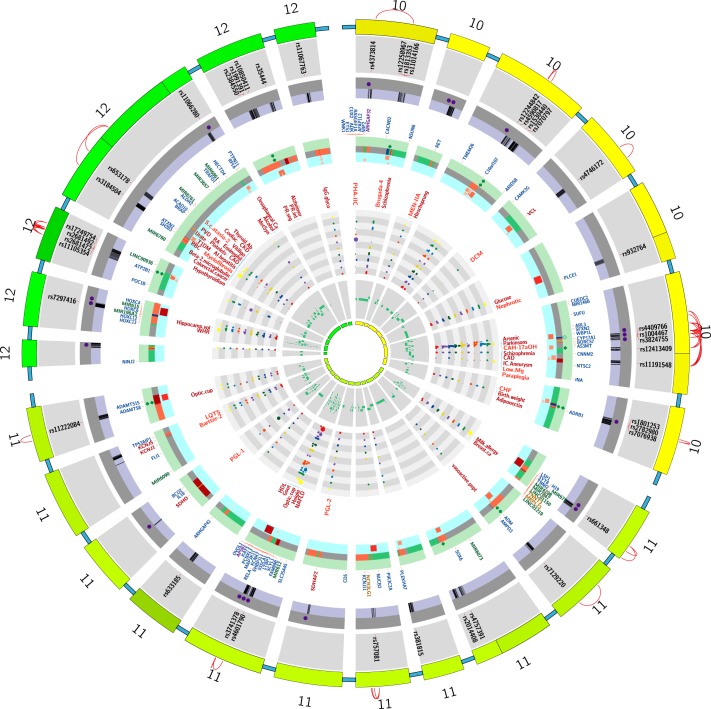
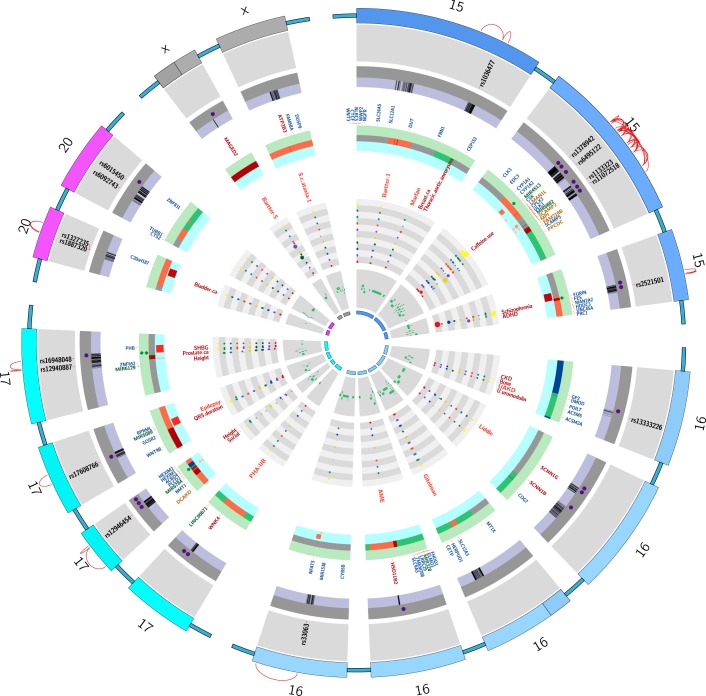
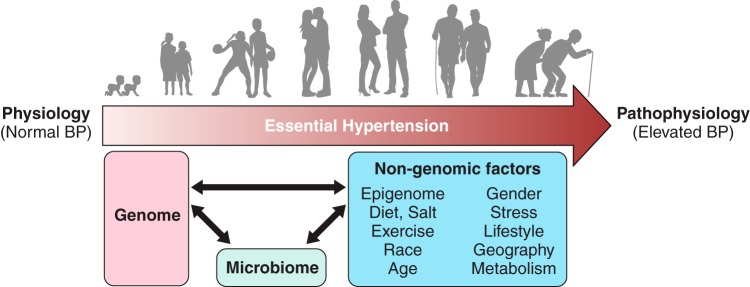
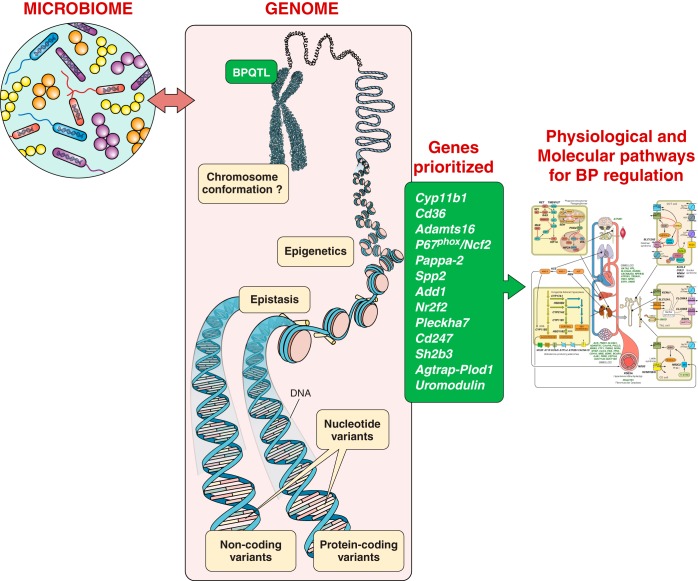
Compelling evidence for the inherited nature of essential hypertension has led to extensive research in rats and humans. Rats have served as the primary model for research on the genetics of hypertension resulting in identification of genomic regions that are causally associated with hypertension. In more recent times, genome-wide studies in humans have also begun to improve our understanding of the inheritance of polygenic forms of hypertension. Based on the chronological progression of research into the genetics of hypertension as the "structural backbone," this review catalogs and discusses the rat and human genetic elements mapped and implicated in blood pressure regulation. Furthermore, the knowledge gained from these genetic studies that provide evidence to suggest that much of the genetic influence on hypertension residing within noncoding elements of our DNA and operating through pervasive epistasis or gene-gene interactions is highlighted. Lastly, perspectives on current thinking that the more complex "triad" of the genome, epigenome, and the microbiome operating to influence the inheritance of hypertension, is documented. Overall, the collective knowledge gained from rats and humans is disappointing in the sense that major hypertension-causing genes as targets for clinical management of essential hypertension may not be a clinical reality. On the other hand, the realization that the polygenic nature of hypertension prevents any single locus from being a relevant clinical target for all humans directs future studies on the genetics of hypertension towards an individualized genomic approach.


Figures

FIGURE 1.
FIGURE 1.
Regions on the rat genome mapped using substitution mapping. *The letters on the x-axis are studies listed with the same alphabet in Table 2. The y-axis of each panel in this figure represents the length of a single rat chromosome. Bars represent the locations of BP QTLs. These locations were determined by searching the Ensembl data (www.ensembl.org) and the rat genome data (www.rgd.mcw.edu) for the rat genome version 6.0. In cases where the locations of the end markers were not available on the rat genome version 6.0, other closest markers or other versions of the rat database were used. Red arrows with names of genes indicate locations on congenic strains where the evidence for the actual gene accounting for the QTL is “strong.” Data with mapping ambiguity for positioning markers on the rat genome map are not featured in this diagram.
FIGURE 2.
FIGURE 2.
A: Circos plots of genomic variant densities between SS/Jr (or S/Jr) and SS/MCW strains of genetically hypertensive rat strains. The outermost ring of numbers 1–20 and X indicate rat chromosomes. The numbers beneath the outer ring that are labels of tick marks represent locations on each chromosome in megabases. The pink-colored outer circumference of Manhattan plots represents the histogram of variants of the SS/MCW strain compared with the rat reference sequence from Brown Norway rat. The blue innermost circumference of Manhattan plots is the histogram of variants of the SS/Jr strain compared with the rat reference sequence from Brown Norway rat. The histograms consist of 10 levels wherein each level represents 2,500 variants. The gray bars in between the 2 histograms (pink and blue) show the average of the 2 densities with darker bars for higher densities. The key data with regard to SS/MCW and SS/Jr strains in this plot are the overlaid red and blue bars over the gray bars. The density of variants is overlaid on the gray average bars with red bars for higher SS/MCW density and blue bars for higher SS/Jr density. The range of density difference from the bottom to the top of a gray bar is minus 12,500 to plus 12,500 variants. This Circos plot was drawn and based on the requested analysis conducted by the Rat Genome Database (www.rgd.mcw.edu). Comparisons of blood pressure (BP) readings from SS/MCW are lower than that of the SS/Jr rats (see FIGURE 2B). Thus this genetic difference could be one of the reasons for this observed relatively lower BP reported for the SS/MCW strain compared with the BP of the SS/Jr strain. B: radiotelemetry measurements of systolic BP of male SS/Mcw and SS/Jr rats. Studies were conducted as per IACUC approved protocols at the University of Toledo. Rats were weaned at 28–30 days of age and fed a low-salt (0.3% NaCl) Harlan Teklad diet. At 40–42 days of age, all rats were placed on a 2% NaCl diet and maintained on this diet for 24 days. While on the high-salt diet, rats were surgically implanted with C40 BP radiotelemetry transmitters. Their BP was monitored on day 25 post the high-salt diet regimen by radiotelemetry. The average systolic BP data plotted in this graph were collected from 4 independent BP studies for SS/MCW (total n = 30) rats and 3 independent BP studies from SS/Jr rats (total n = 21). Data points are 4-h moving averages ± SE. The straight lines through the BP data are trend lines.
FIGURE 3.
FIGURE 3.
Epistatis in rat models. The data in A are redrawn from Pillai et al. (284), and the data in B are redrawn from Figure 1D of Chauvet et al. (39). In each panel BP is given for two congenic strains each for a different QTL and for a double congenic strain which has the introgressed chromosomal segments from both of the original congenic strains. All congenic strains are on the Dahl S genetic background. BP of each congenic strain is expressed as a deviation from Dahl S rats which is defined as the zero point. Blue arrows on the right of the figures show the effect expected if the two QTL effects were additive, and the red arrows show the difference between expected and observed. In both panels the epistatic effects were reported to be significant (P < 0.05). The pattern in A is compatible with two QTL in parallel metabolic pathways, and the pattern in B is compatible with two QTL in series in the same metabolic pathway (299).
FIGURE 4.
FIGURE 4.
Mutations altering blood pressure in humans and GWAS loci linked to plausible genes. The figure shows the circulatory system and pathways that modulate blood pressure containing genes with known mutations that cause monogenic high or low blood pressure syndromes. In addition, plausible genes linked GWAS loci are shown based on multiple lines of evidence (eQTL or nonsynonymous SNPs or genome-wide 3D proximity maps) (374).
FIGURE 5.
FIGURE 5.
Chromosome 1-4: genetic landscape of monogenic and polygenic blood pressure/hypertension syndromes, causal genes, GWAS loci, and information used to prioritize functional genes and variants tagged by the GWAS SNPs (154). The Circos plot tracks from outside inward are as follows: 1) chromosome ideogram; 2) location and ID of GWAS SNPs for BP and hypertension; 3) CpG islands: epigenetic markers such as methylation sites can mark transcriptional activity; 4) DNAse I hypersensitivity sites are open chromatin sites and GWAS variants located in these sites have been shown to control distant genes; 5) genes underlying GWAS SNPs or monogenic BP syndromes: genes in red are monogenic BP genes, while genes in blue are plausible candidate genes that may be causal for the GWAS SNP. For each SNP mapped by GWAS, it is likely that within ∼100,000 bases of the locus, there exists a causal gene. This track just highlights a fraction of the genes present within the selected genetic loci that are most plausible candidates for BP, and the innermost track depicts all the genes that are present within each genetic loci from which the plausible candidates are selected. 6) Regulatory polymorphisms from ORegAnno (Open Regulatory Annotation): location of regulatory regions, transcription factor binding sites, RNA binding sites, regulatory variants, haplotypes, and other regulatory elements from the Open Regulatory Annotation; 7) structural variation (deletion = red, insertion = blue, duplication = yellow): location of structural variation where low frequency and rare variants with intermediate to large effect sizes may lie and require further targeted sequencing studies; 8) multiple alignments of 100 vertebrate species and measurements of evolutionary conservation: highly conserved sites indicating possibly functional sites depicted by size and color intensity of the filled squares; 9) monogenic BP syndromes and GWAS traits for the SNPs and monogenic genes in the outer 2 tracks; 10) GTEX expression data of genes within the selected chromosomal segments: adipose, adrenal, aorta, artery, brain, left ventricle, kidney cortex, liver, muscle, and blood; 11) genes within the chromosome segment. The loops on the top of the ideograms are representation of eQTL locations of GWAS SNPs. Expression quantitative trait loci (eQTL) mapping is performed to find statistical association between a genetic variant and the transcript level of a gene considered as a quantitative trait. eQTL studies can be used as a general method to help identify a set of target genes as many SNPs associated with GWAS traits were shown to be eQTLs.
FIGURE 6.
FIGURE 6.
Chromosome 5-8: genetic landscape of monogenic and polygenic blood pressure/hypertension syndromes, causal genes, GWAS loci, and information used to prioritize functional genes and variants tagged by the GWAS SNPs (154). See legend to Figure 5 for Circos plot track details.
FIGURE 7.
FIGURE 7.
Chromosome 10-12: genetic landscape of monogenic and polygenic blood pressure/hypertension syndromes, causal genes, GWAS loci, and information used to prioritize functional genes and variants tagged by the GWAS SNPs (154). See legend to Figure 5 for Circos plot track details.
FIGURE 8.
FIGURE 8.
Chromosome 15-X: genetic landscape of monogenic and polygenic blood pressure/hypertension syndromes, causal genes, GWAS loci, and information used to prioritize functional genes and variants tagged by the GWAS SNPs (154). See legend to Figure 5 for Circos plot track details.
FIGURE 9.
FIGURE 9.
Cartoon representation of factors influencing the etiology of hypertension. The red double-sided arrow represents the interactions between the host genome and nongenomic factors that act in concert to influence the transition from normal physiology of BP regulation to the pathophysiological state of elevated BP.
FIGURE 10.
FIGURE 10.
Current views on mechanisms by which DNA impacts blood pressure regulation. The genome of the host as well as the genome of microbiota, called microbiome, are depicted as known genomic factors influencing BP. The genes researched and found to be linked or associated with the inheritance of hypertension in rat models and/or in humans are listed on the right hand side of the diagram. Please see note added in proof for Rffl-Inc1 as an additional noncoding locus validated recently as a new BP QTL.
FIGURE 11.
FIGURE 11.
Networks of epistatic interactions. Interaction networks are depicted for starvation resistance (A) and chill coma recovery (B). Nodes depict genes, and edges significant interactions. Red nodes are genes containing significant SNPs from the Flyland analysis. Blue nodes are genes containing significant SNPs from DGRP analysis. [From Huang et al. (123), with permission from Proceedings of the National Academy of Sciences USA.]

Similar articles

Cited by

References

    1. Abiola O, Angel JM, Avner P, Bachmanov AA, Belknap JK, Bennett B, Blankenhorn EP, Blizard DA, Bolivar V, Brockmann GA, Buck KJ, Bureau JF, Casley WL, Chesler EJ, Cheverud JM, Churchill GA, Cook M, Crabbe JC, Crusio WE, Darvasi A, de Haan G, Dermant P, Doerge RW, Elliot RW, Farber CR, Flaherty L, Flint J, Gershenfeld H, Gibson JP, Gu J, Gu W, Himmelbauer H, Hitzemann R, Hsu HC, Hunter K, Iraqi FF, Jansen RC, Johnson TE, Jones BC, Kempermann G, Lammert F, Lu L, Manly KF, Matthews DB, Medrano JF, Mehrabian M, Mittlemann G, Mock BA, Mogil JS, Montagutelli X, Morahan G, Mountz JD, Nagase H, Nowakowski RS, O’Hara BF, Osadchuk AV, Paigen B, Palmer AA, Peirce JL, Pomp D, Rosemann M, Rosen GD, Schalkwyk LC, Seltzer Z, Settle S, Shimomura K, Shou S, Sikela JM, Siracusa LD, Spearow JL, Teuscher C, Threadgill DW, Toth LA, Toye AA, Vadasz C, Van Zant G, Wakeland E, Williams RW, Zhang HG, Zou F; The Complex Trait Consortium . The nature and identification of quantitative trait loci: a community’s view. Nat Rev Genet : 911–916, 2003. doi:10.1038/nrg1206. - DOI - PMC - PubMed
    1. Abumrad NA, Goldberg IJ. CD36 actions in the heart: lipids, calcium, inflammation, repair and more? Biochim Biophys Acta : 1442–1449, 2016. doi:10.1016/j.bbalip.2016.03.015. - DOI - PMC - PubMed
    1. Aitman TJ, Glazier AM, Wallace CA, Cooper LD, Norsworthy PJ, Wahid FN, Al-Majali KM, Trembling PM, Mann CJ, Shoulders CC, Graf D, St Lezin E, Kurtz TW, Kren V, Pravenec M, Ibrahimi A, Abumrad NA, Stanton LW, Scott J. Identification of Cd36 (Fat) as an insulin-resistance gene causing defective fatty acid and glucose metabolism in hypertensive rats. Nat Genet : 76–83, 1999. doi:10.1038/5013. - DOI - PubMed
    1. Al Khodor S, Shatat IF. Gut microbiome and kidney disease: a bidirectional relationship. Pediatr Nephrol : 921–931, 2017. doi:10.1007/s00467-016-3392-7. - DOI - PMC - PubMed
    1. Alemayehu A, Breen L, Krenova D, Printz MP. Reciprocal rat chromosome 2 congenic strains reveal contrasting blood pressure and heart rate QTL. Physiol Genomics : 199–210, 2002. doi:10.1152/physiolgenomics.00065.2002. - DOI - PubMed

Publication types

LinkOut - more resources