. 2017 Oct 25;37(43):10310-10322.
doi: 10.1523/JNEUROSCI.1630-17.2017. Epub 2017 Sep 20.

A Cross Talk between Neuronal Urokinase-type Plasminogen Activator (uPA) and Astrocytic uPA Receptor (uPAR) Promotes Astrocytic Activation and Synaptic Recovery in the Ischemic Brain

Affiliations

A Cross Talk between Neuronal Urokinase-type Plasminogen Activator (uPA) and Astrocytic uPA Receptor (uPAR) Promotes Astrocytic Activation and Synaptic Recovery in the Ischemic Brain

Ariel Diaz et al. J Neurosci. .

Abstract

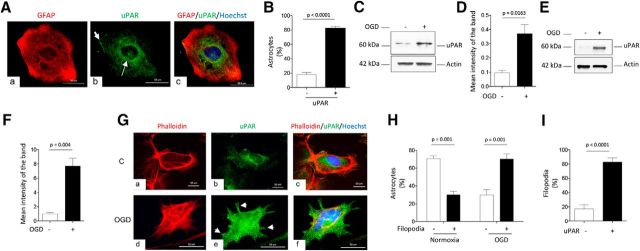
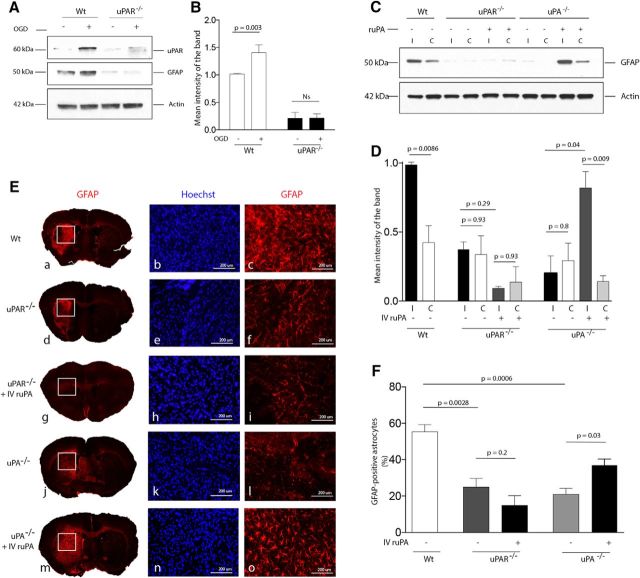
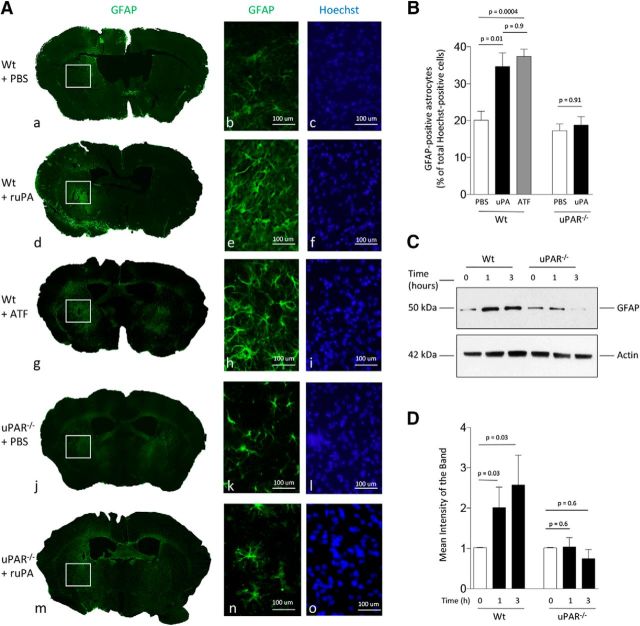
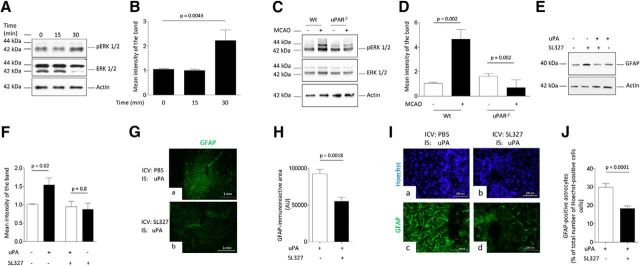
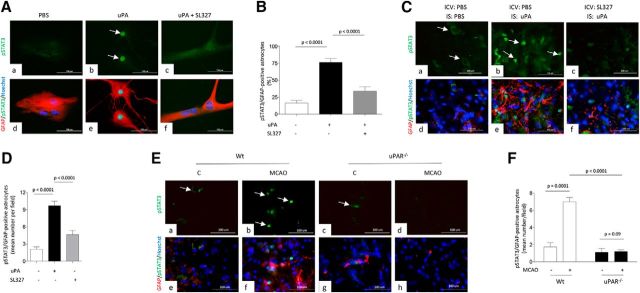
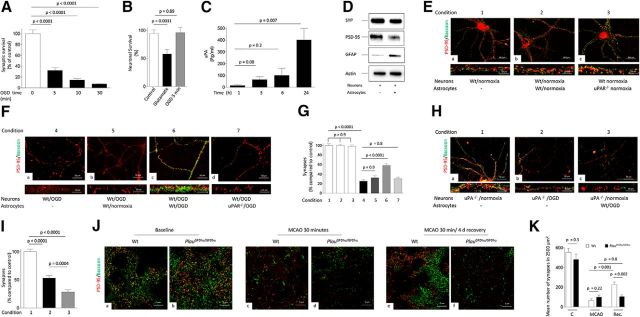
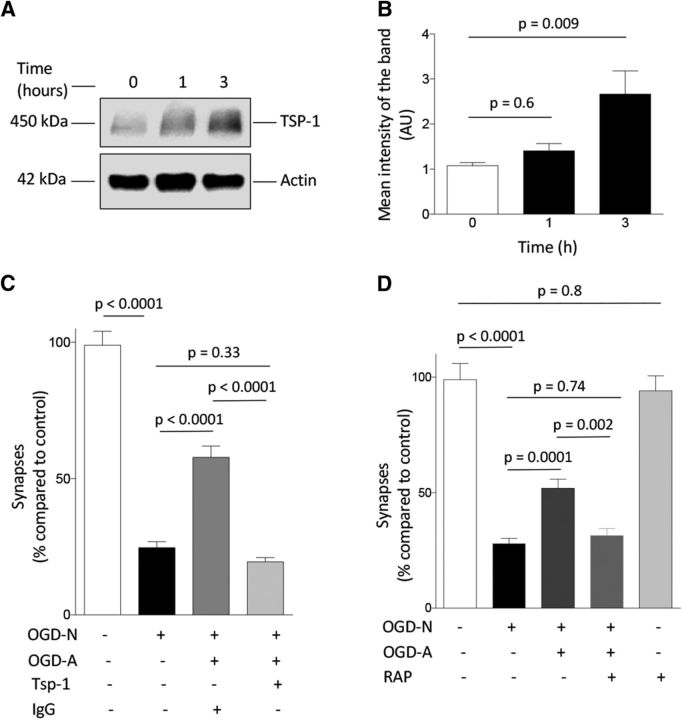
Urokinase-type plasminogen activator (uPA) is a serine proteinase that, upon binding to its receptor (uPAR), catalyzes the conversion of plasminogen into plasmin on the cell surface. Our previous studies indicate that uPA and uPAR expression increase in the ischemic brain during the recovery phase from an acute ischemic injury and that uPA binding to uPAR promotes neurological recovery after an acute ischemic stroke. Here, we used male mice genetically deficient on either uPA (uPA-/-) or uPAR (uPAR-/-) or with a four-amino acid substitution into the growth factor domain of uPA that abrogates its binding to uPAR (PlatGFDhu/GFDhu) to investigate the mechanism whereby uPA promotes neurorepair in the ischemic brain. We found that neurons release uPA and astrocytes recruit uPAR to their plasma membrane during the recovery phase from a hypoxic injury and that binding of neuronal uPA to astrocytic uPAR induces astrocytic activation by a mechanism that does not require plasmin generation, but instead is mediated by extracellular signal-regulated kinase 1/2 (ERK1/2)-regulated phosphorylation of the signal transducer and activator of transcription 3 (STAT3). We report that uPA/uPAR binding is necessary and sufficient to induce astrocytic activation in the ischemic brain and that astrocytes activated by neuronal uPA promote synaptic recovery in neurons that have suffered an acute hypoxic injury via a mechanism mediated by astrocytic thrombospondin-1 (TSP1) and synaptic low-density lipoprotein receptor-related protein-1 (LRP1). In summary, we show that uPA/uPAR-induced astrocytic activation mediates a cross talk between astrocytes and injured neurons that promotes synaptic recovery in the ischemic brain.SIGNIFICANCE STATEMENT To date, there is no therapeutic strategy to promote synaptic recovery in the injured brain. Here, we show that neurons release urokinase-type plasminogen activator (uPA) and astrocytes recruit the uPA receptor (uPAR) to their plasma membrane during the recovery phase from a hypoxic injury. We found that binding of neuronal uPA to astrocytic uPAR promotes astrocytic activation and that astrocytes activated by uPA-uPAR binding promote synaptic recovery in neurons that have suffered a hypoxic injury by a mechanism that does not require plasmin generation, but instead is mediated by ERK1/2-regulated STAT3 phosphorylation, astrocytic thrombospondin-1 (TSP1) and synaptic low-density lipoprotein receptor-related protein-1 (LRP1). Our work unveils a new biological function for uPA-uPAR as mediator of a neuron-astrocyte cross talk that promotes synaptic recovery in the ischemic brain.

Keywords: astrogliosis; neurorepair; plasmin; recovery; urokinase-type plasminogen activator.


Figures

Figure 1.
Figure 1.
Astrocytic expression of uPAR. A, Representative micrographs of an unstimulated WT astrocyte immunostained with antibodies against GFAP (red, a) and uPAR (green, b). Blue is the nuclear marker Hoechst 33342. c, Merged images. Magnification: 60×. Thin and thick arrows in b denote perinuclear and cortical expression of uPAR, respectively. B, Percentage of uPAR-positive and uPAR-negative astrocytes among 155 unstimulated cells examined from four different cultures. Error bars indicate SEM. Statistical analysis was performed with two-tailed t test. C, D, Representative Western blot analysis (C) and mean intensity of the band (D) of uPAR expression in WT astrocytes either kept under normoxic conditions or after 1 h of exposure to OGD. n = 4. Statistical analysis performed with two-tailed t test. E, F, Representative Western blot analysis (E) and quantification of the mean intensity of the band (F) of uPAR expression in the plasma membrane of WT astrocytes. Biotin labeling was used to assess uPAR expression under normoxia or after 1 h of exposure to OGD. Lines indicate SEM. n = 4. Statistical analysis was performed with two-tailed t test. G, Representative micrographs of WT astrocytes immunostained with phalloidin (red in a and d) and anti-uPAR antibodies (green in b and e) under normoxia (control, C) or after 1 h of exposure to OGD conditions. c and f correspond to merged images. Blue is the nuclear marker Hoechst 33342. Arrows in e depict uPAR-positive filopodia. Magnification: 60×. H, Mean percentage of astrocytes exhibiting filopodial extensions after incubation under normoxic conditions, or after 1 h of exposure to OGD. n = 150 astrocytes examined from five different cultures. Error bars indicate SEM. Statistical analysis was performed with two-way ANOVA with Holm–Sidak correction. I, Percentage of uPAR-positive and uPAR-negative filopodia in astrocytes exposed to 1 h of OGD conditions. n = 150 astrocytes examined from five different cultures. Error bars indicate SEM. Statistical analysis was performed with two-tailed t test.
Figure 2.
Figure 2.
uPA binding to uPAR mediates cerebral ischemia-induced astrocytic activation. A, B, Representative Western blotting for uPAR and GFAP expression (A) and quantification of the mean intensity of the band (B) in WT and uPAR−/− astrocytes kept under normoxic conditions or exposed to 1 h of OGD conditions. n = 4 observations per experimental condition. Lines indicate SEM. Statistical analysis was performed with two-way ANOVA with Holm–Sidak correction. C, D, Representative Western blot analysis (C) and quantification of the mean intensity of the band (D) of GFAP expression in the ischemic (i) tissue and a comparable area in the contralateral (c) nonischemic hemisphere of WT, uPAR−/− and uPA−/− mice 96 h after tMCAO and intravenous treatment with either saline solution or ruPA. n = 4 animals per experimental group. Lines indicate SEM. Statistical analysis was performed with two-way ANOVA with Holm–Sidak correction. E, Representative micrographs of GFAP immunostaining in the ischemic area of WT, uPAR−/− and uPA−/− mice 96 h after tMCAO and intravenous treatment with either saline solution or ruPA. Blue is the nuclear marker Hoechst 33342. n = 5 animals per experimental condition. Magnification is 4× in a, d, g, j, and m. b, c, e, f, h, i, k, l, n and o correspond to a 20× magnification of the area denoted by the corresponding white squares in a, d, g, j, and m. F, Mean percentage of GFAP-positive astrocytes in relation to the total number of Hoechst-positive cells examined (denoted in parenthesis for each experimental group) in the ischemic tissue of WT (n = 6667 cells), uPAR−/− (n = 5456 cells), and uPA−/− mice (n = 5234 cells) 96 h after tMCAO. A subgroup of uPAR−/− and uPA−/− mice (n = 5 per strain) were treated intravenously with ruPA (n = 5748 and n = 6452 cells examined, respectively). Lines indicate SEM. Statistical analysis was performed with one-way ANOVA with Holm–Sidak correction.
Figure 3.
Figure 3.
uPA–uPAR binding is sufficient to induce plasmin-independent astrocytic activation in vivo. A, a, d, g, j, and m correspond to representative brain sections from WT and uPAR−/− mice immunostained with antibodies against GFAP (green) and the nuclear marker Hoechst 33342 (blue) 48 h after the intrastriatal injection of 5 nm uPA, its ATF (devoid of proteolytic activity), or a comparable volume of PBS. b, c, e, f, h, i, k, l, n and o correspond to a 20 × magnification of the area denoted by the white square in each experimental group. B, Mean percentage of GFAP-positive astrocytes in relation to the total number of Hoechst-positive cells examined (denoted in parenthesis for each experimental group) 48 h after the intrastriatal injection of PBS (n = 2020 cells examined), uPA (2988 cells examined), or ATF (1597 cells examined) in WT mice or PBS (1916 cells examined) or uPA (2241 cells examined) in uPAR−/− mice. Lines indicate SEM. n = 3 animals per experimental condition. Statistical analysis was performed with one-way ANOVA with Holm–Sidak correction. C, D, Representative Western blot analysis (C) and quantification of the mean intensity of the band (D) of GFAP expression in WT and uPAR−/− astrocytes after 0–3 h of incubation with 5 nm uPA. Lines indicate SEM. n = 4 per experimental condition. Statistical analysis was performed with two-tailed t test.
Figure 4.
Figure 4.
ERK1/2-regulated STAT3 phosphorylation mediates uPA-induced astrocytic activation. A, B, Representative Western blot analysis (A) and quantification of the mean intensity of the band (B) of pERK1/2 and total ERK1/2 expression in WT astrocytes incubated 0–30 min with 5 nm uPA. n = 3 observations per experimental condition. Lines indicate SEM. Statistical analysis was performed with one-way ANOVA with Holm–Sidak correction. C, D, Representative Western blot analysis (C) and quantification of the mean intensity of the band (D) of pERK1/2 and total ERK1/2 expression in the ischemic tissue of WT and uPAR−/− mice subjected to 30 min of tMCAO. Controls correspond to sham-operated WT and uPAR−/−animals. Statistical analysis was performed with one-way ANOVA with Tukey's correction. n = 4 animals per experimental group. E, F, Representative Western blot analysis (E) and quantification of the mean intensity of the band (F) of GFAP expression in WT astrocytes incubated 3 h with 5 nm uPA alone or in the presence of the ERK1/2 inhibitor SL327. n = 3 observations per experimental group. Statistical analysis was performed with two-tailed t test. G, Representative micrograph of the striatum of WT mice stained with anti-GFAP antibodies 48 h after the intracerebroventricular (ICV) administration of either PBS (a), or SL327 (b) followed by the intrastriatal (IS) injection of 5 nm uPA. Magnification, 4×. H, Mean area immunoreactive to anti-GFAP antibodies in the striatum of WT mice subjected to the experimental conditions described in E. Lines indicate SEM. n = 4 animals per experimental condition. Statistical analysis was performed with two-tailed t test. I, J, Representative micrographs at 20× magnification (I) and mean percentage of GFAP-positive astrocytes in relation to the total number of Hoechst-positive cells examined (J; shown in parentheses for each experimental group) 48 h after the intrastriatal injection of uPA preceded by the intracerebroventricular injection of either PBS (7439 cells examined) or SL327 (7798 cells examined). Lines indicate SEM. n = 4 animals per experimental condition. Statistical analysis was performed with two-tailed t test.
Figure 5.
Figure 5.
uPA induces ERK1/2-mediated astrocytic STAT3 phosphorylation. A, Representative micrograph of WT astrocytes treated during 1 h with PBS (a, d), 5 nm uPA alone (b, e), or in the presence of 10 μm SL327 (c, f). Red is GFAP, green is pSTAT3, and blue is the nuclear marker Hoechst 33342. Arrows in b denote examples of pSTAT3-positive nuclei. B, Mean percentage of astrocytes with pSAT3-positive nuclei after 1 h of treatment with PBS (n = 90 cells examined), 5 nm uPA (n = 107 cells examined), or a combination of uPA and SL327 (n = 128 cells examined). Observations were repeated in three different neuronal cultures. Lines indicate SEM. Statistical analysis was performed with one-way ANOVA with Tukey's correction. C, Representative micrographs of brain sections cut through the striatum of WT mice (n = 4 per condition) and costained with anti-GFAP (red) and pSTAT3 (green) antibodies 48 h after the intracerebroventricular (ICV) administration of either PBS (a, b, d, and e) or SL327 (c and f), followed by the intrastriatal injection of either of either 5 nM of uPA (b and e) or a comparable volume of PBS (a and d). n = 4 animals per experimental condition. Magnification, 20×. D, Mean number of pSTAT3-immunoreactive astrocytes per field at 40× magnification in the striatum of WT mice exposed to the experimental conditions described in C. Lines depict SEM. n = 4 animals per experimental condition. Statistical analysis was performed with one-way ANOVA with Tukey's correction. E, Representative micrographs of pSTAT 3 (green), GFAP (red), and Hoechst (blue) staining in the area surrounding the necrotic core of WT (a, b, e, f) and uPAR−/− (c, d, g, h) mice 48 h after 30 min of tMCAO. Controls (C) correspond to a comparable area in sham-operated animals. n = 4 animals per experimental group. Magnification, 20×. Arrows in a, b, and c denote examples of pSTAT3-positive astrocytes. F, Mean number of Hoechst-positive cells immunoreactive to GFAP and pSTAT3 antibodies per field at 40× magnification in WT and uPAR−/− mice subjected to the experimental conditions described in E. n = 4 animals per experimental group. Statistical analysis was performed with two-way ANOVA with Tukey's correction.
Figure 6.
Figure 6.
Effect of uPA–uPAR binding on synaptic recovery. A, Mean percentage of synaptic contacts immunoreactive to both PSD-95 and bassoon in cultures of WT cerebral cortical neurons kept under normoxia or exposed to 0–30 min of OGD conditions. n = 30 neurons examined per experimental condition in cells from three different cultures. Lines indicate SEM. Statistical analysis was performed with one-way ANOVA with Holm–Sidak correction. B, Mean percentage of alive neurons either under physiological conditions (white bar; n = 33 cells examined) or exposed for 5 min to either 50 μm glutamate (black bar; n = 30 cells examined) or OGD (gray bar; n = 28 cells examined). Each observation was repeated in three different neuronal cultures. Lines indicate SEM. Statistical analysis was performed with one-way ANOVA with Holm–Sidak correction. C, Mean concentration of uPA in the culture medium of WT cerebral cortical neurons 1–24 h after 60 min of OGD. n = 5 observations per time point repeated with neurons from three different cultures. Lines indicate SEM. Statistical analysis was performed with one-way ANOVA with Tukey's correction. D, Representative Western blot analysis for synaptophysin (SYP), PSD-95, and GFAP expression in synaptoneurosomes prepared from WT neurons kept alone or in the presence of WT astrocytes. E, Representative micrographs at 20× magnification WT cerebral cortical neurons maintained under normoxic conditions alone (a) or in the presence of either WT (b) or uPAR−/− (c) astrocytes and immunostained with antibodies against PSD-95 (red) and bassoon (green). Bottom panels correspond to an electronic magnification of a representative neuronal extension for each experimental group. F, Representative micrographs at 20× magnification of WT cerebral cortical neurons stained with anti-PSD-95 (red) and anti-bassoon (green) after 5 min of OGD and 24 h of recovery alone (a) or in the presence of WT astrocytes either kept under normoxic conditions (b) or previously activated by 3 h of OGD (c). d, WT neurons recovered in the presence of uPAR−/− astrocytes previously exposed to 3 h of OGD conditions. Bottom panels correspond to an electronic magnification of a representative neuronal extension for each experimental group. G, Mean percentage of synaptic contacts immunoreactive to both PSD-95 and bassoon in WT neurons exposed to the seven experimental conditions described in E and F. Each observation was repeated 50 times in three different neuronal cultures. Statistical analysis was performed with one-way ANOVA with Tukey's correction. H, Representative micrographs at 20× magnification of uPA−/− cerebral cortical neurons stained with anti-PSD-95 (red) and anti-bassoon (green) antibodies under normoxic conditions (a) or 24 h after 5 min of OGD and recovery alone (b) or in the presence of WT astrocytes previously activated by 3 h of OGD conditions (c). Bottom panels correspond to an electronic magnification of a representative neuronal extension for each experimental group. I, Mean percentage of synaptic contacts immunoreactive to both PSD-95 and bassoon in uPA−/− neurons exposed to the experimental conditions described in F. Each observation was repeated 35 times in three different neuronal cultures. Lines indicate SEM. Statistical analysis was performed with one-way ANOVA with Tukey's correction. J, Representative confocal microscopy images obtained within 1 mm from the border of the necrotic core of WT and PlatGFDhu/GFDhu, either under normoxic conditions (a and b), or immediately after (c and d) or after 4 days of recovery (e and f) from 30 minutes of tMCAO. Baseline corresponds to micrographs obtained in a corresponding area of sham-operated animals. Images were taken at 60× magnifications and electronically enhanced 252 times. Red corresponds to PSD-95 and green denotes bassoon immunoreactivity. K, Mean number of synaptic contacts per 2500 μm2 of tissue in WT and PlatGFDhu/GFDhu mice subjected to the experimental conditions described in J. n = 3 animals per experimental group. Lines indicate SEM. Statistical analysis was performed with two-way ANOVA with Tukey's correction.
Figure 7.
Figure 7.
TSP1 and LRP1 mediate the effect of uPA on synaptic recovery. A, B, Representative Western blot analysis (A) and mean intensity of the band (B) of TSP1 expression in WT astrocytes incubated 0–3 h with 5 nm uPA. n = 3 observations per experimental condition. Statistical analysis was performed with one-way ANOVA with Dunnett's correction. C, Mean percentage of synaptic contacts immunoreactive to both PSD-95 and bassoon in WT cerebral cortical neurons maintained under normoxic conditions (white bar; n = 45 neurons examined) or exposed to 5 min of OGD followed by 24 h of recovery alone (black bar; n = 30 neurons examined) or in the presence of WT astrocytes previously exposed to 3 h of OGD conditions and incubated with either an isotype IgG (control, dark gray bar; n = 25 neurons examined) or 4 μg/ml TSP1-blocking antibodies (light gray bar; n = 46 neurons examined). Lines indicate SEM. Each observation was repeated in three different neuronal cultures. Statistical analysis was performed with one-way ANOVA with Holm–Sidak correction. D, Mean percentage of synaptic contacts immunoreactive to both PSD-95 and bassoon in WT cerebral cortical neurons maintained under normoxic conditions (white bar; n = 30 cells examined) or exposed to 5 min of OGD conditions followed by 24 h of recovery alone (black bar; n = 60 cells examined) or in the presence of WT astrocytes previously exposed to 3 h of OGD conditions (dark gray bar; n = 55 cells examined) or WT astrocytes exposed to 3 h of OGD conditions in the presence of 125 nm RAP (light gray bar; n = 26 cells examined). A subset of neurons was incubated with RAP during 24 h under normoxic conditions (silver bar; 25 cells examined). Each observation was repeated in three different neuronal cultures. Lines indicate SEM. Statistical analysis was performed with one-way ANOVA with Holm–Sidak correction.

Similar articles

Cited by

References

    1. Adams JC, Lawler J (2011) The thrombospondins. Cold Spring Harb Perspect Biol 3:a009712. 10.1101/cshperspect.a009712 - DOI - PMC - PubMed
    1. Alessandrini A, Namura S, Moskowitz MA, Bonventre JV (1999) MEK1 protein kinase inhibition protects against damage resulting from focal cerebral ischemia. Proc Natl Acad Sci U S A 96:12866–12869. 10.1073/pnas.96.22.12866 - DOI - PMC - PubMed
    1. Alilain WJ, Horn KP, Hu H, Dick TE, Silver J (2011) Functional regeneration of respiratory pathways after spinal cord injury. Nature 475:196–200. 10.1038/nature10199 - DOI - PMC - PubMed
    1. An JJ, Gharami K, Liao GY, Woo NH, Lau AG, Vanevski F, Torre ER, Jones KR, Feng Y, Lu B, Xu B (2008) Distinct role of long 3′ UTR BDNF mRNA in spine morphology and synaptic plasticity in hippocampal neurons. Cell 134:175–187. 10.1016/j.cell.2008.05.045 - DOI - PMC - PubMed
    1. Bernardinelli Y, Muller D, Nikonenko I (2014) Astrocyte-synapse structural plasticity. Neural Plast 2014:232105. 10.1155/2014/232105 - DOI - PMC - PubMed

Publication types

Substances

LinkOut - more resources