

Individual Alpha Peak Frequency Predicts 10 Hz Flicker Effects on Selective Attention
- PMID: 28931569
- PMCID: PMC6596538
- DOI: 10.1523/JNEUROSCI.1163-17.2017
Individual Alpha Peak Frequency Predicts 10 Hz Flicker Effects on Selective Attention
Abstract
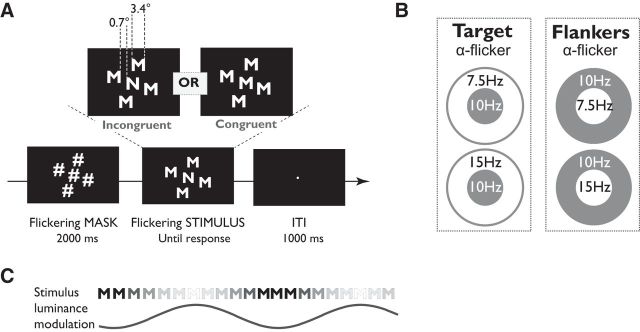
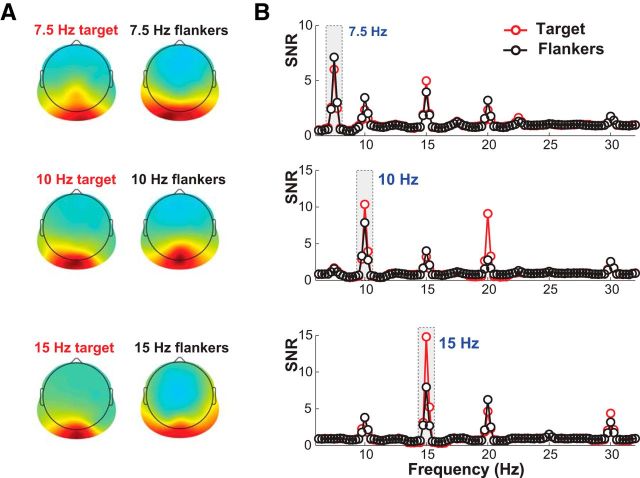
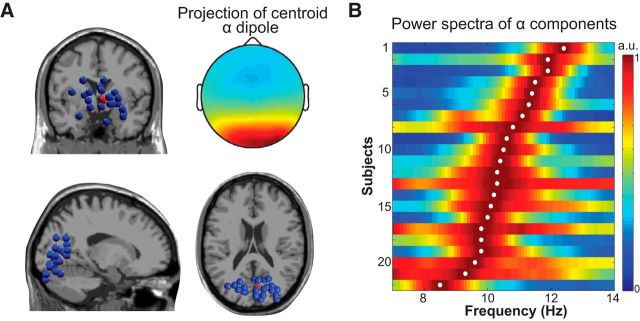
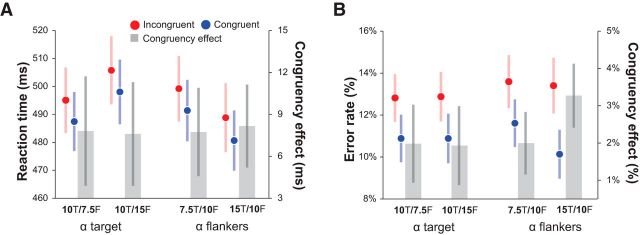
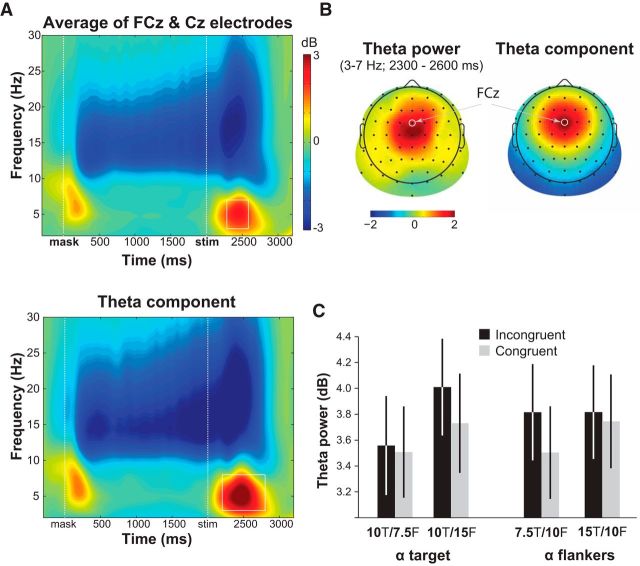
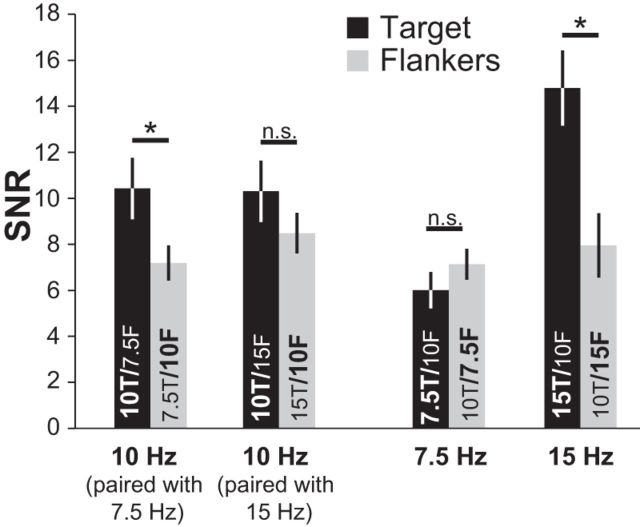
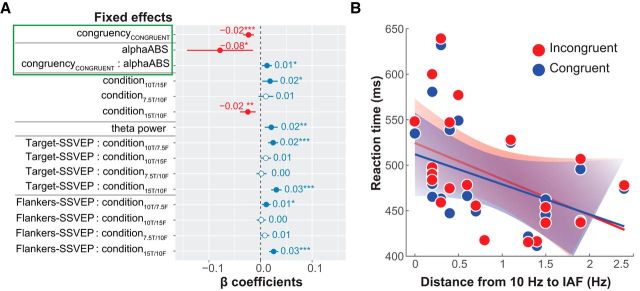
Rhythmic visual stimulation ("flicker") is primarily used to "tag" processing of low-level visual and high-level cognitive phenomena. However, preliminary evidence suggests that flicker may also entrain endogenous brain oscillations, thereby modulating cognitive processes supported by those brain rhythms. Here we tested the interaction between 10 Hz flicker and endogenous alpha-band (∼10 Hz) oscillations during a selective visuospatial attention task. We recorded EEG from human participants (both genders) while they performed a modified Eriksen flanker task in which distractors and targets flickered within (10 Hz) or outside (7.5 or 15 Hz) the alpha band. By using a combination of EEG source separation, time-frequency, and single-trial linear mixed-effects modeling, we demonstrate that 10 Hz flicker interfered with stimulus processing more on incongruent than congruent trials (high vs low selective attention demands). Crucially, the effect of 10 Hz flicker on task performance was predicted by the distance between 10 Hz and individual alpha peak frequency (estimated during the task). Finally, the flicker effect on task performance was more strongly predicted by EEG flicker responses during stimulus processing than during preparation for the upcoming stimulus, suggesting that 10 Hz flicker interfered more with reactive than proactive selective attention. These findings are consistent with our hypothesis that visual flicker entrained endogenous alpha-band networks, which in turn impaired task performance. Our findings also provide novel evidence for frequency-dependent exogenous modulation of cognition that is determined by the correspondence between the exogenous flicker frequency and the endogenous brain rhythms.SIGNIFICANCE STATEMENT Here we provide novel evidence that the interaction between exogenous rhythmic visual stimulation and endogenous brain rhythms can have frequency-specific behavioral effects. We show that alpha-band (10 Hz) flicker impairs stimulus processing in a selective attention task when the stimulus flicker rate matches individual alpha peak frequency. The effect of sensory flicker on task performance was stronger when selective attention demands were high, and was stronger during stimulus processing and response selection compared with the prestimulus anticipatory period. These findings provide novel evidence that frequency-specific sensory flicker affects online attentional processing, and also demonstrate that the correspondence between exogenous and endogenous rhythms is an overlooked prerequisite when testing for frequency-specific cognitive effects of flicker.
Keywords: SSVEP; alpha oscillations; attention; entrainment; flicker; steady-state visual-evoked potentials.
Copyright © 2017 the authors 0270-6474/17/3710173-12$15.00/0.
Figures
Similar articles
-
Stimulus-Driven Brain Rhythms within the Alpha Band: The Attentional-Modulation Conundrum.J Neurosci. 2019 Apr 17;39(16):3119-3129. doi: 10.1523/JNEUROSCI.1633-18.2019. Epub 2019 Feb 15. J Neurosci. 2019. PMID: 30770401 Free PMC article.
-
No Evidence for Entrainment: Endogenous Gamma Oscillations and Rhythmic Flicker Responses Coexist in Visual Cortex.J Neurosci. 2021 Aug 4;41(31):6684-6698. doi: 10.1523/JNEUROSCI.3134-20.2021. Epub 2021 Jul 6. J Neurosci. 2021. PMID: 34230106 Free PMC article.
-
Competitive effects on steady-state visual evoked potentials with frequencies in- and outside the α band.Exp Brain Res. 2010 Sep;205(4):489-95. doi: 10.1007/s00221-010-2384-2. Epub 2010 Aug 14. Exp Brain Res. 2010. PMID: 20711565 Clinical Trial.
-
Evoked alpha and early access to the knowledge system: the P1 inhibition timing hypothesis.Brain Res. 2011 Aug 23;1408:52-71. doi: 10.1016/j.brainres.2011.06.003. Epub 2011 Jun 12. Brain Res. 2011. PMID: 21774917 Free PMC article. Review.
-
Pre-stimulus activities affect subsequent visual processing: Empirical evidence and potential neural mechanisms.Brain Behav. 2025 Feb;15(2):e3654. doi: 10.1002/brb3.3654. Brain Behav. 2025. PMID: 39907172 Free PMC article. Review.
Cited by
-
Assessing Rhythmic Visual Entrainment and Reinstatement of Brain Oscillations to Modulate Memory Performance.Front Behav Neurosci. 2020 Jul 16;14:118. doi: 10.3389/fnbeh.2020.00118. eCollection 2020. Front Behav Neurosci. 2020. PMID: 32765231 Free PMC article.
-
Phase synchronization varies systematically with linguistic structure composition.Philos Trans R Soc Lond B Biol Sci. 2020 Feb 3;375(1791):20190305. doi: 10.1098/rstb.2019.0305. Epub 2019 Dec 16. Philos Trans R Soc Lond B Biol Sci. 2020. PMID: 31840584 Free PMC article.
-
Modulation of rhythmic visual stimulation on left-right attentional asymmetry.Front Neurosci. 2023 May 12;17:1156890. doi: 10.3389/fnins.2023.1156890. eCollection 2023. Front Neurosci. 2023. PMID: 37250403 Free PMC article.
-
Long-range and cross-frequency neural modulation of gamma flicker on vigilance decrement.Cogn Neurodyn. 2024 Apr;18(2):417-429. doi: 10.1007/s11571-023-10008-6. Epub 2023 Oct 4. Cogn Neurodyn. 2024. PMID: 39554724 Free PMC article.
-
FREQ-NESS Reveals the Dynamic Reconfiguration of Frequency-Resolved Brain Networks During Auditory Stimulation.Adv Sci (Weinh). 2025 May;12(20):e2413195. doi: 10.1002/advs.202413195. Epub 2025 Apr 10. Adv Sci (Weinh). 2025. PMID: 40211612 Free PMC article.
References
-
- Akaike H. (1974) A new look at the statistical model identification. IEEE Trans Automat Contr 19:716–723. 10.1109/TAC.1974.1100705 - DOI
Publication types
MeSH terms
LinkOut - more resources
Full Text Sources
Other Literature Sources