. 2017 Oct 25;37(43):10290-10309.
doi: 10.1523/JNEUROSCI.1109-17.2017. Epub 2017 Sep 20.

Chd7 Collaborates with Sox2 to Regulate Activation of Oligodendrocyte Precursor Cells after Spinal Cord Injury

Affiliations

Chd7 Collaborates with Sox2 to Regulate Activation of Oligodendrocyte Precursor Cells after Spinal Cord Injury

Toru Doi et al. J Neurosci. .

Abstract

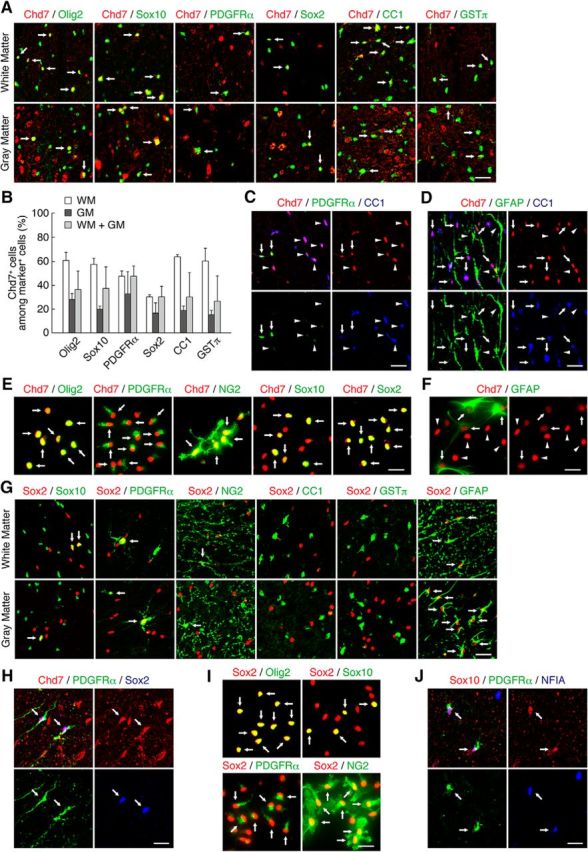
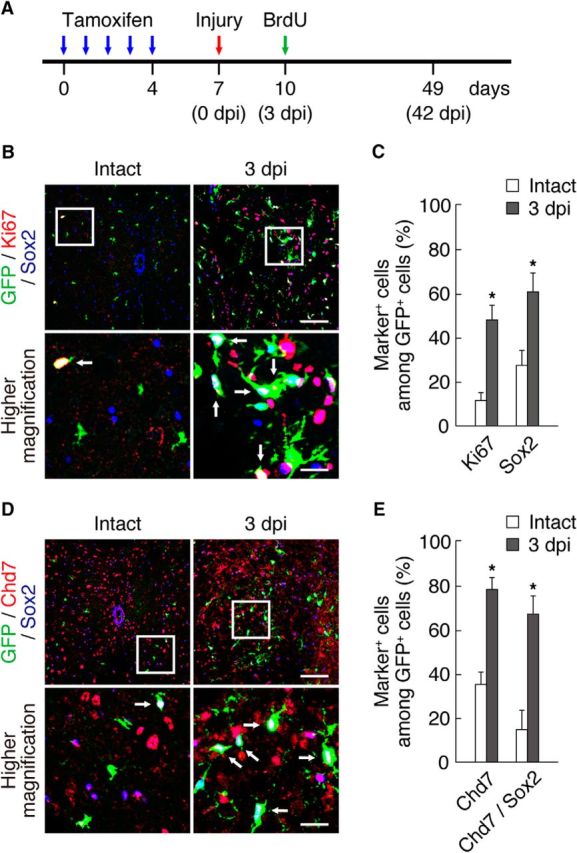
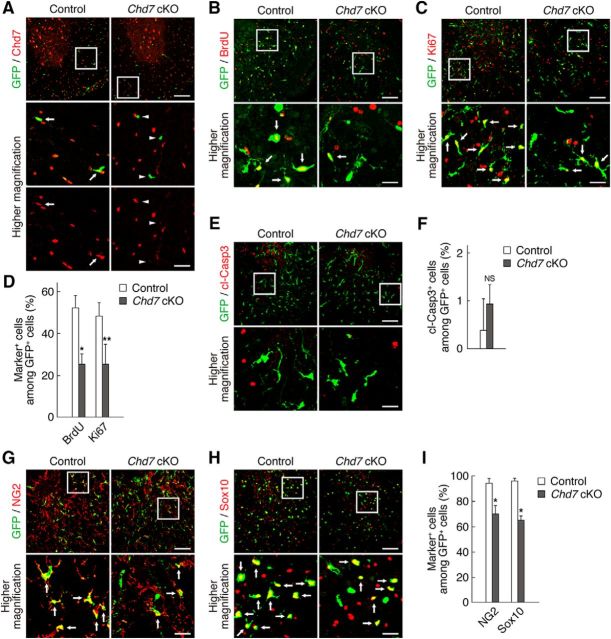
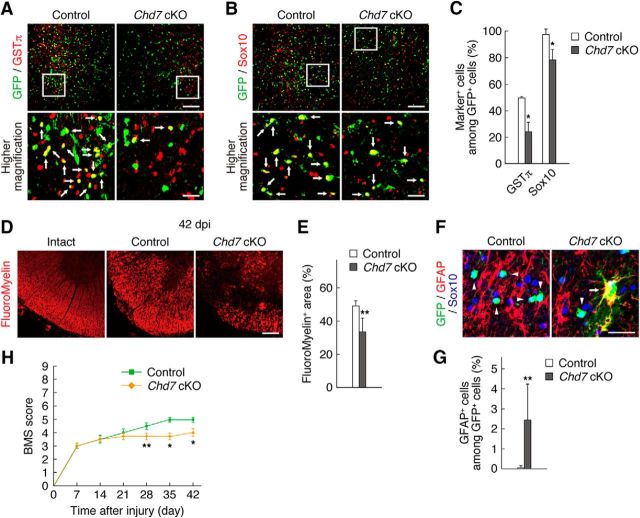
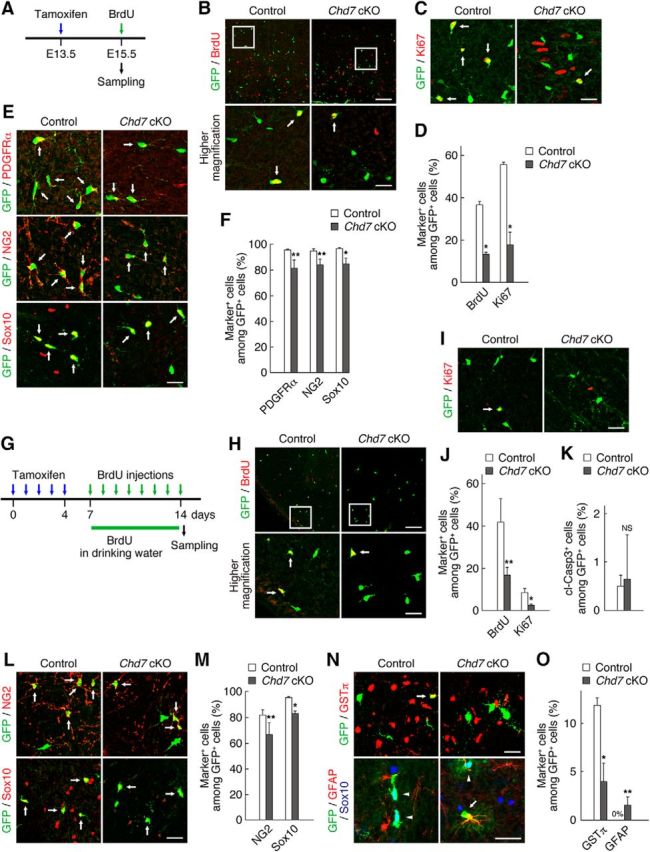
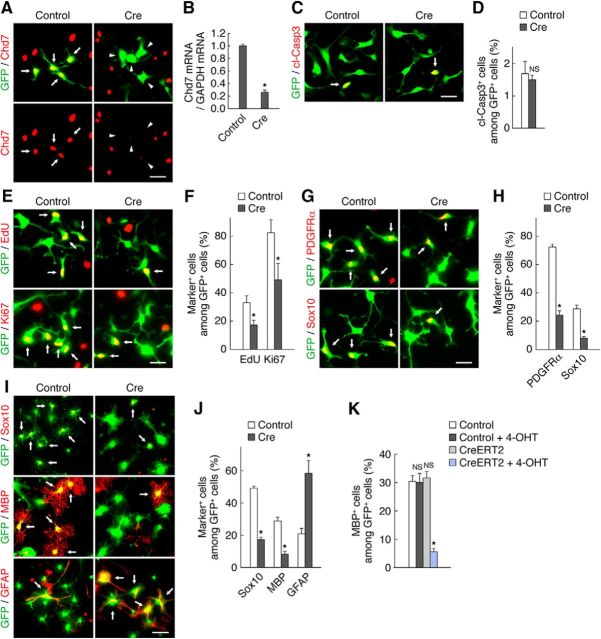
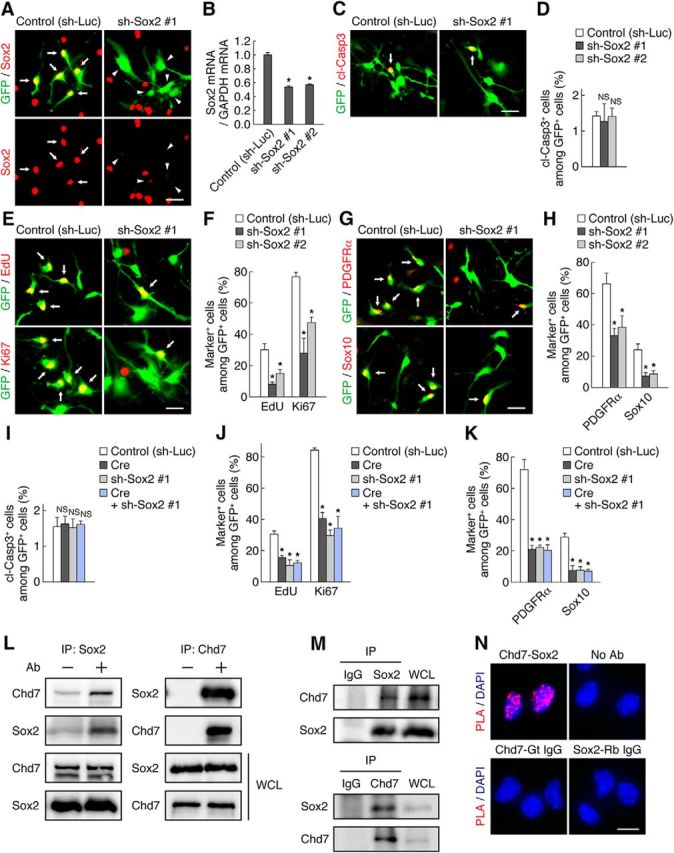
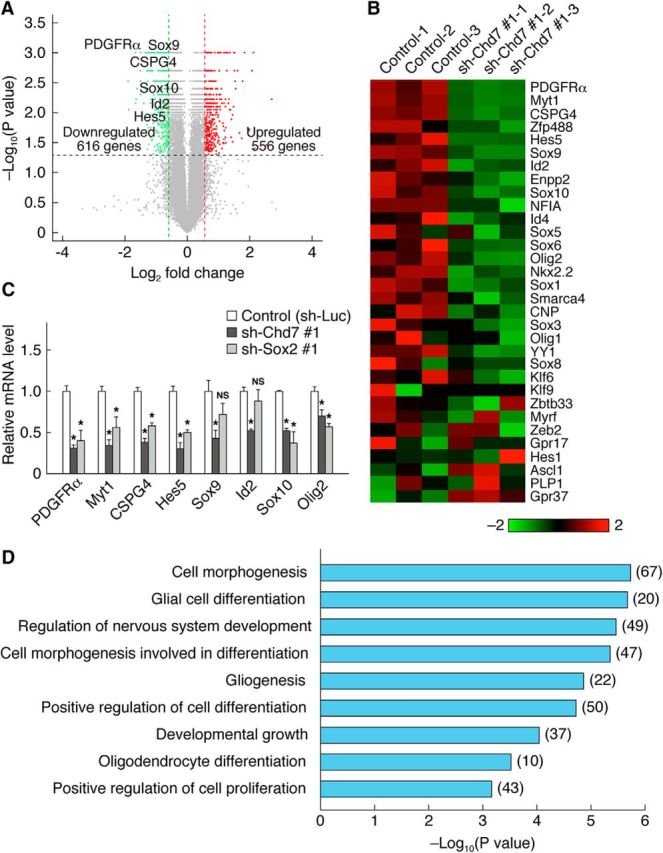
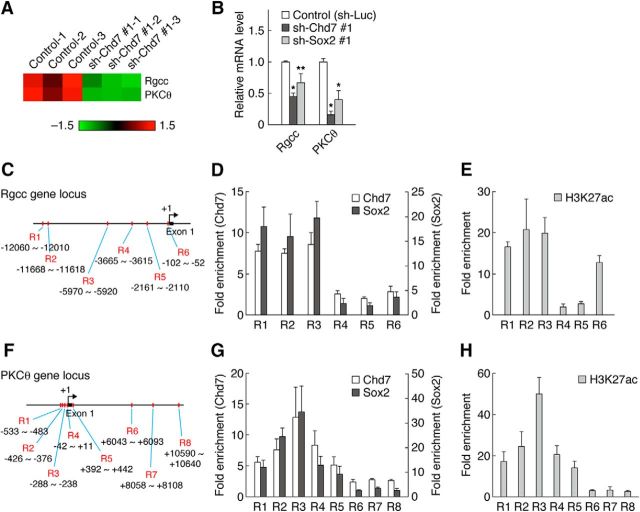
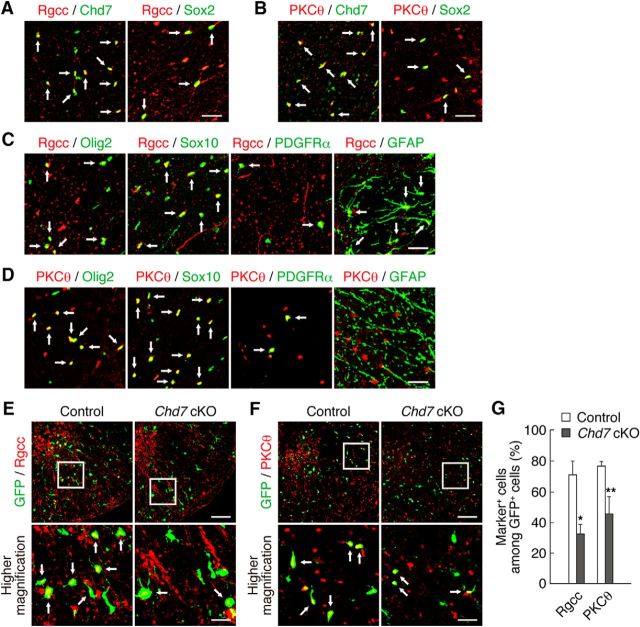
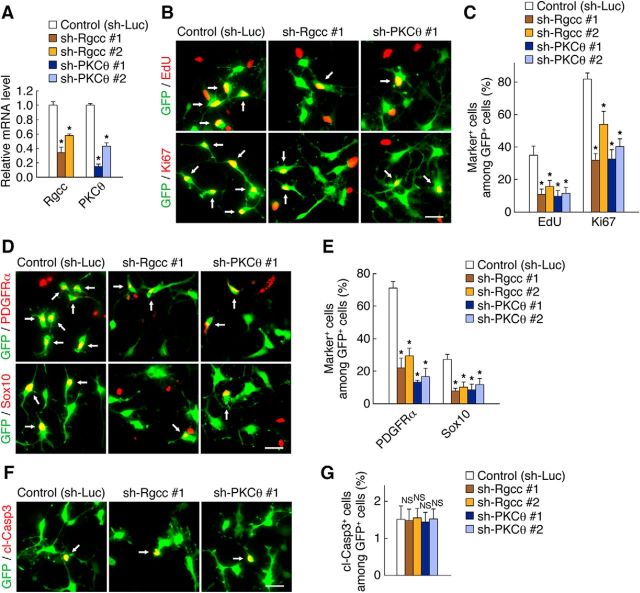
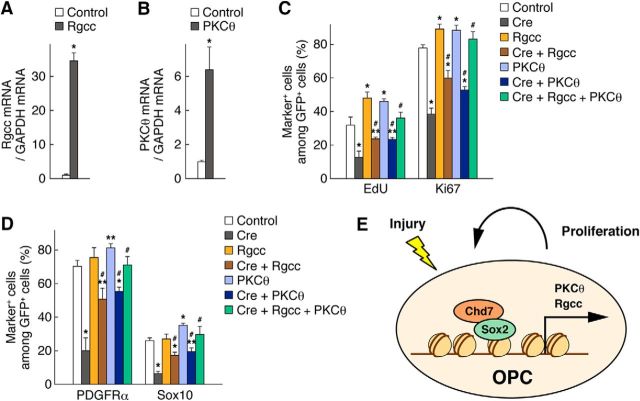
Oligodendrocyte precursor cells (OPCs) act as a reservoir of new oligodendrocytes (OLs) in homeostatic and pathological conditions. OPCs are activated in response to injury to generate myelinating OLs, but the underlying mechanisms remain poorly understood. Here, we show that chromodomain helicase DNA binding protein 7 (Chd7) regulates OPC activation after spinal cord injury (SCI). Chd7 is expressed in OPCs in the adult spinal cord and its expression is upregulated with a concomitant increase in Sox2 expression after SCI. OPC-specific ablation of Chd7 in injured mice leads to reduced OPC proliferation, the loss of OPC identity, and impaired OPC differentiation. Ablation of Chd7 or Sox2 in cultured OPCs shows similar phenotypes to those observed in Chd7 knock-out mice. Chd7 and Sox2 form a complex in OPCs and bind to the promoters or enhancers of the regulator of cell cycle (Rgcc) and protein kinase Cθ (PKCθ) genes, thereby inducing their expression. The expression of Rgcc and PKCθ is reduced in the OPCs of the injured Chd7 knock-out mice. In cultured OPCs, overexpression and knock-down of Rgcc or PKCθ promote and suppress OPC proliferation, respectively. Furthermore, overexpression of both Rgcc and PKCθ rescues the Chd7 deletion phenotypes. Chd7 is thus a key regulator of OPC activation, in which it cooperates with Sox2 and acts via direct induction of Rgcc and PKCθ expression.SIGNIFICANCE STATEMENT Spinal cord injury (SCI) leads to oligodendrocyte (OL) loss and demyelination, along with neuronal death, resulting in impairment of motor or sensory functions. Oligodendrocyte precursor cells (OPCs) activated in response to injury are potential sources of OL replacement and are thought to contribute to remyelination and functional recovery after SCI. However, the molecular mechanisms underlying OPC activation, especially its epigenetic regulation, remain largely unclear. We demonstrate here that the chromatin remodeler chromodomain helicase DNA binding protein 7 (Chd7) regulates the proliferation and identity of OPCs after SCI. We have further identified regulator of cell cycle (Rgcc) and protein kinase Cθ (PKCθ) as novel targets of Chd7 for OPC activation.

Keywords: NG2 cells; chromatin remodeler; oligodendrocyte; oligodendrocyte precursor cell.


Figures

Figure 1.
Figure 1.
Expression of Chd7 and Sox2 in the adult mouse spinal cord and in cultured OPCs. A, Double staining for Chd7 and either Olig2, Sox10, PDGFRα-GFP, Sox2, CC1, or GSTπ in the WM and GM of the spinal cord is shown. B, Quantitation of the percentages of Chd7+ cells among marker-positive cells in A. Data are shown as means ± SD (n = 3–9 slices from 3 animals). C, Chd7+/PDGFRα-GFP+/CC1 cells (arrows) and Chd7+/PDGFRα-GFP/CC1+ cells (arrowheads) in the adult spinal cord. D, Chd7+/GFAP/CC1+ cells (arrows) and Chd7/GFAP+/CC1 cells (arrowheads) in the adult spinal cord. E, OPCs derived from the E15.5 mouse forebrain were cultured with FGF2 and PDGF-AA. Double staining for Chd7 and either Olig2, PDGFRα, NG2, Sox10, or Sox2 in cultured OPCs is shown. F, Chd7low/GFAP+ cells (arrows) and Chd7high/GFAP cells (arrowheads) in cultured OPCs. G, Double staining for Sox2 and either Sox10, PDGFRα-GFP, NG2, CC1, GSTπ, or GFAP in the WM and GM of the spinal cord. H, Triple staining for Chd7, PDGFRα, and Sox2 in the adult spinal cord. I, OPCs were cultured with FGF2 and PDGF-AA. Double staining for Sox2 and either Olig2, Sox10, PDGFRα, or NG2 in cultured OPCs is shown. J, Triple staining for Sox10, PDGFRα, and NFIA in the adult spinal cord. Arrows indicate double-positive (A, E, G, I) and triple-positive (H, J) cells. Scale bars: A, C, D, G, H, J, 50 μm; E, F, I, 25 μm.
Figure 2.
Figure 2.
Expression of Chd7 and Sox2 in OPCs after SCI. A, Schematic diagram of the experimental design for this figure and Figures 3 and 4. Tamoxifen was administered once a day for 5 consecutive days (blue arrows), contusive SCI was performed on the mice 3 d after the last tamoxifen injection (red arrow), and BrdU was injected into the mice at 3 dpi (green arrow). The mice were analyzed at 3 and 42 dpi. BE, The intact and injured (3 dpi) spinal cords of PDGFRα-CreER;CAG-CAT-EGFP mice were isolated and subjected to immunohistofluorescence analysis with antibodies to Ki67, Sox2, and GFP (B) and to Chd7, Sox2, and GFP (D). The percentages of marker-positive cells among total GFP+ cells were determined as means ± SD (n = 9 slices from 3 animals, Ki67: 3 dpi, t(4) = 8.35, p = 0.0010; Sox2: 3 dpi, t(4) = 5.26, p = 0.0060; Chd7: 3 dpi, t(4) = 9.11, p = 0.0010; Chd7/Sox2: 3 dpi, t(4) = 6.79, p = 0.0020; unpaired Student's t test) (C, E). Bottom, Higher-magnification views of the boxed areas in B and D. Arrows indicate triple-positive cells (B, D). *p < 0.01 versus value for intact spinal cord. Scale bars, 100 μm (B, D) and 25 μm (higher-magnification views in B, D).
Figure 3.
Figure 3.
Chd7 is necessary for OPC proliferation after injury and the maintenance of OPC identity. A, Tamoxifen was administered to control (PDGFRα-CreER;Chd7+/+;CAG-CAT-EGFP) and Chd7 cKO (PDGFRα-CreER;Chd7flox/flox;CAG-CAT-EGFP) mice once a day for 5 consecutive days. Three days after the last tamoxifen injection, the spinal cords of control and Chd7 cKO mice were isolated and immunostained for Chd7 and GFP. Arrows and arrowheads indicate Chd7+/GFP+ cells and Chd7/GFP+ cells, respectively. BD, Injured spinal cords of control and Chd7 cKO mice were isolated at 3 dpi and subjected to immunohistofluorescence analysis with antibodies to BrdU and GFP (B) and to Ki67 and GFP (C). The percentages of marker-positive cells among total GFP+ cells were determined as means ± SD (n = 9 slices from 3 animals, BrdU: Chd7 cKO, t(4) = 5.99, p = 0.0040; Ki67: Chd7 cKO, t(4) = 3.40, p = 0.0270; unpaired Student's t test) (D). E, F, Injured spinal cords of control and Chd7 cKO mice were isolated at 3 dpi and immunostained for cleaved caspase 3 (cl-Casp3) and GFP (E). The percentages of cl-Casp3+ cells among total GFP+ cells were determined as means ± SD (n = 9 slices from 3 animals, cl-Casp3: Chd7 cKO, t(4) = 1.23, p = 0.2840; unpaired Student's t test) (F). GI, Injured spinal cords of control and Chd7 cKO mice were isolated at 3 dpi and immunostained for NG2 (G), Sox10 (H), and GFP. The percentages of marker-positive cells among total GFP+ cells were determined as means ± SD (n = 9 slices from 3 animals, NG2: Chd7 cKO, t(4) = 5.51, p = 0.0050; Sox10: Chd7 cKO, t(4) = 12.61, p = 0.0001; unpaired Student's t test) (I). cKO, Conditional knock-out; NS, nonsignificant. Bottom, Higher-magnification views of the boxed areas in AC, E, G, and H. Arrows indicate marker-positive/GFP+ cells (B, C, G, H). *p < 0.01, **p < 0.05 versus corresponding control value. Scale bars, 100 μm (AC, E, G, H) and 25 μm (higher-magnification views in AC, E, G, H).
Figure 4.
Figure 4.
Chd7 is necessary for OPC differentiation into OLs and remyelination after SCI. AC, Injured spinal cords of control and Chd7 cKO mice were isolated at 42 dpi and subjected to immunostaining for GSTπ (A), Sox10 (B), and GFP. The percentages of marker-positive cells among total GFP+ cells were determined as means ± SD (n = 15–20 slices from 3–4 animals, GSTπ: Chd7 cKO, t(5) = 6.70, p = 0.0020; Sox10: Chd7 cKO, t(6) = 4.10, p = 0.0060; unpaired Student's t test) (C). D, E, Intact spinal cords of wild-type mice and the injured (42 dpi) spinal cords of control and Chd7 cKO mice were subjected to FluoroMyelin staining (D). The ratios of FluoroMyelin-positive area to the total section area were quantified as means ± SD (n = 9 slices from 3 animals, FluoroMyelin: Chd7 cKO, t(4) = 3.03, p = 0.0390; unpaired Student's t test) (E). F, G, Injured spinal cords of control and Chd7 cKO mice were isolated at 42 dpi and immunostained for GFAP, Sox10, and GFP (F). The percentages of GFAP+ cells among total GFP+ cells were determined as means ± SD (n = 20 slices from 4 animals, GFAP: Chd7 cKO, t(6) = 2.66, p = 0.0370; unpaired Student's t test) (G). H, Open-field locomotor recovery was assessed using the BMS in control and Chd7 cKO mice for 42 d after SCI. Data are median ± SEM (control: n = 5 animals, Chd7 cKO: n = 6 animals, Chd7 cKO: 28 d, p = 0.0300; 35 d, p = 0.0040; 42 d, p = 0.0090; Mann–Whitney U test). cKO, Conditional knock-out. Bottom, Higher-magnification views of the boxed areas in A and B. Arrows indicate marker-positive/GFP+ cells (A, B). Arrowheads and arrow indicate GFAP/Sox10+/GFP+ cells and GFAP+/Sox10/GFP+ cells, respectively (F). *p < 0.01, **p < 0.05 versus corresponding control value. Scale bars, 100 μm (A, B, D) and 25 μm (F and higher-magnification views in A, B).
Figure 5.
Figure 5.
Chd7 is necessary for OPC proliferation and identity maintenance in the developing and intact adult spinal cord. A, Schematic diagram of the experimental design. Tamoxifen was administered to pregnant dams at E13.5 (blue arrow) and embryos were analyzed at E15.5. BrdU was injected intraperitoneally to pregnant dams 2 h before sampling (green arrow). BF, Spinal cord sections of control and Chd7 cKO mouse embryos were immunostained for BrdU (B), Ki67 (C), PDGFRα, NG2, Sox10 (E), and GFP. The percentages of marker-positive cells among total GFP+ cells were determined as means ± SD (n = 9 slices from 3 animals, BrdU: Chd7 cKO, t(4) = 21.70, p = 0.0001; Ki67: Chd7 cKO, t(4) = 10.79, p = 0.0004; PDGFRα: Chd7 cKO, t(4) = 3.73, p = 0.0202; NG2: Chd7 cKO, t(4) = 4.42, p = 0.0114; Sox10: Chd7 cKO, t(4) = 4.64, p = 0.0097; unpaired Student's t test) (D, F). G, Schematic diagram of the experimental design. Tamoxifen was administered to adult control and Chd7 cKO mice once a day for 5 consecutive days (blue arrows). After tamoxifen treatment, BrdU was administered to the mice via the drinking water (green line) and by intraperitoneal injections for 8 d (green arrows). Two hours after the last BrdU injection, the intact spinal cords of control and Chd7 cKO mice were isolated and immunostained for BrdU (H), Ki67 (I), cleaved caspase 3 (cl-Casp3) (K), NG2, Sox10 (L), GSTπ, GFAP, Sox10 (N), and GFP. The percentages of marker-positive cells among total GFP+ cells were determined as means ± SD (n = 9–12 slices from 3 to 4 animals, BrdU: Chd7 cKO, t(4) = 3.71, p = 0.0206; Ki67: Chd7 cKO, t(4) = 5.18, p = 0.0065; cl-Casp3: Chd7 cKO, t(4) = 0.26, p = 0.8061; NG2: Chd7 cKO, t(6) = 3.01, p = 0.0236; Sox10: Chd7 cKO, t(4) = 9.35, p = 0.0007; GSTπ: Chd7 cKO, t(4) = 6.62, p = 0.0026; GFAP: Chd7 cKO, t(6) = 3.68, p = 0.0102; unpaired Student's t test) (J, K, M, O). cKO, Conditional knock-out; NS, nonsignificant. Bottom, Higher-magnification views of the boxed areas in B and H. Arrows indicate marker-positive/GFP+ cells (B, C, E, H, I, L, and top in N). Arrowheads and arrow indicate GFAP/Sox10+/GFP+ cells and GFAP+/Sox10/GFP+ cells, respectively (bottom in N). *p < 0.01, **p < 0.05 versus corresponding control value. Scale bars, 100 μm (B, H) and 25 μm (C, E, I, L, N and higher-magnification views in B, H).
Figure 6.
Figure 6.
Chd7 is necessary for OPC proliferation, the maintenance of OPC identity, and OL differentiation in vitro. A, B, OPCs derived from Chd7flox/flox mice were infected with retroviruses encoding GFP alone (control) or GFP plus Cre and then cultured with FGF2 and PDGF-AA. Three days after infection, the cells were immunostained for Chd7 and GFP (A). Arrows and arrowheads indicate Chd7+/GFP+ cells and Chd7/GFP+ cells, respectively. The cells were also harvested 3 d after infection and the expression level of Chd7 mRNA was measured by quantitative RT-PCR analysis (B). Data are expressed relative to the control value and are means ± SD (n = 3 experiments, Chd7: Cre, t(4) = 57.32, p = 0.0001; unpaired Student's t test). CH, Chd7flox/flox OPCs infected with retroviruses for control or Cre were cultured with FGF2 and PDGF-AA. Three days after infection, the cells were labeled with EdU for 2 h and were stained for cleaved caspase 3 (cl-Casp3) (C), EdU, Ki67 (E), PDGFRα, Sox10 (G), and GFP. The percentages of marker-positive cells among total GFP+ cells were quantified as means ± SD (n = 3 experiments, cl-Casp3: Cre, t(4) = 0.81, p = 0.462; n = 5 experiments, EdU: Cre, t(8) = 5.77, p = 0.0004; Ki67: Cre, t(8) = 4.99, p = 0.0011; n = 3 experiments, PDGFRα: Cre, t(4) = 23.26, p = 0.0001; Sox10: Cre, t(4) = 12.60, p = 0.0002; unpaired Student's t test) (D, F, H). I, J, Chd7flox/flox OPCs infected with retroviruses for control or Cre were cultured with FGF2 and PDGF-AA. Two days after infection, the cells were induced to differentiate without FGF2 and PDGF-AA, and with T3 for 5 d, after which the cells were immunostained for Sox10, MBP, GFAP, and GFP. The percentages of marker-positive cells among total GFP+ cells were determined as means ± SD (n = 3 experiments, Sox10: Cre, t(4) = 27.05, p = 0.0001; MBP: Cre, t(4) = 12.99, p = 0.0002; GFAP: Cre, t(4) = 7.25, p = 0.0019; unpaired Student's t test). K, Chd7flox/flox OPCs infected with retroviruses for control or CreERT2 were cultured with FGF2 and PDGF-AA. Two days after infection, the cells were induced to differentiate without FGF2 and PDGF-AA and with T3 and treated with 4-OHT 8 h after induction of differentiation. After 5 d, the cells were immunostained for MBP and GFP. The percentages of marker-positive cells among total GFP+ cells were determined as means ± SD (n = 3 experiments, MBP: control + 4-OHT, t(4) = 0.19, p = 0.8563; CreERT2, t(4) = 0.71, p = 0.5144; CreERT2 + 4-OHT, t(4) = 18.83, p = 0.0001; unpaired Student's t test). NS, Nonsignificant. Arrows indicate marker-positive/GFP+ cells (C, E, G, I). *p < 0.01 versus corresponding control value. Scale bars: I, 50 μm; A, C, E, G, 25 μm.
Figure 7.
Figure 7.
Sox2 is necessary for OPC proliferation and identity maintenance in vitro. A, OPCs were infected with retroviruses encoding GFP together with either a control shRNA (sh-Luc) or a Sox2 shRNA (sh-Sox2 #1) and were then cultured with FGF2 and PDGF-AA. Three days after infection, the cells were immunostained for Sox2 and GFP. Arrows and arrowheads indicate Sox2high/GFP+ cells and Sox2low/GFP+ cells, respectively. B, OPCs were infected with retroviruses for control, sh-Sox2 #1, or sh-Sox2 #2. The cells were harvested 3 d after infection and knock-down efficiency of the shRNAs was determined by quantitative RT-PCR analysis. Data are expressed relative to the control value and are means ± SD (n = 3 experiments, Sox2: sh-Sox2 #1, t(4) = 26.19, p = 0.0001; sh-Sox2 #2, t(4) = 25.04, p = 0.0001; unpaired Student's t test). CH, OPCs infected with retroviruses for control, sh-Sox2 #1, or sh-Sox2 #2 were cultured with FGF2 and PDGF-AA. Three days after infection, the cells were labeled with EdU for 2 h and were stained for cleaved caspase 3 (cl-Casp3) (C), EdU, Ki67 (E), PDGFRα, Sox10 (G), and GFP. The percentages of marker-positive cells among total GFP+ cells were quantified as means ± SD (n = 3 experiments, cl-Casp3: sh-Sox2 #1, t(4) = 0.50, p = 0.6399; sh-Sox2 #2, t(4) = 0.06, p = 0.95; EdU: sh-Sox2 #1, t(4) = 8.78, p = 0.0009; sh-Sox2 #2, t(4) = 5.43, p = 0.0056; Ki67: sh-Sox2 #1, t(4) = 8.53, p = 0.0010; sh-Sox2 #2, t(4) = 10.99, p = 0.0004; PDGFRα: sh-Sox2 #1, t(4) = 6.93, p = 0.0023; sh-Sox2 #2, t(4) = 4.73, p = 0.0091; Sox10: sh-Sox2 #1, t(4) = 6.75, p = 0.0025; sh-Sox2 #2, t(4) = 6.15, p = 0.0035; unpaired Student's t test) (D, F, H). IK, OPCs infected with retroviruses for control, Cre, sh-Sox2 #1, or Cre plus sh-Sox2 #1 were cultured with FGF2 and PDGF-AA. Three days after infection, the cells were labeled with EdU for 2 h and were stained for cl-Casp3 (I), EdU, Ki67 (J), PDGFRα, Sox10 (K), and GFP. The percentages of marker-positive cells among total GFP+ cells were quantified as means ± SD (n = 3 experiments, cl-Casp3: Cre, t(4) = 0.40, p = 0.7050; sh-Sox2 #1, t(4) = 0.14, p = 0.8924; Cre + sh-Sox2 #1, t(4) = 0.37, p = 0.7280; EdU: Cre, t(4) = 9.71, p = 0.0006; sh-Sox2 #1, t(4) = 8.30, p = 0.0011; Cre + sh-Sox2 #1, t(4) = 11.36, p = 0.0003; Ki67: Cre, t(4) = 18.18, p = 0.0001; sh-Sox2 #1, t(4) = 24.37, p = 0.0001; Cre + sh-Sox2 #1, t(4) = 11.15, p = 0.0004; PDGFRα: Cre, t(4) = 12.62, p = 0.0002; sh-Sox2 #1, t(4) = 13.12, p = 0.0002; Cre + sh-Sox2 #1, t(4) = 12.19, p = 0.0003; Sox10: Cre, t(4) = 8.83, p = 0.0009; sh-Sox2 #1, t(4) = 10.34, p = 0.0005; Cre + sh-Sox2 #1, t(4) = 12.91, p = 0.0002; unpaired Student's t test). L, 293T cells were transfected with plasmids for Chd7 and Sox2. The cell lysates were subjected to co-immunoprecipitation and Western blot analysis. M, Lysates of OPCs cultured with FGF2 and PDGF-AA were subjected to coimmunoprecipitation and Western blot analysis. N, OPCs cultured with FGF2 and PDGF-AA were subjected to PLA with antibodies to Chd7 and to Sox2, normal rabbit IgG, and normal goat IgG. PLA signals (red) indicate the interaction between Chd7 and Sox2. Cell nuclei were stained with DAPI. NS, Nonsignificant; IP, immunoprecipitation; WCL, whole-cell lysate; Gt, goat; Rb, rabbit. Arrows indicate marker-positive/GFP+ cells (C, E, G). *p < 0.01 versus corresponding control value. Scale bars: A, C, E, G, 25 μm; N, 10 μm.
Figure 8.
Figure 8.
Chd7 regulates the expression of OL-related genes. A, Volcano plot of microarray data showing gene expression changes between control and Chd7 knock-down cells. Red and green dots represent genes significantly upregulated (fold change >1.5, p < 0.05) and downregulated (fold change <0.66, p < 0.05) in Chd7 knock-down cells, respectively. B, Heat map representing the expression of OL-related genes in control and Chd7 knock-down cells from three independent cultures. The color scale represents normalized gene expression levels (red, upregulated expression levels; green, downregulated expression levels). C, OPCs infected with retroviruses for control, sh-Chd7 #1, or sh-Sox2 #1 were cultured with FGF2 and PDGF-AA. The cells were harvested 3 d after infection and the relative mRNA abundance for the indicated proteins was measured by quantitative RT-PCR analysis. Data are shown as means ± SD (n = 3 experiments, PDGFRα: sh-Chd7 #1, t(4) = 14.82, p = 0.0001; sh-Sox2 #1, t(4) = 7.03, p = 0.0021; Myt1: sh-Chd7 #1, t(4) = 12.39, p = 0.0002; sh-Sox2 #1, t(4) = 5.32, p = 0.0060; CSPG4: sh-Chd7 #1, t(4) = 15.18, p = 0.0001; sh-Sox2 #1, t(4) = 12.47, p = 0.0002; Hes5: sh-Chd7 #1, t(4) = 11.40, p = 0.0003; sh-Sox2 #1, t(4) = 11.37, p = 0.0003; Sox9: sh-Chd7 #1, t(4) = 6.01, p = 0.0038; sh-Sox2 #1, t(4) = 2.63, p = 0.0577; Id2: sh-Chd7 #1, t(4) = 15.43, p = 0.0001; sh-Sox2 #1, t(4) = 1.39, p = 0.2346; Sox10: sh-Chd7 #1, t(4) = 26.29, p = 0.0001; sh-Sox2 #1, t(4) = 7.77, p = 0.0015; Olig2: sh-Chd7 #1, t(4) = 5.19, p = 0.0065; sh-Sox2 #1, t(4) = 10.32, p = 0.0005; unpaired Student's t test). NS, Nonsignificant. *p < 0.01 versus control value. D, GO analysis of genes downregulated in Chd7 knock-down cells. The number of genes belonging to each category is shown in parentheses.
Figure 9.
Figure 9.
Rgcc and PKCθ are direct targets of Chd7 and Sox2. A, Heat map representing the expression of Rgcc and PKCθ in control and Chd7 knock-down cells from three independent cultures. The color scale represents normalized gene expression levels (red, upregulated expression levels; green, downregulated expression levels). B, OPCs infected with retroviruses for control, sh-Chd7 #1, or sh-Sox2 #1 were cultured with FGF2 and PDGF-AA. The cells were harvested 3 d after infection and the relative mRNA abundance for Rgcc and PKCθ was measured by quantitative RT-PCR analysis. Data are shown as means ± SD (n = 3 experiments, Rgcc: sh-Chd7 #1, t(4) = 15.66, p = 0.0001; sh-Sox2 #1, t(4) = 3.80, p = 0.0191; PKCθ: sh-Chd7 #1, t(4) = 17.14, p = 0.0001; sh-Sox2 #1, t(4) = 6.43, p = 0.0030; unpaired Student's t test). CH, OPCs cultured with FGF2 and PDGF-AA were subjected to ChIP analysis with antibodies to Chd7, Sox2 (D, G), and H3K27ac (E, H). Six different regions (R1–R6) of the Rgcc gene locus (C) and eight different regions (R1–R8) of the PKCθ gene locus (F) were tested in OPCs. Data are expressed as fold enrichment relative to control IgG. Data are shown as means ± SD (n = 3–6). *p < 0.01, **p < 0.05 versus corresponding control value.
Figure 10.
Figure 10.
Chd7 is necessary for the induction of expression of Rgcc and PKCθ. A, Double staining for Rgcc and either Chd7 or Sox2 in the adult spinal cord. B, Double staining for PKCθ and either Chd7 or Sox2 in the adult spinal cord. C, Double staining for Rgcc and either Olig2, Sox10, PDGFRα-GFP, or GFAP in the adult spinal cord. D, Double staining for PKCθ and either Olig2, Sox10, PDGFRα-GFP, or GFAP in the adult spinal cord. EG, Injured spinal cords of control and Chd7 cKO mice were isolated at 3 dpi and immunostained for Rgcc (E), PKCθ (F), and GFP. The percentages of marker-positive cells among total GFP+ cells were determined as means ± SD (n = 9 slices from 3 animals, Rgcc: Chd7 cKO, t(4) = 6.14, p = 0.0040; PKCθ: Chd7 cKO, t(4) = 4.55, p = 0.0100; unpaired Student's t test) (G). cKO, Conditional knock-out. Bottom, Higher-magnification views of the boxed areas in E and F. Arrows indicate double-positive cells (AF). *p < 0.01, **p < 0.05 versus corresponding control value. Scale bars, 100 μm (E, F), 50 μm (AD), and 25 μm (higher-magnification views in E, F).
Figure 11.
Figure 11.
Rgcc and PKCθ are necessary for OPC proliferation and the maintenance of OPC identity. A, OPCs infected with retroviruses encoding GFP together with either a control shRNA (sh-Luc), an Rgcc shRNA (sh-Rgcc #1 or #2), or a PKCθ shRNA (sh-PKCθ #1 or #2) were cultured with FGF2 and PDGF-AA. Three days after infection, knock-down efficiency of the shRNAs was determined by quantitative RT-PCR analysis. Data are expressed relative to the control value and are means ± SD (n = 3 experiments, Rgcc: sh-Rgcc #1, t(4) = 40.92, p = 0.0001; sh-Rgcc #2, t(4) = 18.26, p = 0.0001; PKCθ: sh-PKCθ #1, t(4) = 12.09, p = 0.0003; sh-PKCθ #2, t(4) = 12.92, p = 0.0002; unpaired Student's t test). BG, OPCs infected with retroviruses for control, sh-Rgcc #1, sh-Rgcc #2, sh-PKCθ #1, or sh-PKCθ #2 were cultured with FGF2 and PDGF-AA. Three days after infection, the cells were labeled with EdU for 2 h and were stained for EdU, Ki67 (B), PDGFRα, Sox10 (D), cleaved caspase 3 (cl-Casp3) (F), and GFP. The percentages of marker-positive cells among total GFP+ cells were quantified as means ± SD (n = 3 experiments, EdU: sh-Rgcc #1, t(4) = 6.33, p = 0.0032; sh-Rgcc #2, t(4) = 4.94, p = 0.0078; sh-PKCθ #1, t(4) = 6.56, p = 0.0028; sh-PKCθ #2, t(4) = 5.98, p = 0.0039; Ki67: sh-Rgcc #1, t(4) = 15.62, p = 0.0001; sh-Rgcc #2, t(4) = 5.29, p = 0.0061; sh-PKCθ #1, t(4) = 12.37, p = 0.0002; sh-PKCθ #2, t(4) = 11.91, p = 0.0003; PDGFRα: sh-Rgcc #1, t(4) = 11.62, p = 0.0003; sh-Rgcc #2, t(4) = 11.59, p = 0.0003; sh-PKCθ #1, t(4) = 24.78, p = 0.0001; sh-PKCθ #2, t(4) = 14.35, p = 0.0001; Sox10: sh-Rgcc #1, t(4) = 9.65, p = 0.0006; sh-Rgcc #2, t(4) = 6.86, p = 0.0024; sh-PKCθ #1, t(4) = 6.97, p = 0.0022; sh-PKCθ #2, t(4) = 5.54, p = 0.0052; cl-Casp3: sh-Rgcc #1, t(4) = 0.10, p = 0.9182; sh-Rgcc #2, t(4) = 0.15, p = 0.8836; sh-PKCθ #1, t(4) = 0.27, p = 0.7983; sh-PKCθ #2, t(4) = 0.03, p = 0.9715; unpaired Student's t test) (C, E, G). NS, Nonsignificant. Arrows indicate marker-positive/GFP+ cells (B, D, F). *p < 0.01 versus corresponding control value. Scale bars, 25 μm (B, D, F).
Figure 12.
Figure 12.
Overexpression of Rgcc or PKCθ rescues the Chd7 deletion phenotypes. A, B, OPCs were infected with retroviruses encoding GFP alone (control), GFP plus Rgcc, or GFP plus PKCθ, and then cultured with FGF2 and PDGF-AA. Three days after infection, the expression level of Rgcc (A) and PKCθ (B) mRNAs was measured by quantitative RT-PCR analysis. Data are expressed relative to the control value and are means ± SD (n = 3 experiments, Rgcc: Rgcc, t(4) = 24.97, p = 0.0001; PKCθ: PKCθ, t(4) = 6.91, p = 0.0023; unpaired Student's t test). C, D, OPCs infected with retroviruses for control, Cre, Rgcc, Cre plus Rgcc, PKCθ, Cre plus PKCθ, or Cre plus Rgcc plus PKCθ were cultured with FGF2 and PDGF-AA. Three days after infection, the cells were labeled with EdU for 2 h and stained for EdU, Ki67 (C), PDGFRα, Sox10 (D), and GFP. The percentages of marker-positive cells among total GFP+ cells were quantified as means ± SD (n = 3 experiments, EdU: Cre, t(4) = 5.38, p = 0.0057; Rgcc, t(4) = 4.62, p = 0.0099; Cre + Rgcc, t(4) = 2.85, p = 0.0460 vs control; t(4) = 4.91, p = 0.0080 vs Cre; PKCθ, t(4) = 4.86, p = 0.0082; Cre + PKCθ, t(4) = 2.94, p = 0.0420 vs control; t(4) = 4.72, p = 0.0091 vs Cre; Cre + Rgcc + PKCθ, t(4) = 1.24, p = 0.2820 vs control; t(4) = 7.86, p = 0.0014 vs Cre; Ki67: Cre, t(4) = 16.63, p = 0.0001; Rgcc, t(4) = 5.66, p = 0.0048; Cre + Rgcc, t(4) = 6.42, p = 0.0030 vs control; t(4) = 6.49, p = 0.0029 vs Cre; PKCθ, t(4) = 5.10, p = 0.0069; Cre + PKCθ, t(4) = 15.84, p = 0.0001 vs control; t(4) = 6.01, p = 0.0038 vs Cre; Cre + Rgcc + PKCθ, t(4) = 1.92, p = 0.1264 vs control; t(4) = 13.52, p = 0.0002 vs Cre; PDGFRα: Cre, t(4) = 10.42, p = 0.0005; Rgcc, t(4) = 1.31, p = 0.2592; Cre + Rgcc, t(4) = 4.58, p = 0.0102 vs control; t(4) = 5.31, p = 0.0060 vs Cre; PKCθ, t(4) = 4.36, p = 0.0120; Cre + PKCθ, t(4) = 6.01, p = 0.0038 vs control; t(4) = 7.65, p = 0.0016 vs Cre; Cre + Rgcc + PKCθ, t(4) = 0.22, p = 0.8335 vs control; t(4) = 9.78, p = 0.0006 vs Cre; Sox10: Cre, t(4) = 16.85, p = 0.0001; Rgcc, t(4) = 0.46, p = 0.6642; Cre + Rgcc, t(4) = 6.10, p = 0.0036 vs control; t(4) = 8.38, p = 0.0011 vs Cre; PKCθ, t(4) = 7.39, p = 0.0018; Cre + PKCθ, t(4) = 4.22, p = 0.0134 vs control; t(4) = 9.41, p = 0.0007 vs Cre; Cre + Rgcc + PKCθ, t(4) = 1.21, p = 0.2926 vs control; t(4) = 8.00, p = 0.0013 vs Cre; unpaired Student's t test) *p < 0.01, **p < 0.05 versus corresponding control value. #p < 0.01 versus Cre value. E, Model for OPC activation by Chd7. In response to injury, the expression level of Chd7 and Sox2 is upregulated in activated OPCs, in which they form a complex and induce directly the expression of PKCθ and Rgcc, which are essential for OPC proliferation and the maintenance of OPC identity.

Similar articles

Cited by

References

    1. Alcantara Llaguno SR, Wang Z, Sun D, Chen J, Xu J, Kim E, Hatanpaa KJ, Raisanen JM, Burns DK, Johnson JE, Parada LF (2015) Adult lineage-restricted CNS progenitors specify distinct glioblastoma subtypes. Cancer Cell 28:429–440. 10.1016/j.ccell.2015.09.007 - DOI - PMC - PubMed
    1. Badea TC, Niculescu FI, Soane L, Shin ML, Rus H (1998) Molecular cloning and characterization of RGC-32, a novel gene induced by complement activation in oligodendrocytes. J Biol Chem 273:26977–26981. 10.1074/jbc.273.41.26977 - DOI - PubMed
    1. Basson MA, van Ravenswaaij-Arts C (2015) Functional insights into chromatin remodelling from studies on CHARGE Syndrome. Trends Genet 31:600–611. 10.1016/j.tig.2015.05.009 - DOI - PMC - PubMed
    1. Berezovsky AD, Poisson LM, Cherba D, Webb CP, Transou AD, Lemke NW, Hong X, Hasselbach LA, Irtenkauf SM, Mikkelsen T, deCarvalho AC (2014) Sox2 promotes malignancy in glioblastoma by regulating plasticity and astrocytic differentiation. Neoplasia 16:193–206, 206.e19–25. 10.1016/j.neo.2014.03.006 - DOI - PMC - PubMed
    1. Bergles DE, Richardson WD (2015) Oligodendrocyte development and plasticity. Cold Spring Harb Perspect Biol 8:a020453. 10.1101/cshperspect.a020453 - DOI - PMC - PubMed

Publication types

MeSH terms