

Testing the time-of-flight model for flagellar length sensing
- PMID: 28931591
- PMCID: PMC5687043
- DOI: 10.1091/mbc.E17-06-0384
Testing the time-of-flight model for flagellar length sensing
Abstract
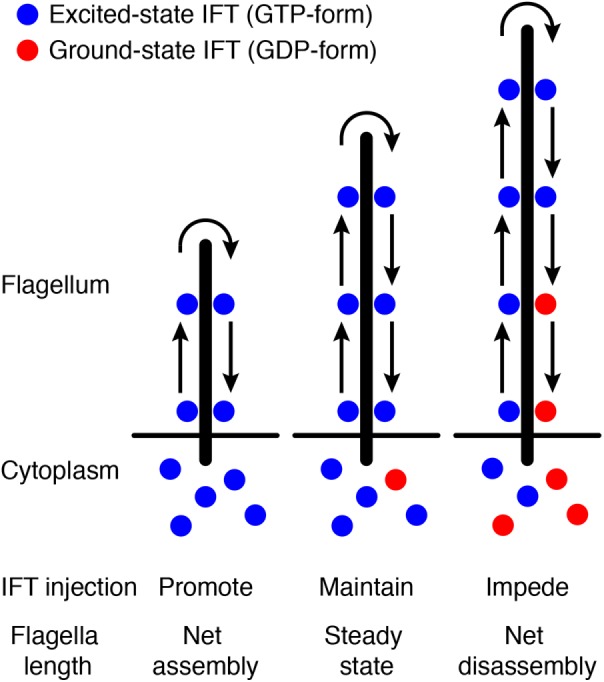
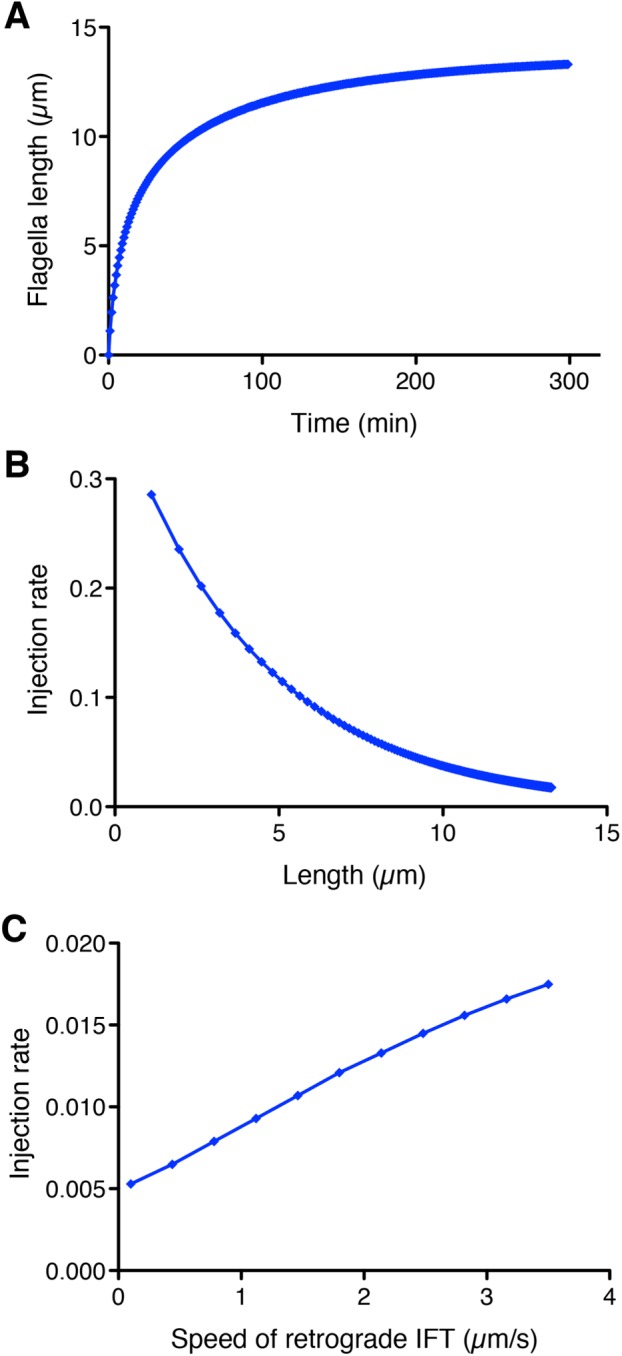
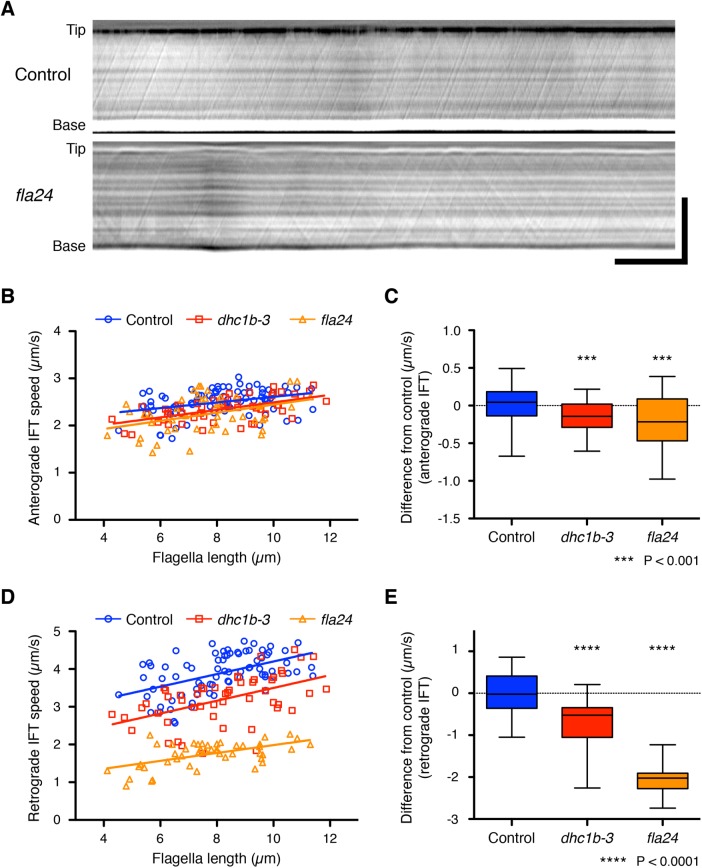
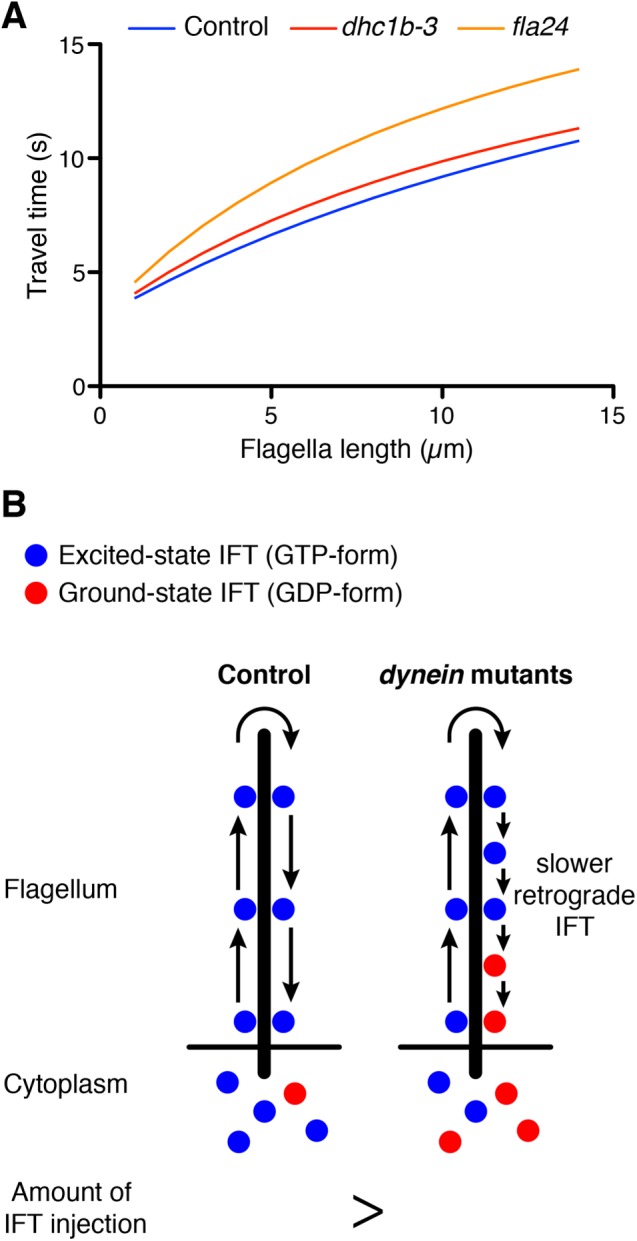
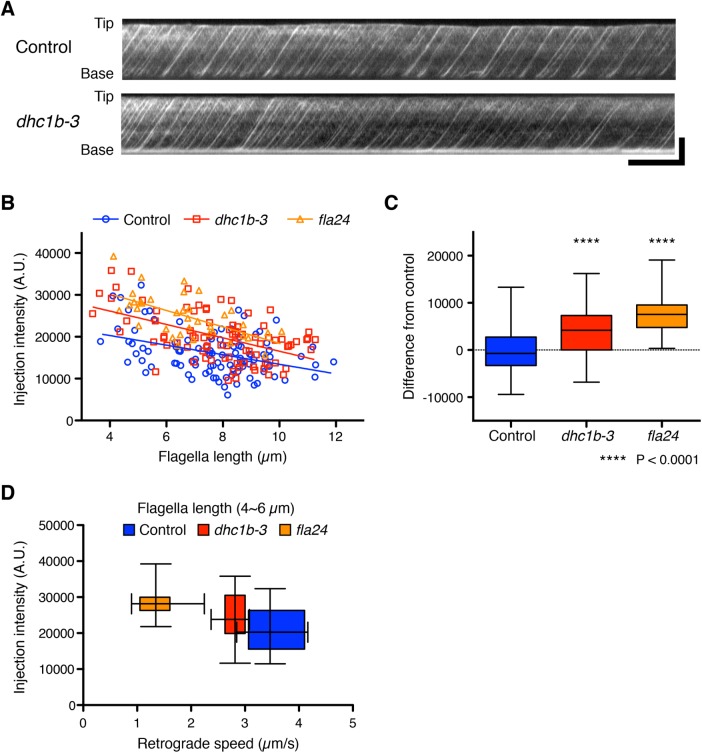
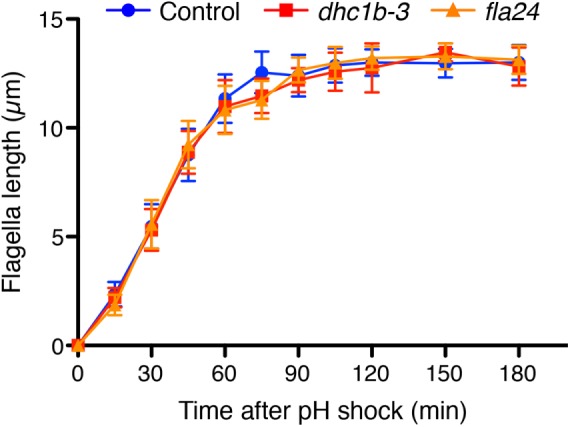
Cilia and flagella are microtubule-based organelles that protrude from the surface of most cells, are important to the sensing of extracellular signals, and make a driving force for fluid flow. Maintenance of flagellar length requires an active transport process known as intraflagellar transport (IFT). Recent studies reveal that the amount of IFT injection negatively correlates with the length of flagella. These observations suggest that a length-dependent feedback regulates IFT. However, it is unknown how cells recognize the length of flagella and control IFT. Several theoretical models try to explain this feedback system. We focused on one of the models, the "time-of-flight" model, which measures the length of flagella on the basis of the travel time of IFT protein in the flagellar compartment. We tested the time-of-flight model using Chlamydomonas dynein mutant cells, which show slower retrograde transport speed. The amount of IFT injection in dynein mutant cells was higher than that in control cells. This observation does not support the prediction of the time-of-flight model and suggests that Chlamydomonas uses another length-control feedback system rather than that described by the time-of-flight model.
© 2017 Ishikawa and Marshall. This article is distributed by The American Society for Cell Biology under license from the author(s). Two months after publication it is available to the public under an Attribution–Noncommercial–Share Alike 3.0 Unported Creative Commons License (http://creativecommons.org/licenses/by-nc-sa/3.0).
Figures
Similar articles
-
Testing the ion-current model for flagellar length sensing and IFT regulation.Elife. 2023 Jan 13;12:e82901. doi: 10.7554/eLife.82901. Elife. 2023. PMID: 36637158 Free PMC article.
-
Intraflagellar transport.Annu Rev Cell Dev Biol. 2003;19:423-43. doi: 10.1146/annurev.cellbio.19.111401.091318. Annu Rev Cell Dev Biol. 2003. PMID: 14570576 Review.
-
The role of the dynein light intermediate chain in retrograde IFT and flagellar function in Chlamydomonas.Mol Biol Cell. 2016 Aug 1;27(15):2404-22. doi: 10.1091/mbc.E16-03-0191. Epub 2016 Jun 1. Mol Biol Cell. 2016. PMID: 27251063 Free PMC article.
-
Dissecting the molecular mechanisms of intraflagellar transport in chlamydomonas.Curr Biol. 2006 Mar 7;16(5):450-9. doi: 10.1016/j.cub.2006.02.020. Curr Biol. 2006. PMID: 16527740
-
Intraflagellar transport motors in cilia: moving along the cell's antenna.J Cell Biol. 2008 Jan 14;180(1):23-9. doi: 10.1083/jcb.200709133. Epub 2008 Jan 7. J Cell Biol. 2008. PMID: 18180368 Free PMC article. Review.
Cited by
-
Chlamydomonas as a model system to study cilia and flagella using genetics, biochemistry, and microscopy.Front Cell Dev Biol. 2024 May 30;12:1412641. doi: 10.3389/fcell.2024.1412641. eCollection 2024. Front Cell Dev Biol. 2024. PMID: 38872931 Free PMC article. Review.
-
Nanobody-directed targeting of optogenetic tools to study signaling in the primary cilium.Elife. 2020 Jun 24;9:e57907. doi: 10.7554/eLife.57907. Elife. 2020. PMID: 32579112 Free PMC article.
-
The flagellar length control system: exploring the physical biology of organelle size.Phys Biol. 2023 Jan 24;20(2):10.1088/1478-3975/acb18d. doi: 10.1088/1478-3975/acb18d. Phys Biol. 2023. PMID: 36623317 Free PMC article. Review.
-
Lithium-induced ciliary lengthening sparks Arp2/3 complex-dependent endocytosis.Mol Biol Cell. 2023 Apr 1;34(4):ar26. doi: 10.1091/mbc.E22-06-0219. Epub 2023 Feb 8. Mol Biol Cell. 2023. PMID: 36753380 Free PMC article.
-
Role of intraflagellar transport in transcriptional control during flagellar regeneration in Chlamydomonas.Mol Biol Cell. 2023 May 15;34(6):ar52. doi: 10.1091/mbc.E22-09-0444. Epub 2022 Dec 21. Mol Biol Cell. 2023. PMID: 36542488 Free PMC article.
References
-
- Bourne HR. GTPases: a family of molecular switches and clocks. Philos Trans R Soc Lond B Biol Sci. 1995;349:283–289. - PubMed
-
- Buisson J, Chenouard N, Lagache T, Blisnick T, Olivo-Marin J-C, Bastin P. Intraflagellar transport proteins cycle between the flagellum and its base. J Cell Sci. 2013;126:327–338. - PubMed
MeSH terms
Substances
Grants and funding
LinkOut - more resources
Full Text Sources
Other Literature Sources
