

Cell-cycle transitions: a common role for stoichiometric inhibitors
- PMID: 28931595
- PMCID: PMC5687042
- DOI: 10.1091/mbc.E17-06-0349
Cell-cycle transitions: a common role for stoichiometric inhibitors
Abstract
The cell division cycle is the process by which eukaryotic cells replicate their chromosomes and partition them to two daughter cells. To maintain the integrity of the genome, proliferating cells must be able to block progression through the division cycle at key transition points (called "checkpoints") if there have been problems in the replication of the chromosomes or their biorientation on the mitotic spindle. These checkpoints are governed by protein-interaction networks, composed of phase-specific cell-cycle activators and inhibitors. Examples include Cdk1:Clb5 and its inhibitor Sic1 at the G1/S checkpoint in budding yeast, APC:Cdc20 and its inhibitor MCC at the mitotic checkpoint, and PP2A:B55 and its inhibitor, alpha-endosulfine, at the mitotic-exit checkpoint. Each of these inhibitors is a substrate as well as a stoichiometric inhibitor of the cell-cycle activator. Because the production of each inhibitor is promoted by a regulatory protein that is itself inhibited by the cell-cycle activator, their interaction network presents a regulatory motif characteristic of a "feedback-amplified domineering substrate" (FADS). We describe how the FADS motif responds to signals in the manner of a bistable toggle switch, and then we discuss how this toggle switch accounts for the abrupt and irreversible nature of three specific cell-cycle checkpoints.
© 2017 Hopkins et al. This article is distributed by The American Society for Cell Biology under license from the author(s). Two months after publication it is available to the public under an Attribution–Noncommercial–Share Alike 3.0 Unported Creative Commons License (http://creativecommons.org/licenses/by-nc-sa/3.0).
Figures
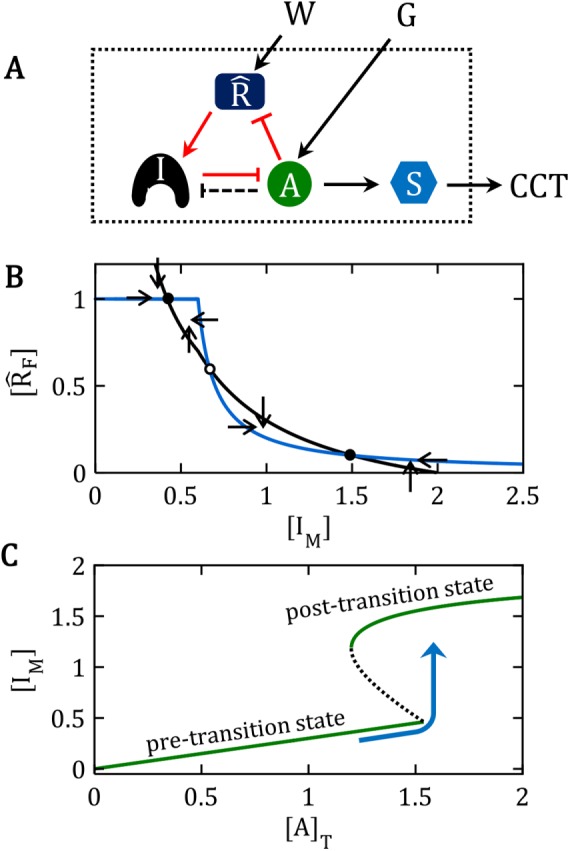
 are locked in a positive-feedback amplification loop (the red interactions), which is responsible for the bistable switching properties of the motif. The double-negative feedback loop between A and I is responsible for the nonlinear activation of A by a mechanism of “stoichiometric inhibitor ultrasensitivity,” as will be described later. The double-negative feedback loop by itself is not capable of generating bistability, which we indicate by using a dashed connector from A to I (A – – –| I). By activating , the “wait” signal (W) holds off the CCT and by driving the production of A, the “go” signal (G) promotes the CCT. The motif as a whole is a “signal processing” system (enclosed in the dotted box), which receives “wait” and “go” signals and determines whether the cell will pass the next cell-cycle transition (a binary decision). (B) Phase plane for the network motif in A. In Supplemental Text S1, we propose a simple mathematical model for the influence diagram in A. In the model, the inhibitor I has three forms: Ifree, Imodified, and A:I complex, with [Ifree] + [Imodified] + [A:I] = [I]total = constant. Similarly, [AF] + [A:I] = [A]T = constant and [F] + [M] = []T = constant, where we have introduced the abbreviations F for “free,” M for “modified,” and T for “total.” The mathematical model is described by a pair of ordinary differential equations for d[IM]/dt and d[F]/dt. In the “phase plane” (the Cartesian coordinate system spanned by [IM] and [F]), we plot the curves (called “nullclines”), where d[IM]/dt = 0 (black curve) and where d[F]/dt = 0 (blue curve), for a particular choice of parameter values (see Supplemental Text S1). The small arrows indicate the directions of the vector field along the nullclines. The nullclines intersect in three places (steady states): two stable steady states (•) separated by an unstable steady state (⚬). (C) Signal–response curve. In the simple mathematical model underlying the phase plane in B, the go-signal is the total concentration of A, and the response variable is the steady-state concentration of IM (thinking of IM as representative of all the substrates modified by A). In this diagram, solid green lines represent stable steady states of the bistable switch, and the black dashed line is the locus of unstable steady states. When the signal is small, 0 < [A]T < 1.5, the concentration of free activator is very small, [AF] ≈ 0, and substrates of the activator are sparsely modified (e.g., [IM]/[I]T < 0.25 in this figure). Hence, the lower branch of green curves represents the pretransition state. When the signal is large, [A]T > 1.2, the concentration of free activator is large, [AF] ≈ [A]T, and substrates of the activator are heavily modified (e.g., [IM]/[I]T > 0.75), which represents the posttransition state. The system is “bistable” for 1.2 < [A]T < 1.5. As [A]T (the go-signal) increases from 0 toward a final value of 2 (blue curve), the system makes an abrupt transition from the pretransition state to the posttransition state at [A]T ≈ 1.5. See Supplemental Text S1 for details of this calculation.
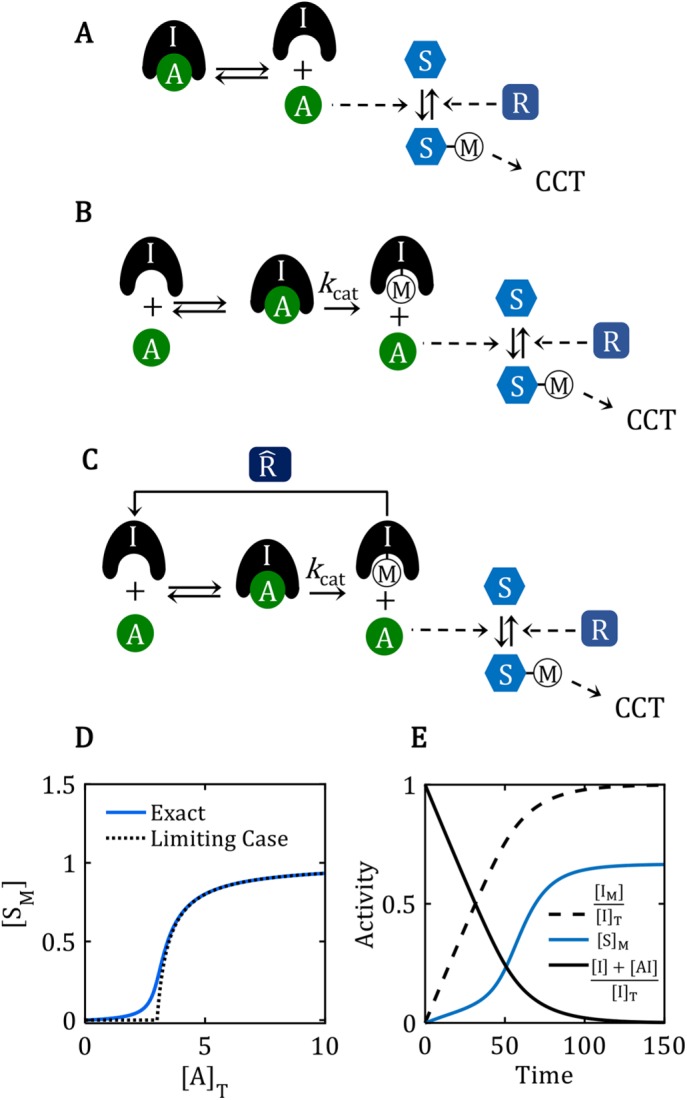 . (D) Ultrasensitive “signal–response” curve for SM as a function of AT, for the reaction mechanism in A. The dashed line is the limiting case of the signal–response curve derived in the main text, for JA = 0.5. The solid curve is the ultrasensitive response curve for realistic values of rate constants, as derived in Supplemental Text S2. (E) For the reaction mechanism in B, I is steadily converted to IM over the course of time, and eventually the beleaguered enzyme A is able to modify its intended substrate (S → SM) and induce the cell-cycle transition. See Supplemental Text S3 for details.
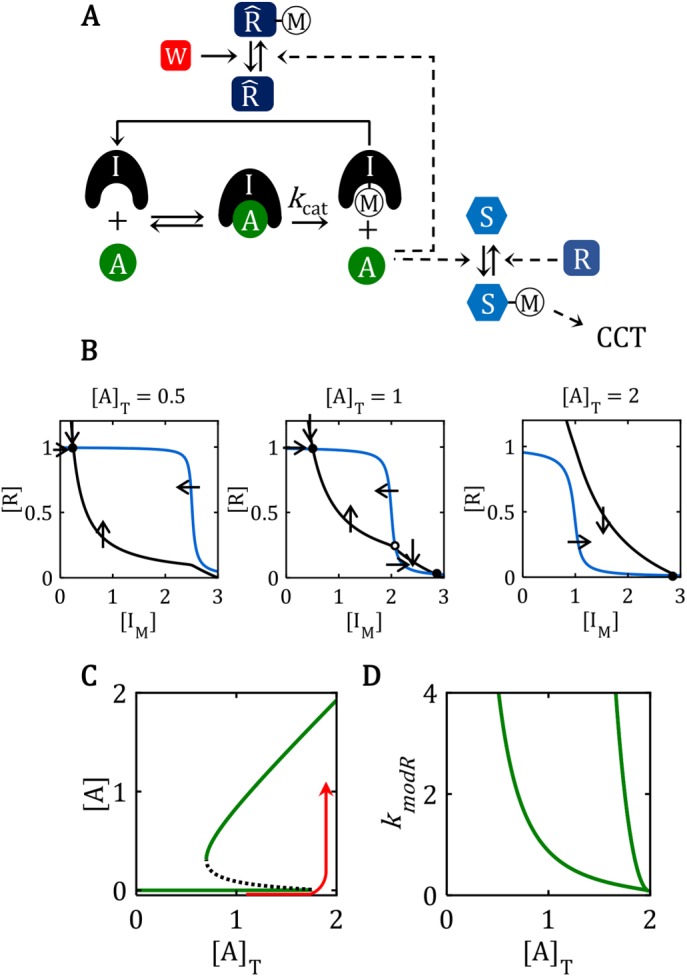 M is a “transition wait” signal. (B) Phase plane diagrams for the bistable switch. For AT = 0.5, there is a unique, stable steady state (•) with F ≈ T = 1, IM ≈ 0.3 << IT = 3, AF ≈ 0. For AT = 2, there is a unique, stable steady state (•) with F ≈ 0, IM ≈ IT = 3, AF ≈ 2. For AT = 1, the network is bistable: there are two stable steady states (•) separated by an unstable steady state (⚬). See Supplemental Text S4 for details of the calculations in B, C, and D. (C) Signal–response curve for a bistable switch. The go-signal is the total concentration of A; the response is the concentration of active (free) A. Solid lines plot the loci of stable steady states as functions of [A]T; dashed line plots the locus of unstable steady states. The network is bistable over the interval 0.70 < [A]T < 1.74. (D) The toggle-switch domain in parameter space. The FADS motif is bistable within the wedge-shaped region bounded by the green curves. [A]T is the go-signal for the cell-cycle transition; kmodR is the rate constant for the modification of by A. For kmodR = 0, the positive feedback amplification loop is broken, and the FADS motif is mono-stable.
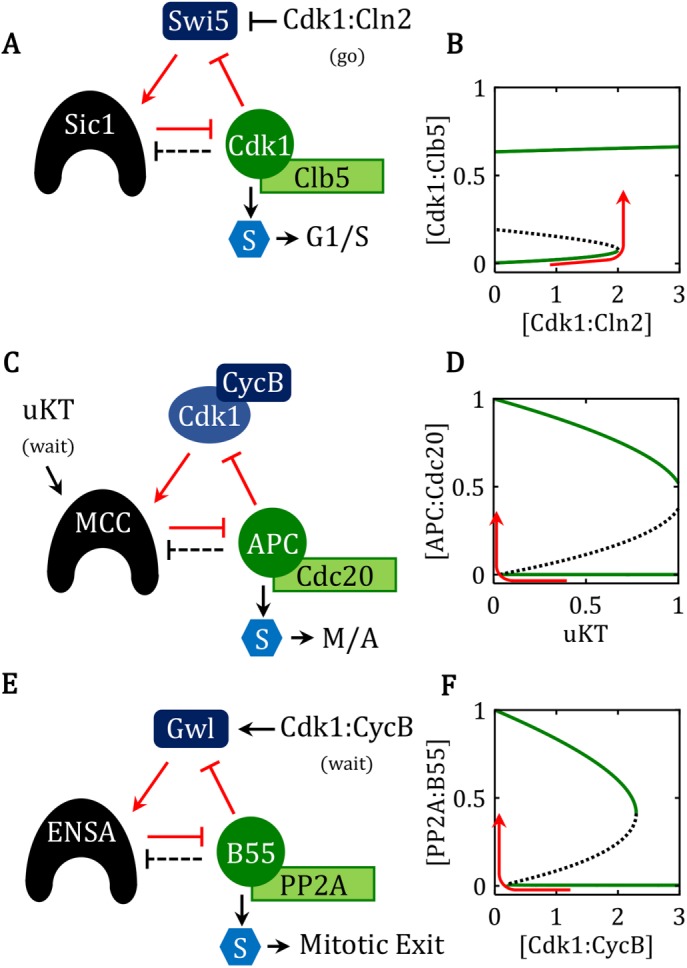
Similar articles
-
Mitotic exit in two dimensions.J Theor Biol. 2007 Oct 7;248(3):560-73. doi: 10.1016/j.jtbi.2007.06.014. Epub 2007 Jun 17. J Theor Biol. 2007. PMID: 17659305
-
Sic1 as a timer of Clb cyclin waves in the yeast cell cycle--design principle of not just an inhibitor.FEBS J. 2012 Sep;279(18):3386-410. doi: 10.1111/j.1742-4658.2012.08542.x. Epub 2012 Mar 21. FEBS J. 2012. PMID: 22356687 Review.
-
APC-dependent proteolysis of the mitotic cyclin Clb2 is essential for mitotic exit.Nature. 2002 Aug 1;418(6897):556-62. doi: 10.1038/nature00856. Nature. 2002. PMID: 12152084
-
Cdk and APC activities limit the spindle-stabilizing function of Fin1 to anaphase.Nat Cell Biol. 2007 Jan;9(1):106-12. doi: 10.1038/ncb1523. Epub 2006 Dec 17. Nat Cell Biol. 2007. PMID: 17173039
-
The Multiple Roles of the Cdc14 Phosphatase in Cell Cycle Control.Int J Mol Sci. 2020 Jan 21;21(3):709. doi: 10.3390/ijms21030709. Int J Mol Sci. 2020. PMID: 31973188 Free PMC article. Review.
Cited by
-
Bistable, Biphasic Regulation of PP2A-B55 Accounts for the Dynamics of Mitotic Substrate Phosphorylation.Curr Biol. 2021 Feb 22;31(4):794-808.e6. doi: 10.1016/j.cub.2020.11.058. Epub 2020 Dec 22. Curr Biol. 2021. PMID: 33357450 Free PMC article.
-
Newton's cradle: Cell cycle regulation by two mutually inhibitory oscillators.Math Biosci. 2024 Nov;377:109291. doi: 10.1016/j.mbs.2024.109291. Epub 2024 Sep 4. Math Biosci. 2024. PMID: 39241924 Free PMC article.
-
MicroRNA governs bistable cell differentiation and lineage segregation via a noncanonical feedback.Mol Syst Biol. 2021 Apr;17(4):e9945. doi: 10.15252/msb.20209945. Mol Syst Biol. 2021. PMID: 33890404 Free PMC article.
-
From biological data to oscillator models using SINDy.iScience. 2024 Feb 23;27(4):109316. doi: 10.1016/j.isci.2024.109316. eCollection 2024 Apr 19. iScience. 2024. PMID: 38523784 Free PMC article.
-
Deep learning-driven imaging of cell division and cell growth across an entire eukaryotic life cycle.bioRxiv [Preprint]. 2024 Apr 27:2024.04.25.591211. doi: 10.1101/2024.04.25.591211. bioRxiv. 2024. Update in: Mol Biol Cell. 2025 Jun 1;36(6):ar74. doi: 10.1091/mbc.E25-01-0009. PMID: 38712227 Free PMC article. Updated. Preprint.
References
-
- Barr FA, Elliott PR, Gruneberg U. Protein phosphatases and the regulation of mitosis. J Cell Sci. 2011;124:2323–2334. - PubMed
-
- Bosl WJ, Li R. Mitotic-exit control as an evolved complex system. Cell. 2005;121:325–333. - PubMed
-
- Cherry JL, Adler FR. How to make a biological switch. J Theor Biol. 2000;203:117–133. - PubMed
MeSH terms
Substances
Grants and funding
LinkOut - more resources
Full Text Sources
Other Literature Sources
Molecular Biology Databases
Miscellaneous
