. 2017 Nov 7;28(23):3181-3192.
doi: 10.1091/mbc.E17-06-0425. Epub 2017 Sep 20.

Nonrandom γ-TuNA-dependent spatial pattern of microtubule nucleation at the Golgi

Affiliations

Nonrandom γ-TuNA-dependent spatial pattern of microtubule nucleation at the Golgi

Anna A W M Sanders et al. Mol Biol Cell. .

Abstract

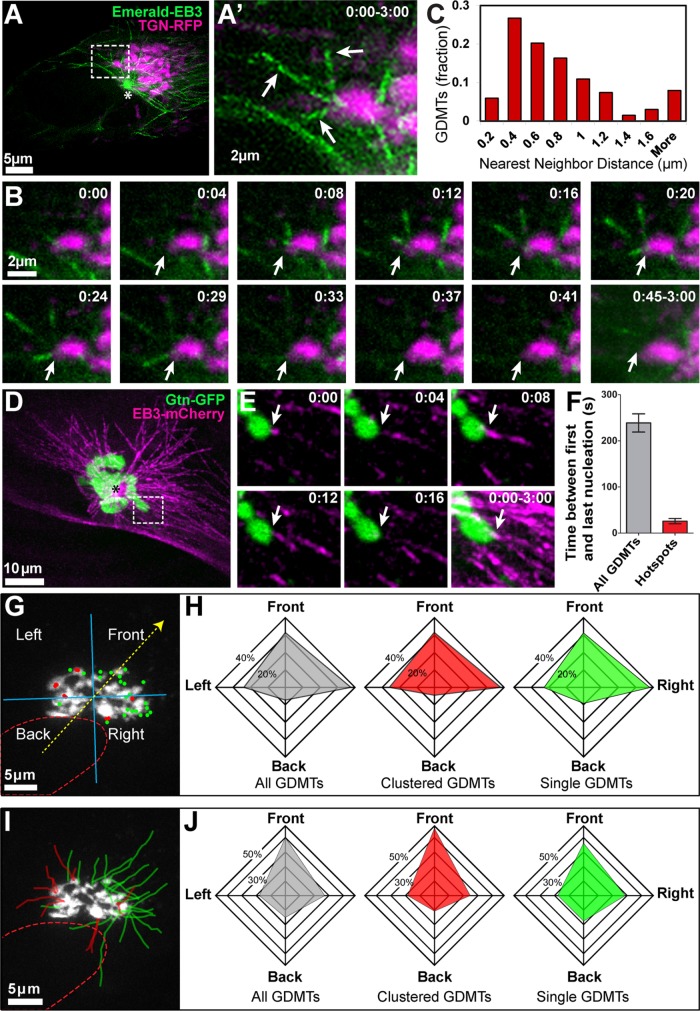
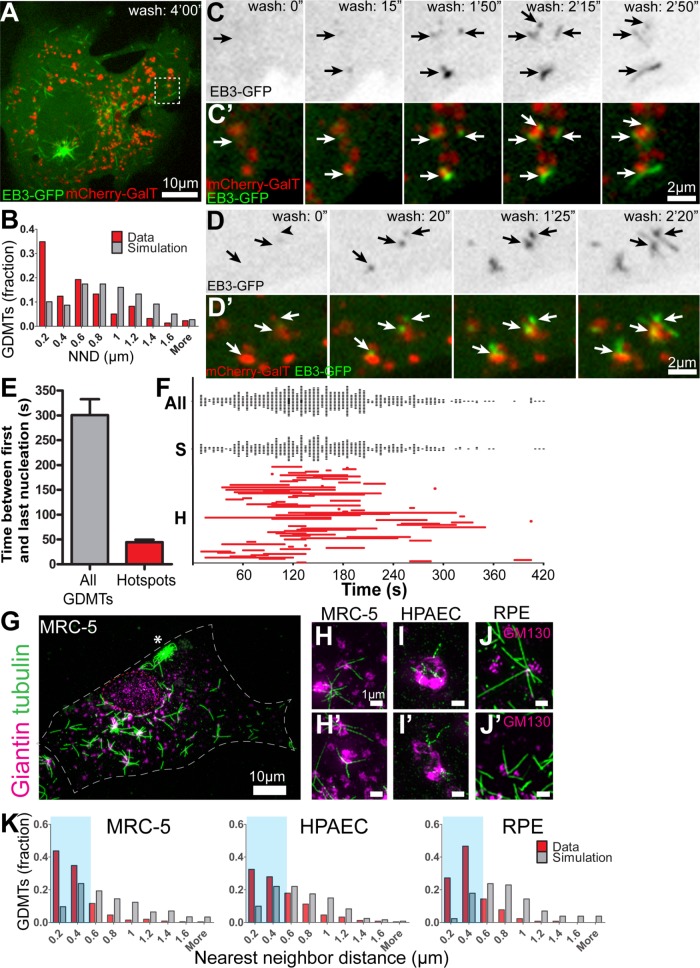
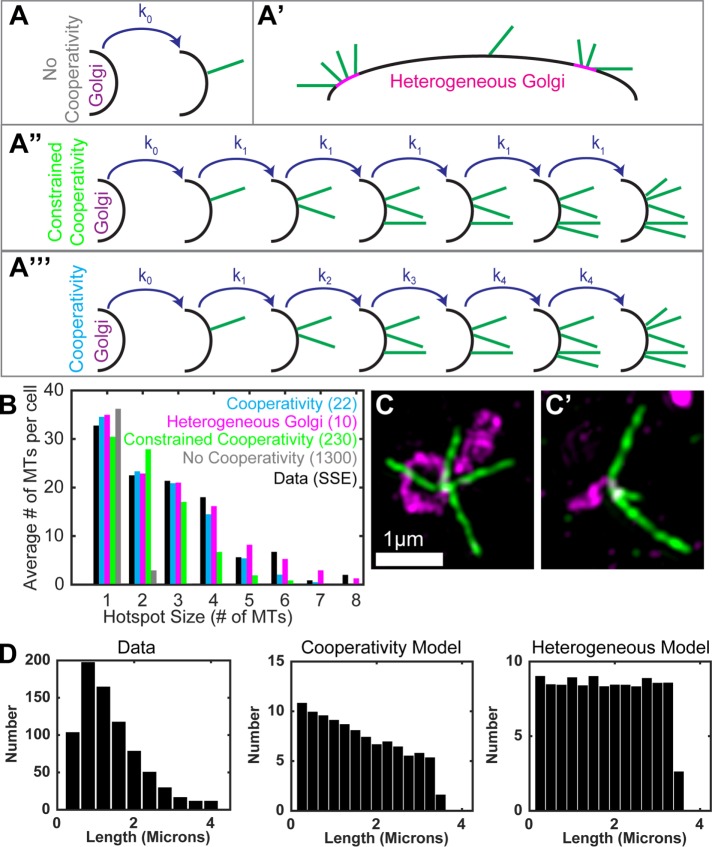
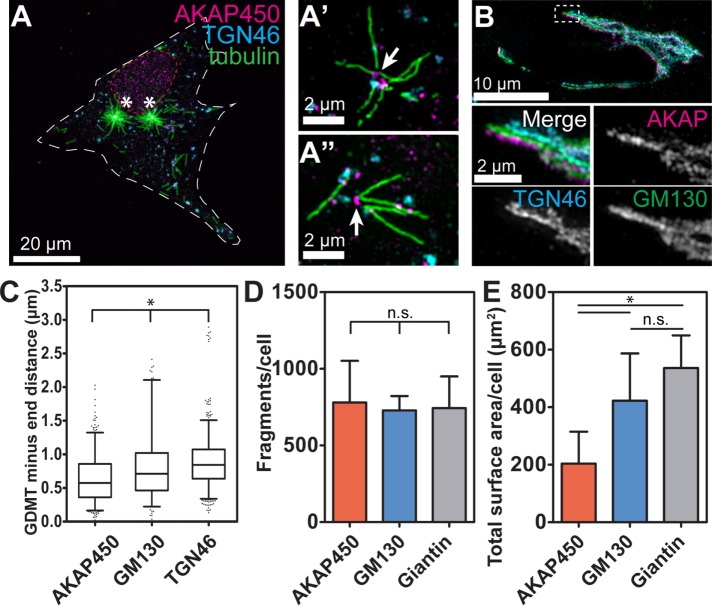
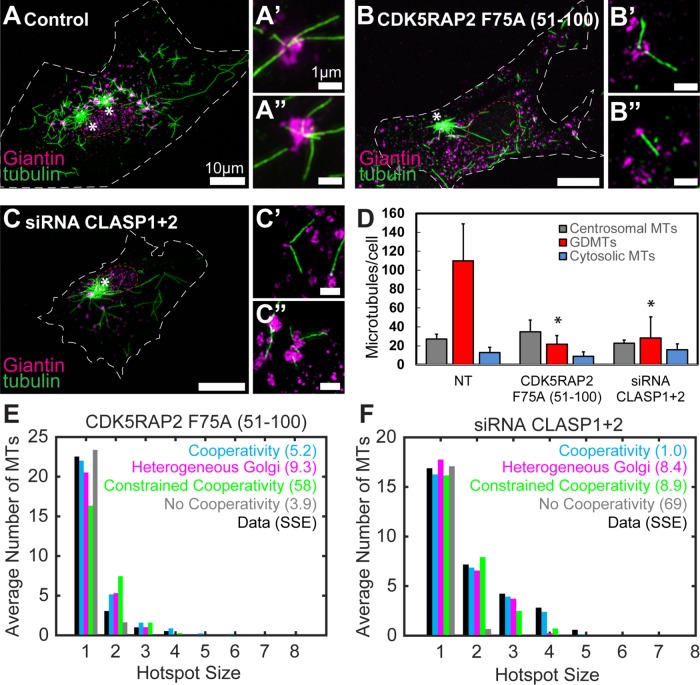
Noncentrosomal microtubule (MT) nucleation at the Golgi generates MT network asymmetry in motile vertebrate cells. Investigating the Golgi-derived MT (GDMT) distribution, we find that MT asymmetry arises from nonrandom nucleation sites at the Golgi (hotspots). Using computational simulations, we propose two plausible mechanistic models of GDMT nucleation leading to this phenotype. In the "cooperativity" model, formation of a single GDMT promotes further nucleation at the same site. In the "heterogeneous Golgi" model, MT nucleation is dramatically up-regulated at discrete and sparse locations within the Golgi. While MT clustering in hotspots is equally well described by both models, simulating MT length distributions within the cooperativity model fits the data better. Investigating the molecular mechanism underlying hotspot formation, we have found that hotspots are significantly smaller than a Golgi subdomain positive for scaffolding protein AKAP450, which is thought to recruit GDMT nucleation factors. We have further probed potential roles of known GDMT-promoting molecules, including γ-TuRC-mediated nucleation activator (γ-TuNA) domain-containing proteins and MT stabilizer CLASPs. While both γ-TuNA inhibition and lack of CLASPs resulted in drastically decreased GDMT nucleation, computational modeling revealed that only γ-TuNA inhibition suppressed hotspot formation. We conclude that hotspots require γ-TuNA activity, which facilitates clustered GDMT nucleation at distinct Golgi sites.


Figures

FIGURE 1:
FIGURE 1:
Microtubules are nucleated at specific sites within the Golgi ribbon. (A) An RPE1 cell expressing Emerald-EB3 (green, MT +TIP marker) and TGN-RFP (magenta, Golgi marker). A maximum-intensity projection of a confocal spinning disk microscopy sequence over a 3-min period and Z thickness 3 μm is shown (A, A′). Inset in A is enlarged in A′, showing newly formed GDMTs formed at the same site (arrows). (B) Single–time point maximum-intensity Z-projections from A′ show that clustered GDMTs (arrows) form within a short period of time. Arrows: clustered GDMTs; asterisks: centrosomal MTs. Time, minutes:seconds. Emerald-EB3 (green), TGN-RFP (magenta). (C) Quantification of nearest-neighbor distance between GDMT nucleation sites, based on 3D live-time imaging as in A and B. (D) MRC-5 cells expressing EB3-mCherry (magenta, MT +TIP marker) and GTN-GFP (green, Golgi marker). Maximum-intensity projection as described in A is shown. (E) Single–time point maximum-intensity projections are shown as described in B. Arrows: clustered GDMTs. Time, minutes:seconds. EB3-mCherry (magenta), GTN-GFP (green). (F) Time between GDMT nucleation events. Average time between first and last GDMT nucleation events was calculated over a 5-min period and within hotspots (GDMT nucleation events within 0.4 µm of each other). Error bars; SD. (p < 0.001, Student’s t test, n = 10 cells and 30 hotspots). (G) Distribution of GDMT nucleation sites on the Golgi, depicted over a maximum-intensity Z-projection of the TGN-RFP signal as a Golgi marker (white). The nucleus–Golgi axis was used to determine cell polarity (yellow dotted arrow) and four quadrants were generated to categorize nucleation site placement into four quadrants according to this axis (blue cross). Dots indicate GDMT nucleation events observed over a period of 3 min. Red dots: clustered GDMT nucleation events <0.4 µm apart. Green dots: single GDMT nucleation events. Red dotted line: nucleus. (H) Distribution of GDMT nucleation sites on the Golgi relative to cell polarity axis. Polarity quadrants were determined as in G. Front- or side-oriented nucleation sites occur more often than back-oriented nucleation sites (p < 0.001, χ2 test, n = 10 cells). (I, J) Distribution of GDMT directionality. (I) GDMT tracks were generated using the MTrackJ plugin for Image. Red tracks denote clustered GDMTs (nucleation sites <0.4 µm apart); green tracks are single GDMTs. (J) Relative distribution of GDMT directionality. For each GDMT track (as in I), the blue cross denoting the four quadrants (generated as in G) was centered at the nucleation site and MT directionality was determined. Front- or side-oriented directionality was more prevalent than back-oriented directionality (p < 0.05, χ2 test, n = 10 cells).
FIGURE 2:
FIGURE 2:
GDMT nucleation is spatially restricted to distinct hotspots. (A) An RPE1 cell expressing EB3-GFP (green) and mCherry-GalT (red, Golgi marker) 4 min after nocodazole washout. Single-plane confocal spinning disk microscopy. Insets are shown over time in C, C′, D, and D′. Asterisk: centrosomal MTs. (B) Newly formed GDMTs are distributed nonrandomly on Golgi fragments following nocodazole washout. Nearest-neighbor distances of GDMT minus ends were calculated for each fragment associated with multiple GDMTs. A paired random data set was generated using Matlab (p < 0.001, Student’s t test, n = 9 cells). Based on data as in A, C, and D. (C, D) Examples of simultaneous multiple GDMT nucleation events (arrows) at Golgi fragments following nocodazole washout. Frames from a time-lapse image sequence. (C, D) EB3-GFP, inverted grayscale image. (C′, D′) EB3-GFP (green) and mCherry-GalT (red, Golgi marker). Time from the start of the movie, minutes:seconds. (E) Time between GDMT nucleation events. Average time between first and last GDMT nucleation event was calculated over a 7-min period and within hotspots (GDMT nucleation events within 0.4 µm of each other). Error bars: SD. (p < 0.001, Student’s t test, n = 9 cells and 76 hotspots.) (F) Distribution of GDMT nucleation events and hotspot duration over time. GDMT nucleation events are plotted over a 7-min period, based on data from E. All GDMTs (All) and single GDMT nucleation events are plotted as single data points. Duration of hotspots (H) is plotted from first to last nucleation event within each hotspot. All, all GDMTs; S, single GDMT nucleation events; H, hotspots. (G–J) Examples of GDMT clustering in different cell types 40 s after nocodazole washout. Immunofluorescence. (G) An MRC-5 cell laser scanning confocal microscopy overview image (maximum-intensity Z-projection; see also Supplementary Figure S1, A–C, for other cell types). Tubulin, green. Giantin, magenta. (H–J′) SIM image maximum-intensity projections. Tubulin, green. GM130, magenta. Note GDMTs clusters extending from a Golgi fragment in each cell type. (K) Distribution of nearest-neighbor distances between GDMT minus end positions on Golgi fragments producing multiple GDMTs. A paired random data set was generated using Matlab. (p < 0.001, Student’s t test, n = 8-–10 cells per cell type.)
FIGURE 3:
FIGURE 3:
Two potential mechanistic models underlying GDMT nucleation hotspot formation. (A) Schematic representation of the four models to be compared against data. (A) No cooperativity: GDMTs are randomly nucleated. (A′) Heterogeneous Golgi: Small, focal subdomains of the Golgi membrane have increased MT nucleation capability. (A″) Constrained cooperativity: GDMT hotspots promote nucleation of additional GDMTs, independent of number of GDMTs at the hotspot (hotspot size-independent). (A′″) Cooperativity: GDMT hotspots promote nucleation of additional GDMTs at the same site, dependent on number of MTs at the hotspot (hotspot size-dependent). (B) Comparison of best-fit results for each model against data. The vertical axis quantifies the total number of GDMTs contained within hotspots of each size, averaged over the eight cells imaged (100 cells simulated in the case of model results). Sum of squared errors (SSE) between the data and model distributions indicates the quality of fit for each model. (C) Examples of hotspots with GDMTs of similar (C) or varying (C′) length in MRC-5 cells 40 s after nocodazole washout. SIM image maximum intensity projections. Tubulin, green; Giantin, magenta. (D) Comparison of simulated microtubule length distributions against data.
FIGURE 4:
FIGURE 4:
AKAP450 is not sufficient for restriction of GDMT nucleation to hotspots. (A–A″) Localization of GDMT nucleation sites and AKAP450 in an MRC-5 cell 40 s after nocodazole washout. (A) A laser scanning confocal microscopy overview image (maximum-intensity Z-projection). Immunostaining. Tubulin, green. TGN46, cyan. AKAP450, magenta. (A′, A″) SIM image maximum intensity projections. Tubulin, green. TGN46, cyan. AKAP450, magenta. Note that GDMT ends always colocalize with AKAP450. (B) MRC-5 cell expressing GM130-GFP (green) and immunostained for AKAP450 (magenta) and TGN46 (cyan). Note that AKAP450 localizes to a subdomain of the Golgi. SIM, maximum-intensity Z-projection. (C) GDMT minus ends are concentrated closer to AKAP450 positive structures than to GM130-positive or TGN46-positive structures in MRC-5 cells. Distance between GDMT minus ends and centers of mass of AKAP450, GM130, and TGN46 was measured and plotted in 5-95% boxplot. (p < 0.001, one-way ANOVA and Tukey’s multiple comparison test; n = 8–16 cells for each protein.) (D) Total numbers of Golgi fragments positive for AKAP450, GM130, or Giantin are comparable following nocodazole washout in MRC-5 cells. (p = 0.87, one-way ANOVA, n = 8 cells for each protein.) (E) Surface area of AKAP450-positive structures following nocodazole washout in MRC-5 cells is significantly smaller than that of GM130- or Giantin-positive Golgi structures. (p < 0.001 one-way ANOVA, with Tukey’s multiple comparison test showing significant differences between AKAP450- and GM130- or Giantin-positive structures, but not between GM130- and Giantin-positive structures [p = 0.13]; n = 8 cells for each protein.)
FIGURE 5:
FIGURE 5:
γ-TuNA inhibition, but not depletion of CLASPs, leads to loss of GDMT nucleation hotspots. (A–C) Control (A), expressing CDK5RAP2 F75A (51–100, B), or CLASP1+2-depleted (C) MRC-5 cells 40 s after nocodazole washout. Immunofluorescence. (A, B, C) Laser scanning confocal microscopy overview images (maximum intensity Z-projection). Immunostaining. Tubulin, green. Giantin, magenta. (A′, A″, B′, B″, C′, C″) SIM image maximum intensity projections. Tubulin, green. Giantin, magenta. Note decrease of GDMTs in B and C as compared with A. (D) GDMT levels, but not centrosomal or cytosolic MTs, were significantly reduced in MRC-5 cells expressing CDK5RAP2 F75A (51–100) or CLASP1+2 depleted. (p < 0.001, one-way ANOVA, with Tukey’s multiple comparison test showing significant differences between nontreated and CDK5RAP2 F75A-expressing cells or CLASP1+2–depleted cells, but not between CDK5RAP2 F75A-expressing cells and CLASP1+2–depleted cells [p = 0.32], n = 8–16 cells per condition.) (E) Comparison of best-fit results for each model against data (averaged over 15 cells) from MRC-5 cells expressing CDK5RAP2 F75A (51–100). (F) Comparison of best-fit results for each model against data (averaged over 16 cells) from MRC-5 cells depleted of CLASP1+2.

Similar articles

Cited by

References

    1. Alfaro-Aco R, Thawani A, Petry S. Structural analysis of the role of TPX2 in branching microtubule nucleation. J Cell Biol. 2017;216:983–997. - PMC - PubMed
    1. Bauer M, Cubizolles F, Schmidt A, Nigg EA. Quantitative analysis of human centrosome architecture by targeted proteomics and fluorescence imaging. EMBO J. 2016;35:2152–2166. - PMC - PubMed
    1. Bellouze S, Schäfer MK, Buttigieg D, Baillat G, Rabouille C, Haase G. Golgi fragmentation in pmn mice is due to a defective ARF1/TBCE cross-talk that coordinates COPI vesicle formation and tubulin polymerization. Hum Mol Genet. 2014;23:5961–5975. - PubMed
    1. Chabin-Brion K, Marceiller J, Perez F, Settegrana C, Drechou A, Durand G, Poüs C. The Golgi complex is a microtubule-organizing organelle. Mol Biol Cell. 2001;12:2047–2060. - PMC - PubMed
    1. Choi Y-KK, Liu P, Sze SK, Dai C, Qi RZ. CDK5RAP2 stimulates microtubule nucleation by the gamma-tubulin ring complex. J Cell Biol. 2010;191:1089–1095. - PMC - PubMed

LinkOut - more resources