

Differential context-specific impact of individual core promoter elements on transcriptional dynamics
- PMID: 28931597
- PMCID: PMC5687036
- DOI: 10.1091/mbc.E17-06-0408
Differential context-specific impact of individual core promoter elements on transcriptional dynamics
Abstract
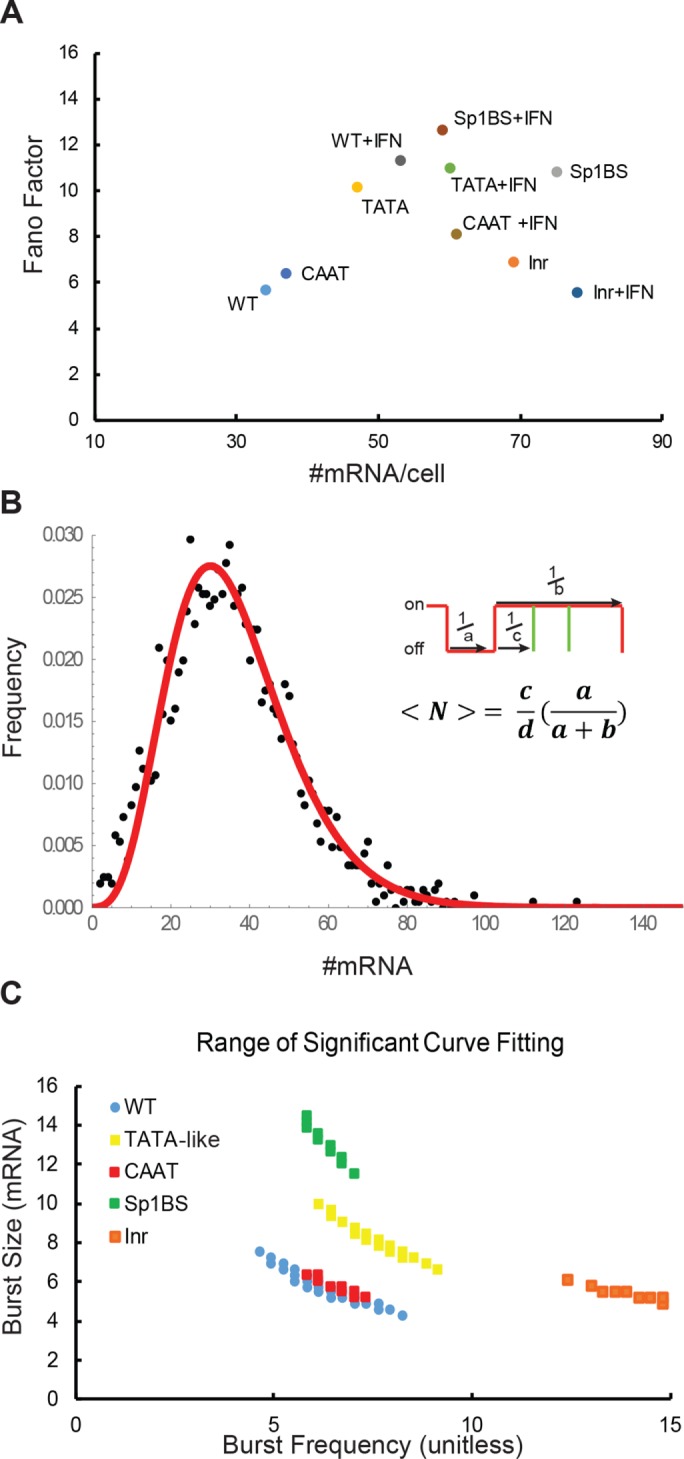
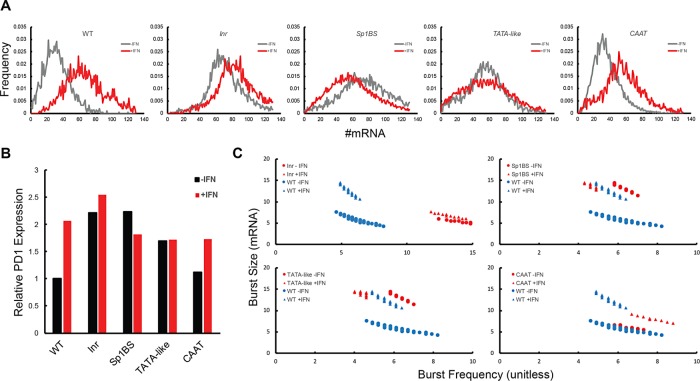
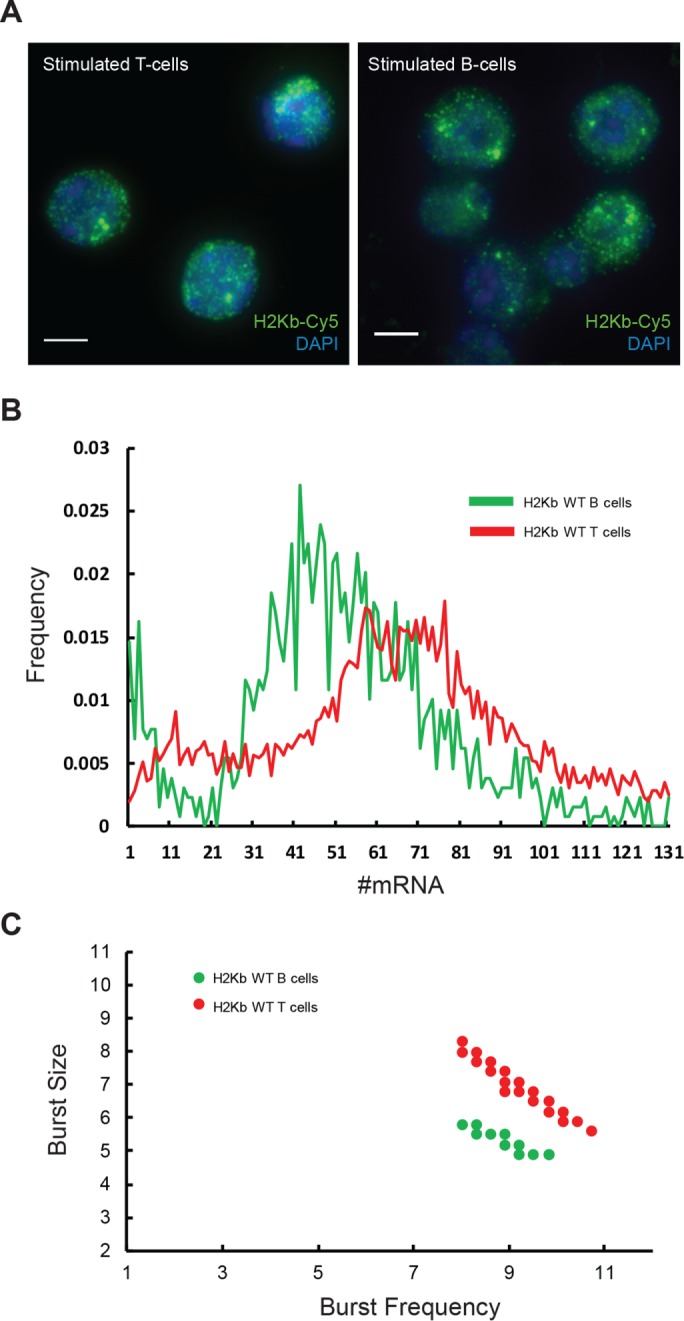
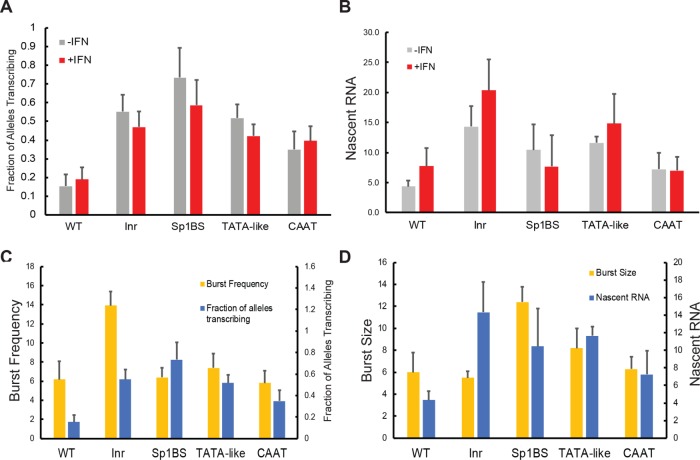
Eukaryotic transcription occurs in bursts that vary in size and frequency, but the contribution of individual core promoter elements to transcriptional bursting is not known. Here we analyze the relative contributions to bursting of the individual core promoter elements-CCAAT, TATAA-like, Sp1BS, and Inr-of an MHC class I gene in primary B-cells during both basal and activated transcription. The TATAA-like, Sp1BS, and Inr elements all function as negative regulators of transcription, and each was found to contribute differentially to the overall bursting pattern of the promoter during basal transcription. Whereas the Sp1BS element regulates burst size, the Inr element regulates burst frequency. The TATAA-like element contributes to both. Surprisingly, each element has a distinct role in bursting during transcriptional activation by γ-interferon. The CCAAT element does not contribute significantly to the constitutive transcriptional dynamics of primary B-cells, but modulates both burst size and frequency in response to γ-interferon activation. The ability of core promoter elements to modulate transcriptional bursting individually allows combinatorial fine-tuning of the level of MHC class I gene expression in response to intrinsic and extrinsic signals.
© 2017 Hendy et al. This article is distributed by The American Society for Cell Biology under license from the author(s). Two months after publication it is available to the public under an Attribution–Noncommercial–Share Alike 3.0 Unported Creative Commons License (http://creativecommons.org/licenses/by-nc-sa/3.0).
Figures
Similar articles
-
Major histocompatibility complex class I core promoter elements are not essential for transcription in vivo.Mol Cell Biol. 2013 Nov;33(22):4395-407. doi: 10.1128/MCB.00553-13. Epub 2013 Sep 9. Mol Cell Biol. 2013. PMID: 24019072 Free PMC article.
-
IFN-gamma regulation of the type IV class II transactivator promoter in astrocytes.J Immunol. 1999 Apr 15;162(8):4731-9. J Immunol. 1999. PMID: 10202014
-
Varying functions of specific major histocompatibility class II transactivator promoter III and IV elements in melanoma cell lines.Cell Growth Differ. 2001 Jun;12(6):327-35. Cell Growth Differ. 2001. PMID: 11432807
-
What shapes eukaryotic transcriptional bursting?Mol Biosyst. 2017 Jun 27;13(7):1280-1290. doi: 10.1039/c7mb00154a. Mol Biosyst. 2017. PMID: 28573295 Review.
-
Emerging themes in neuronal activity-dependent gene expression.Mol Cell Neurosci. 2018 Mar;87:27-34. doi: 10.1016/j.mcn.2017.11.009. Epub 2017 Dec 15. Mol Cell Neurosci. 2018. PMID: 29254824 Free PMC article. Review.
Cited by
-
Regulation of RNA polymerase II transcription through re-initiation and bursting.Mol Cell. 2025 May 15;85(10):1907-1919. doi: 10.1016/j.molcel.2025.04.011. Mol Cell. 2025. PMID: 40378829 Review.
-
Global chromatin accessibility profiling analysis reveals a chronic activation state in aged muscle stem cells.iScience. 2022 Aug 17;25(9):104954. doi: 10.1016/j.isci.2022.104954. eCollection 2022 Sep 16. iScience. 2022. PMID: 36093058 Free PMC article.
-
Identification of molecular determinants of gene-specific bursting patterns by high-throughput imaging screens.Mol Cell. 2025 Mar 6;85(5):913-928.e8. doi: 10.1016/j.molcel.2025.01.022. Epub 2025 Feb 19. Mol Cell. 2025. PMID: 39978338
-
Multimodal transcriptional control of pattern formation in embryonic development.Proc Natl Acad Sci U S A. 2020 Jan 14;117(2):836-847. doi: 10.1073/pnas.1912500117. Epub 2019 Dec 27. Proc Natl Acad Sci U S A. 2020. PMID: 31882445 Free PMC article.
-
Buffering and Amplifying Transcriptional Noise During Cell Fate Specification.Front Genet. 2018 Nov 29;9:591. doi: 10.3389/fgene.2018.00591. eCollection 2018. Front Genet. 2018. PMID: 30555516 Free PMC article. Review.
References
-
- Battich N, Stoeger T, Pelkmans L. Control of transcript variability in single mammalian cells. Cell. 2015;163:1596–1610. - PubMed
-
- Blake WJ, Balazsi G, Kohanski MA, Isaacs FJ, Murphy KF, Kuang Y, Cantor C, Walt DR, Collins JJ. Phenotypic consequences of promoter-mediated transcriptional noise. Mol Cell. 2006;24:853–865. - PubMed
MeSH terms
Substances
LinkOut - more resources
Full Text Sources
Other Literature Sources
Research Materials
