. 2017 Nov 7;28(23):3333-3348.
doi: 10.1091/mbc.E17-06-0393. Epub 2017 Sep 20.

Coordinated increase of nuclear tension and lamin-A with matrix stiffness outcompetes lamin-B receptor that favors soft tissue phenotypes

Affiliations

Coordinated increase of nuclear tension and lamin-A with matrix stiffness outcompetes lamin-B receptor that favors soft tissue phenotypes

Amnon Buxboim et al. Mol Biol Cell. .

Abstract

Matrix stiffness that is sensed by a cell or measured by a purely physical probe reflects the intrinsic elasticity of the matrix and also how thick or thin the matrix is. Here, mesenchymal stem cells (MSCs) and their nuclei spread in response to thickness-corrected matrix microelasticity, with increases in nuclear tension and nuclear stiffness resulting from increases in myosin-II and lamin-A,C. Linearity between the widely varying projected area of a cell and its nucleus across many matrices, timescales, and myosin-II activity levels indicates a constant ratio of nucleus-to-cell volume, despite MSCs' lineage plasticity. Nuclear envelope fluctuations are suppressed on the stiffest matrices, and fluctuation spectra reveal a high nuclear tension that matches trends from traction force microscopy and from increased lamin-A,C. Transcriptomes of many diverse tissues and MSCs further show that lamin-A,C's increase with tissue or matrix stiffness anti-correlates with lamin-B receptor (LBR), which contributes to lipid/sterol biosynthesis. Adipogenesis (a soft lineage) indeed increases LBR:lamin-A,C protein stoichiometry in MSCs versus osteogenesis (stiff). The two factors compete for lamin-B in response to matrix elasticity, knockdown, myosin-II inhibition, and even constricted migration that disrupts and segregates lamins in situ. Matrix stiffness-driven contractility thus tenses the nucleus to favor lamin-A,C accumulation and suppress soft tissue phenotypes.


Figures

FIGURE 1:
FIGURE 1:
Cells feel many microns into soft microenvironments. (A) (i) Mesenchymal stem cells (MSCs) and their nuclei are spread more on gels that are soft-and-thin (1 kPa; 2–3 μm) compared to soft-and-thick (∼35 μm) at 24–36 h in culture (scale bars = 10 μm). Bottom, x-z contours of lamina from confocal stacks of immunostained lamin-A,C. Nuclear height (average ± SEM; n > 25) is maximal on thick and soft gels but nuclei become increasingly flattened on thin-and-soft gels (p = 0.006) and rigid glass (p < 0.001). (ii) Mean projected areas of nuclei and cells vs. matrix thickness. Hill function exponents are α = 0.8 and 15 for 1 and 10 kPa gels, respectively. Tactile length scales are defined as the thickness below which cells or nuclei spread more than a measurable 10% relative to cells on thick gels of the same E: ht ≈ 25 μm for 1 kPa, ht ≈ 15 μm for 10 kPa, and ht ≈ 0 μm for 40 kPa, making the latter indistinguishable from collagen-coated glass (i.e., “rigid”). Blebbistatin (Blebb) inhibits myosin-II and eliminates spreading differences on different matrices. (iii) Linearity of cell vs. nucleus projected area is maintained across matrices of different elasticities and thicknesses and is also satisfied by Blebb-treated myosin-inhibited cells. Inset images of x-z cross sections show spread cell height is constrained by nuclear height. (B) Cell vs. nuclear spreading kinetics on rigid glass (red) tracks the “steady-state” projected area of cells on diverse gels (blue) or with myosin-II inhibition by Blebb (green). (C) The dynamics of cell adhesion and spreading were interrogated by AFM (top) and immunostaining (bottom) to show organization of protein of interests with z-axis topography. MSCs were cultured in a standard cell-culture plastic plate and fixed at times ranging between 1 h and 1 d. To facilitate AFM imaging, cells were lipid-membrane stripped and air dried before immunostaining. With adhesion time, cells increasingly spread, and nuclei stretch and flatten down against the substrate and prominent stress fibers developed, consistent with increased generation of contractile forces. At 1 h, cells maintain a spherical morphology and stress fibers are radially distributed (yellow arrowheads, zoom-in images) with a wide lamellipodium structure (red arrowheads) but after 4 h of adhesion symmetry is broken and within 24 h cells obtain a typical mesenchymal-like morphology typical of stiff matrices. Unlike the immunofluorescence (IF) images, AFM micrographs are in scale (scale bar: 10 µm). z-Axis heights measured by AFM is an underestimate, due to fixing, membrane-stripping, and dehydration of the cells. (D) A simple Hill-type model of cell spreading in which myosin-II rectifies F-actin polymerization depending on the resistance provided by matrix elasticity.
FIGURE 2:
FIGURE 2:
The apparent microelasticity sensed by a cell on thin or thick gels is similar in trend to that measured by an inanimate probe. (A)(i) AFM force-indentation representative curves show a sharp deflection of the cantilever on gels that are soft (1 kPa) but thin. Gel contact points are at the origin. (ii) Apparent microelasticity (μ-elasticity) of polyacrylamide gels, as measured by AFM nanoindentation, is plotted as a function of the elastic modulus (bulk stiffness calibrated by desktop rheometer) and thickness. While AFM nanoindentation of thick gels shows agreement with gels’ elastic moduli, μ-elasticity increases with decreasing gel height, exhibiting effective stiffening at the micron scale most profoundly for soft gels. (B) As the spreading of cells (i) and the projected area of nuclei (ii) are distinctively shown to increase with gels’ stiffness and thinness (Figure 1Aii and Supplemental Figure S1B), we plot them here as a function of the apparent matrix μ-elasticity. Cell and nucleus data (average ± SEM, n > 25 cells) are collectively fit to formula image
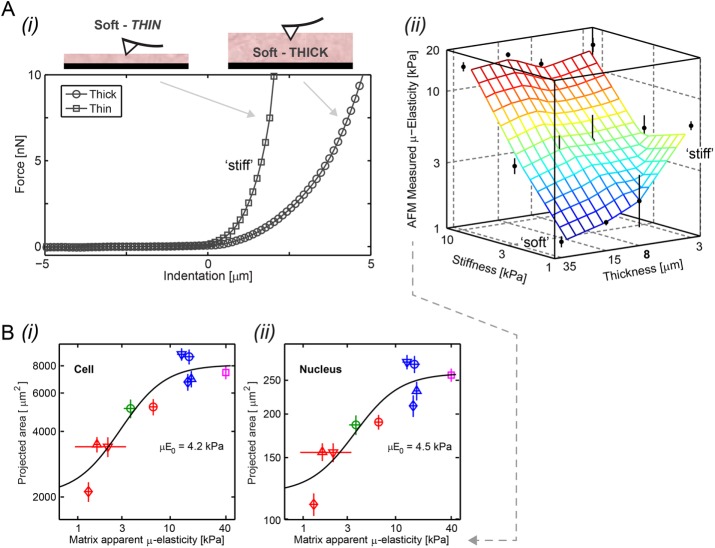
, with an exponent of cooperativity n = 0.5. The transition between soft and stiff matrices is set by Eµ, amounting to 4–4.5 kPa, thus discriminating between compliant tissues such as brain, marrow, and fat and stiffer tissues such as muscle, cartilage, and bone.
FIGURE 3:
FIGURE 3:
Nuclear roughness is suppressed by matrix stiffness, yielding an estimate of increased nuclear tension. (A) Nanoscopic imaging by atomic force microscopy (AFM) of a membrane-stripped but hydrated MSC shows apical stress fibers that flatten the nucleus against the matrix (red arrow). Nucleus-draped fibers quantified by AFM and by immunofluorescence of myosin-IIA increase in number with adhesion time. (Bi) Lamin-A,C immunostained MSCs imaged by confocal fluorescence microscopy have apical and basal contours of the nuclear envelope that exhibit larger wrinkles on soft gels (0.3 kPa) than on rigid substrates (average ± SEM, n > 25 cells). (ii) The amplitude of nuclear wrinkles is quantified by Fourier-transformed spectra U(q) vs. spatial wave number q. Averaged across apical and basal profiles of all nuclei and smoothed, U(q) decreases as ∼1/q with a prefactor related to nuclear stress σ based on wrinkled membrane theory (i.e., 1/σ1/2). (C) Traction force microscopy (Engler et al., 2006) indicates an increase in nuclear stress σ in cells on soft gels vs. stiff gels (average ± SEM, n > 10 cells) that is similar to that estimated from wrinkled membrane theory.
FIGURE 4:
FIGURE 4:
Transcript profiles reveal mechano-responsive nucleo-structural genes. (A) Nuclear envelope schematic and variations in transcript levels. Consistent with matrix-directed morphologies of nuclei, heatmaps of MSCs cultured (for 36 h) on soft-and-thin gels correlate best with cultures on rigid plastic: Dendrogram shows a Pearson correlation p = 0.9. Absolute gene expression intensities averaged across matrix conditions are color-coded by gene symbols (e.g., MYH9 is high, LMNA is intermediate, SYNE2 is very low). Second heatmap: Knockdown of lamin-A produces a low contractility MSC phenotype with down-regulation of MYH9 relative to nontreated (NT) or scrambled siRNA (SC). Third heatmap: Hematopoietic stem cells and progenitors (HSCPs) likewise exhibit a low contractility phenotype with low MYH9 levels correlating with LMNA. In all heatmaps, LBR is anti-correlated. Fourth heatmap: Technical noise across triplicate hybridizations on three microarrays is <4% on average and no greater than 7% STD of mean intensity. Bottommost “housekeeping” genes validate intensity (n = 3 unless indicated). (B) Whole-genome transcriptome changes as indicated after LMNA knockdown. (C) Four mechano-malleable nuclear envelope genes (LMNA, SYNE1, SYNE2, and LBR) exhibit maximal transcriptional variation (STD normalized by mean) across matrix elasticity and thickness conditions in MSC cultures (left) and also in mouse and human tissues (right) of various stiffnesses (brain, liver, kidney, skeletal muscle, heart). For the latter, the species with the least variation provides the highest confidence for comparison. As indicated by the text color of the gene names, the top four nuclear envelope components are expressed at moderate to high levels, whereas similar genes such as the B-type lamins show little variation. (D) Consistent with the anti-correlation in MSC cultures, LBR transcript levels decrease with LMNA for the stiffest mouse and human tissues. Consistent with the noted correlation in MSC cultures, the most abundant myosin-II (e.g., MYH9) is positively correlated with LMNA. LBR/LMNA fits a Hill function for inhibition with exponent n = 5.5. Myosin-II isoform switching and muscle specialization are evident in skeletal (MYH1,2) and cardiac (MYH6,7) muscle, which are more than twofold above the trend for nonmuscle MYH9 that fits a Mechanobiological Gene Circuit Systems model (Buxboim et al., 2014). Consistent with tissue stiffness trends, brain (ectodermal tissue: green) is softer than liver (endodermal: blue), which is softer than muscle (mesoderm: red), and LMNA levels increase (n = 3 per tissue).
FIGURE 5:
FIGURE 5:
Adipogenesis of MSCs and LBR, osteogenesis and lamin-A,C, and enhanced osteogenesis with thin gels. (A)(i) As part of the canonical MSC differentiation capacity, osteogenically induced cells are highly spread with mature stress fibers and flattened nucleus and adipogenically induced cells exhibit cytoplasmic lipid droplets that are associated with LBR. (ii) Adipogenesis and osteogenesis were induced by respectively supplemented media within 2 wk in culture. Oil-red-O positive lipid vacuoles and alkaline phosphatase (ALP) activity, as assayed by blue RR-salt staining, confirm adipogenic and osteogenic differentiation capacity (bottom). (B) Bright-field (BF) and immunofluorescence (IF) images of lamin-A,C and LBR with F-actin staining (phalloidin). Adipogenically differentiated cells clearly show lipid droplets in association with LBR staining (yellow framed zoomed-in). (C) Consistent with “relaxed” vs. “contractile” cellular phenotypes, lamin-A,C is low and LBR is high and nucleus projected area is small in adipogenically induced cells (average ± SEM, n > 25 cells). (D) Enhanced osteogenesis, as shown by increased ALP activity staining, is observed in cells that were cultured on soft gels that are also thin after 1 wk in basal media and 5 d of induction.
FIGURE 6:
FIGURE 6:
Expression profiles of lamin-A,C, myosin-IIA, and LBR are consistent with cell mechanosensitivity. (A) Lamin-A,C levels increase with matrix µ-elasticity (for low passage MSCs, P2), as shown by single cell immunofluorescence at 36 h (i) and also by immunoblot normalized to HSP90AB1 housekeeping levels (ii) after 5 h of cell adhesion. (B) Myosin-IIA levels also increase with matrix µ-elasticity, unless inhibited by Blebb (i) or by knockdown (ii: siMIIA), which suppress lamin-A,C on soft and stiff gels. (C) MSCs transduced with GFP-lamin-A were knocked down for lamin-A,C and cultured on soft-and-thick (0.3 kPa), soft-and-thin (2–3 μm), or stiff (40 kPa) gels for 36 h, and then fixed and immunostained. High lamin-A,C–expressing cells show diffuse cytoplasmic LBR (green frames; image contrast is readjusted to show cytoplasmic pool); low lamin-A,C–expressing cells show nucleus-localized LBR (red frames). (D) Overexpression and knockdown allow lamin-A,C levels to be controlled independent of matrix. (i) Nucleus projected area increases with the lamin-A,C level on a given matrix but is greatest on stiff matrices at any given lamin-A,C level. Hyperbolic fits of form formula image 
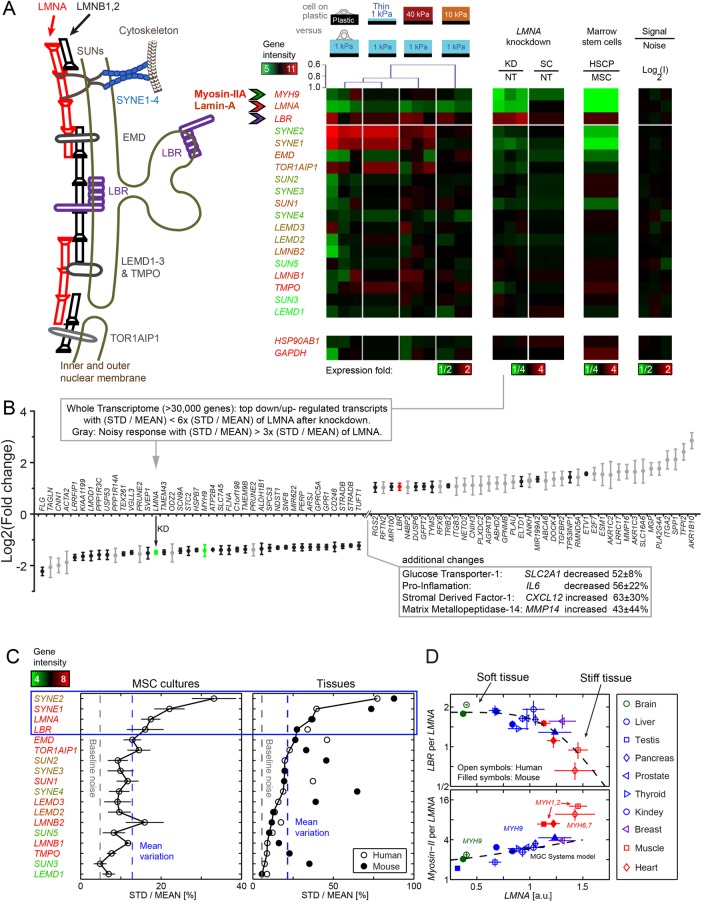
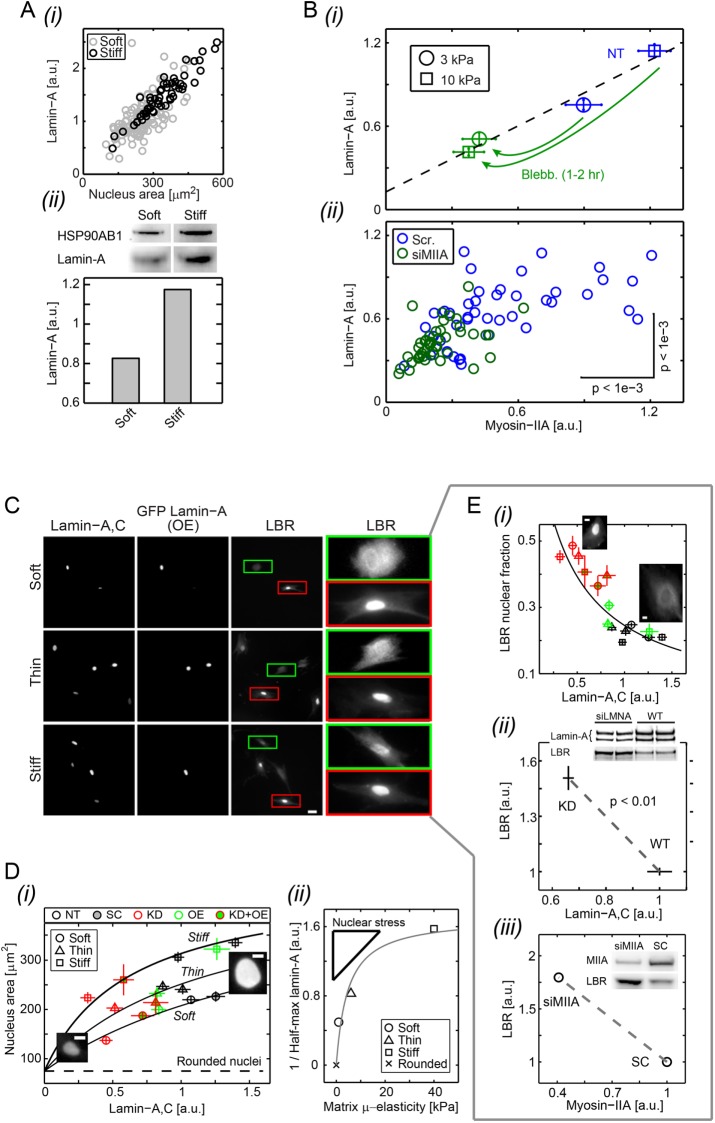
intersect at x = 0, which corresponds to the projected area of rounded nuclei in cells in suspension. (ii) As A0 and β are the same across matrix fits and K is the lamin-A,C level for half-maximum nuclear stretching, 1/K relates to nuclear stress σ and increases with matrix μ-elasticity. (Ei) LBR nuclear fraction is anti-correlated with lamin-A,C across the various matrix conditions (legend in panel Di), and fits a competitive binding model. Overall protein levels of LBR are enhanced by knockdown of either lamin-A,C (i, siLMNA) or myosin-IIA (iii, siMIIA). Cell extract volumes were calibrated using Bradford total protein assay (i) or based on the immunoblotting intensities of HSP90AB1 housekeeping protein (ii). Average ± SEM, n > 25 cells. Scale bars = 10 µm.
FIGURE 7:
FIGURE 7:
LBR depletes from the lamin-A,C–enriched nuclear blebs and distributes similar to lamin-B. (A) Migration of A549 cells through 3 µm Transwell pores leads to nuclear blebs formation. (B) These nuclear blebs are always (green bars) enriched in lamin-A,C and deficient in both lamin-B and LBR (gray bars), as shown by the representative images (average ± SEM, n > 10 cells).
FIGURE 8:
FIGURE 8:
Matrix apparent microelasticity determines physical, molecular, and functional cell contractile phenotypes. Cells on stiff matrices or soft ones that are sufficiently thin and are attached to rigid surfaces generate elevated contractile forces that enhance lamin-A,C expression at the nuclear envelope. Acting as a mechano-sensor, lamin-A,C directs myosin-IIA expression and suppression of LBR. Reduction in lamin-A,C, for example in soft environments, enables LBR translocation at the nuclear envelope. Together, cells obtain a contractile phenotype in accordance with matrix mechanics to direct differentiation programs of soft or stiff tissue lineages.

References

    1. Alam SG, Lovett D, Kim DI, Roux KJ, Dickinson RB, Lele TP. The nucleus is an intracellular propagator of tensile forces in NIH 3T3 fibroblasts. J Cell Sci. 2015;128:1901–1911. - PMC - PubMed
    1. Balcioglu HE, van Hoorn H, Donato DM, Schmidt T, Danen EH. The integrin expression profile modulates orientation and dynamics of force transmission at cell matrix adhesions. J Cell Sci. 2015;128:1316–1326. - PubMed
    1. Ben-Ze’ev A, Farmer SR, Penman S. Protein synthesis requires cell-surface contact while nuclear events respond to cell shape in anchorage-dependent fibroblasts. Cell. 1980;21:365–372. - PubMed
    1. Beningo KA, Dembo M, Wang Y-L. Responses of fibroblasts to anchorage of dorsal extracellular matrix receptors. Proc Natl Acad Sci USA. 2004;101:18024–18029. - PMC - PubMed
    1. Bjorkhem I, Meaney S. Brain cholesterol: long secret life behind a barrier. Arterioscler Thromb Vasc Biol. 2004;24:806–815. - PubMed

MeSH terms