. 2017 Nov 7;28(23):3229-3239.
doi: 10.1091/mbc.E17-06-0385. Epub 2017 Sep 20.

Micropipette force probe to quantify single-cell force generation: application to T-cell activation

Affiliations

Micropipette force probe to quantify single-cell force generation: application to T-cell activation

Anna Sawicka et al. Mol Biol Cell. .

Abstract

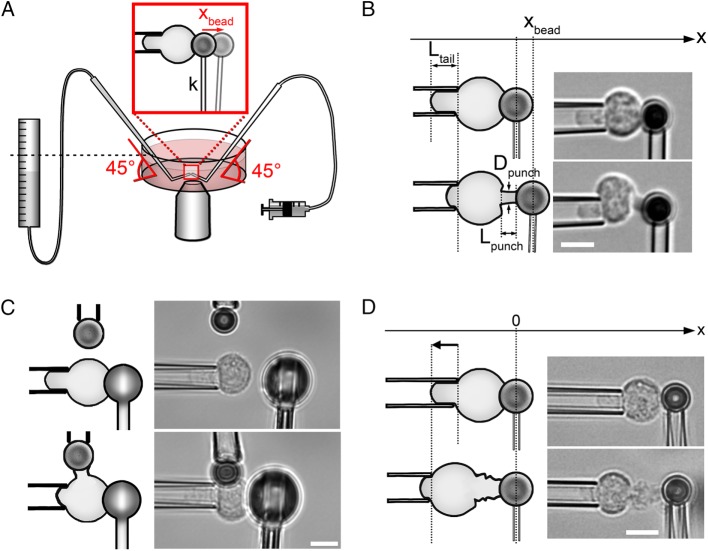
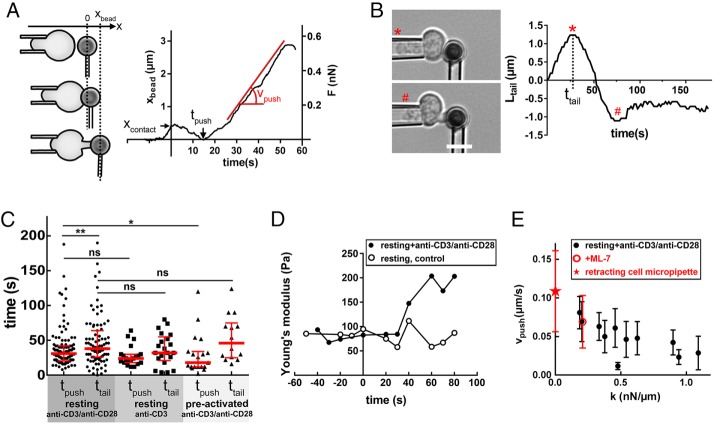
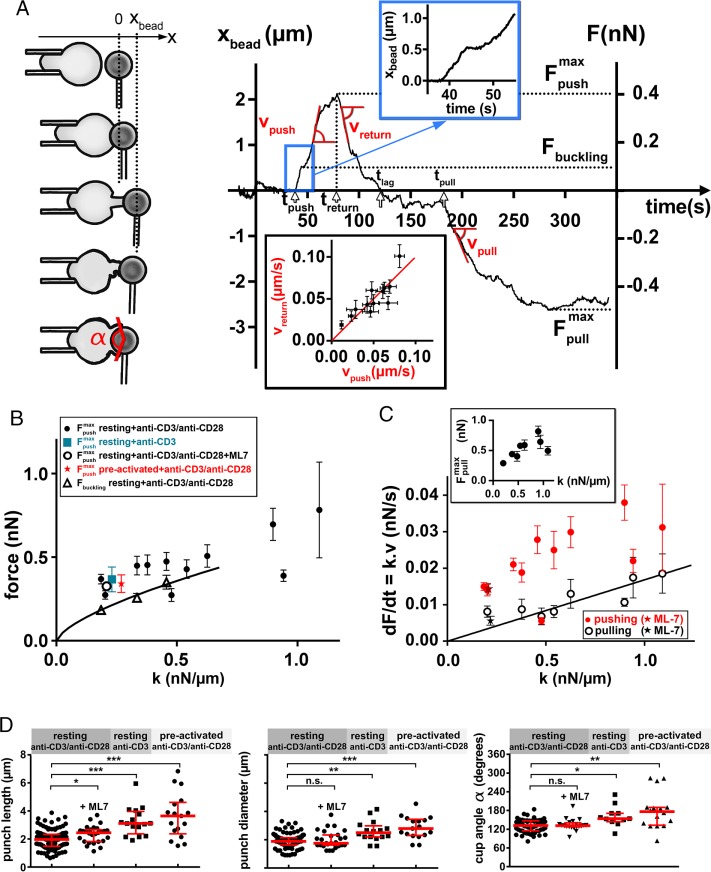
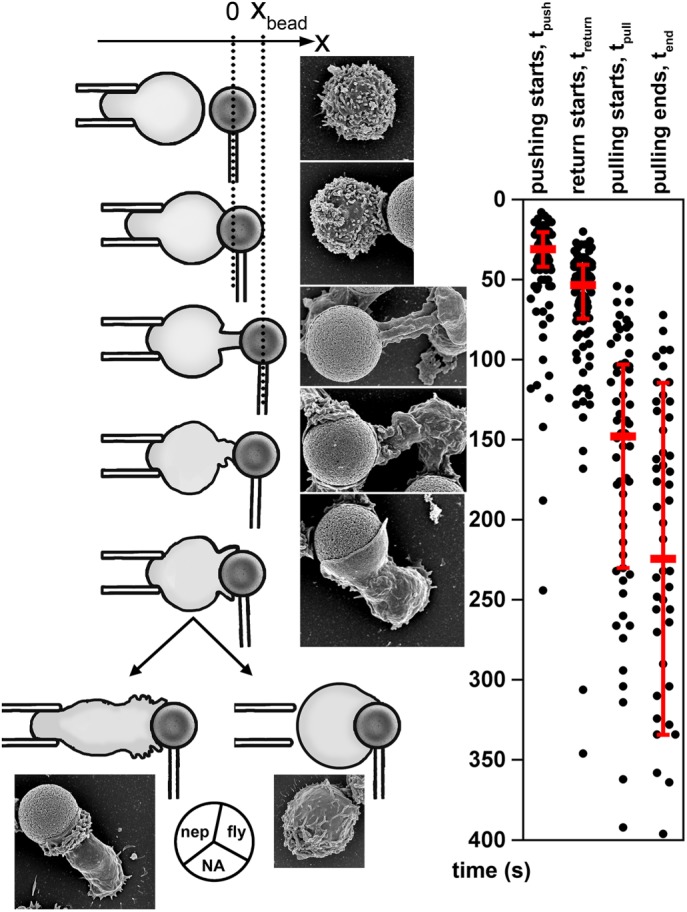
In response to engagement of surface molecules, cells generate active forces that regulate many cellular processes. Developing tools that permit gathering mechanical and morphological information on these forces is of the utmost importance. Here we describe a new technique, the micropipette force probe, that uses a micropipette as a flexible cantilever that can aspirate at its tip a bead that is coated with molecules of interest and is brought in contact with the cell. This technique simultaneously allows tracking the resulting changes in cell morphology and mechanics as well as measuring the forces generated by the cell. To illustrate the power of this technique, we applied it to the study of human primary T lymphocytes (T-cells). It allowed the fine monitoring of pushing and pulling forces generated by T-cells in response to various activating antibodies and bending stiffness of the micropipette. We further dissected the sequence of mechanical and morphological events occurring during T-cell activation to model force generation and to reveal heterogeneity in the cell population studied. We also report the first measurement of the changes in Young's modulus of T-cells during their activation, showing that T-cells stiffen within the first minutes of the activation process.


Figures

FIGURE 1:
FIGURE 1:
Micropipette setups used in the experiments. (A) Micropipette force probe: overview. The tip of a flexible micropipette holding an activating bead (bead micropipette) is positioned close to the tip of a stiff micropipette holding a cell (cell micropipette). Both micropipettes have a 45° bend, so their tips are in the focal plane of the inverted microscope. During the experiment, the bending of the bead micropipette shows as the displacement of the bead along the x-axis (xbead, see B). The aspiration pressure in the cell micropipette is controlled by the height of a water reservoir. The aspiration pressure in the bead micropipette is controlled with a syringe filled with air. (B) Micropipette force probe: geometrical measurements. Drawings of an activated T-cell (left) with corresponding brightfield microscopy images (right). Top: the cell is brought in contact with the bead at time t = 0. Bottom: the cell pushes the bead away during activation. The position xbead of the center of the bead along the x-axis is tracked over time, leading to speed and force measurement. The dimensions of the pushing protrusion called a punch (length Lpunch and diameter Dpunch) and the part of the cell inside the micropipette called a tail (length Ltail) are measured manually only at the selected frames of the recording. (C) Profile microindentation of a cell during its activation. Drawings (left) and corresponding brightfield images (right). A microindenter replaces the bead micropipette; the bead is held by a third, stiff micropipette. During the experiment, the cell is indented once every 10 s, each indentation providing a measurement of the Young’s modulus, describing the effective stiffness of the cell. After measuring the Young’s modulus baseline value for several cycles (top), the bead is brought in contact with the cell; the indentations continue during the activation (bottom, see Figure 2D). (D) Activation of a cell with no resisting bead micropipette. Drawings (left) and corresponding brightfield images (right). A cell is brought in contact with a bead, and when the punch starts growing from the cell, the cell micropipette is retracted to keep the bead micropipette at its initial position, simulating the cell pushing against a bead micropipette of zero bending stiffness. (B–D) Scale bar is 5 µm.
FIGURE 2:
FIGURE 2:
First events during T-cell activation. (A) Onset of pushing force. Drawings of a T-cell during the beginning of the activation process (left) with the corresponding position of the bead xbead (right). At the beginning of the experiment, the bead was located at xbead = 0 (top drawing); at time t = 0 contact was made between the cell and the bead (middle drawing), leading to a small displacement of the bead (xcontact). The cell then reorganized and started growing a protrusion (called a punch, bottom drawing) at time tpush and with a speed vpush. (B) Measurement of tail length. Brightfield images of a T-cell during activation (left), with the corresponding length of the part of the cell that is aspirated in the cell micropipette, Ltail (see Figure 1B). At time t = ttail, the tail started retracting inside the cell micropipette (red star). In this example, the retraction lasted ∼40 s and stopped at t∼70s (red #). Scale bar is 5 µm. (C) Comparison of timings. Two time points, tpush and ttail, were measured from contact to the onset of mechanical changes (see A and B), and for activation of human primary CD4+ T-cells (resting) with anti-CD3/anti-CD28 beads, or only anti-CD3 beads, and for human CD4+ T lymphoblasts (preactivated) with anti-CD3/anti-CD28 beads. Each data point represents one cell, red thick line shows median, whiskers span the interquartile range. *p = 0.02, **p = 0.04, two-tailed Mann-Whitney test. (D) Increase in the Young’s modulus of a T-cell (in its effective stiffness). Full circles: example showing the Young’s modulus of a resting T-cell during its activation measured with profile microindentations (see Figure 1C). Open circles: a control resting T-cell indented with no activating bead. (E) Pushing speed vpush depends on the bending stiffness of the bead micropipette k. Full circles: MFP experiments with various bending stiffness of the bead micropipette. Red star: experiment where the cell micropipette was retracted during punch growth in order to simulate zero bending stiffness (see Figure 1D). Open red circle: resting T-cells treated with 30 µM ML-7 (inhibitor of myosin light chain kinase). Each data point shows mean ± SD over one experimental day (the same bead micropipette), representing 4–13 cells (N = 9 ± 3 cells, mean ± SD).
FIGURE 3:
FIGURE 3:
Sequence of mechanical early events during T-cell activation. (A) Drawings of a T-cell (left) and time trace of the bead position, xbead, and force, F, in the first minutes of T-cell activation (right). Inset at bottom: return speed vreturn vs. pushing speed vpush. The line is a linear regression, with a slope of 1.0. Inset on top: magnification of the stalling of the bead when the punch buckled. (B) Maximal pushing force and buckling force. The continuous line corresponds to the buckling force of an elastic beam (see the text). Each data point shows mean ± SEM over one experimental day, representing 5–14 cells (N = 9 ± 3, mean ± SD). (C) Loading rate dF/dt (force in absolute value) during pushing (full circles) or pulling (open circles) vs. bending stiffness of the bead micropipette k. The line corresponds to a linear fit of the pulling loading rate (see the text). Each data point shows mean ± SEM over one experimental day, representing 3–10 cells (N = 7 ± 2, mean ± SD). Inset: maximal pulling force Fpullmax vs. bending stiffness of the bead micropipette k. (D) Dimensions of the pushing protrusion (punch, left and middle) and the pulling protrusion (cup, right). The punch length and diameter were measured when the punch was the longest (see Figure 1B), and the cup coverage angle on the bead, α, was measured as soon as the cup was formed (see the bottom drawing in A). *p < 0.05, **p < 0.01, ***p < 0.001 two-tailed unpaired t test with Welch’s correction.
FIGURE 4:
FIGURE 4:
Morphology of T-cells during early stages of activation. Drawings of T-cells (left) with corresponding examples of cells imaged with scanning electron microscopy (right). The scanning electron microscopy images were cropped from larger fields of view, see Supplemental Figure S3B. Beads are 4.5 μm in diameter. The pie chart shows the proportion of the two morphological types in the population; nep, nepenthes, fly, flytrap, NA, not assigned (N = 77 resting T-cells activated with anti-CD3/anti-CD28 beads in eight experiments). Timeline shows the different phases of the activation process (see chart in the Figure 3A) for resting T-cells activated with anti-CD3/anti-CD28 beads. Each dot is a single cell; red thick line shows the median; whiskers span the IQR.

Similar articles

Cited by

References

    1. Ashdown GW, Burn GL, Williamson DJ, Pandžić E, Peters R, Holden M, Ewers H, Shao L, Wiseman PW, Owen DM. Live-cell super-resolution reveals F-actin and plasma membrane dynamics at the T cell synapse. Biophys J. 2017;112:1703–1713. - PMC - PubMed
    1. Babich A, Li S, O’Connor RS, Milone MC, Freedman BD, Burkhardt JK. F-actin polymerization and retrograde flow drive sustained PLC?1 signaling during T cell activation. J Cell Biol. 2012;197:775–787. - PMC - PubMed
    1. Bai K, Wang W. Spatio-temporal development of the endothelial glycocalyx layer and its mechanical property in vitro. J R Soc Interface. 2012;9:2290–2298. - PMC - PubMed
    1. Bashour KT, Gondarenko A, Chen H, Shen K, Liu X, Huse M, Hone JC, Kam LC. CD28 and CD3 have complementary roles in T-cell traction forces. Proc Natl Acad Sci USA. 2014;111:2241–2246. - PMC - PubMed
    1. Basu R, Whitlock BM, Husson J, Le Floc’h A, Jin W, Oyler-Yaniv A, Dotiwala F, Giannone G, Hivroz C, Biais N, et al. Cytotoxic T cells use mechanical force to potentiate target cell killing. Cell. 2016;165:100–110. - PMC - PubMed

MeSH terms

LinkOut - more resources