. 2017 Oct 15;199(8):2701-2712.
doi: 10.4049/jimmunol.1600934. Epub 2017 Sep 20.

Sublethal Total Body Irradiation Causes Long-Term Deficits in Thymus Function by Reducing Lymphoid Progenitors

Affiliations

Sublethal Total Body Irradiation Causes Long-Term Deficits in Thymus Function by Reducing Lymphoid Progenitors

Shiyun Xiao et al. J Immunol. .

Abstract

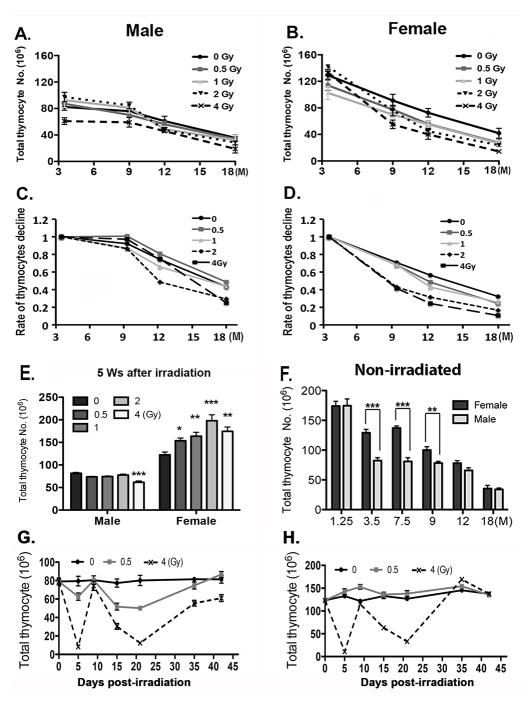
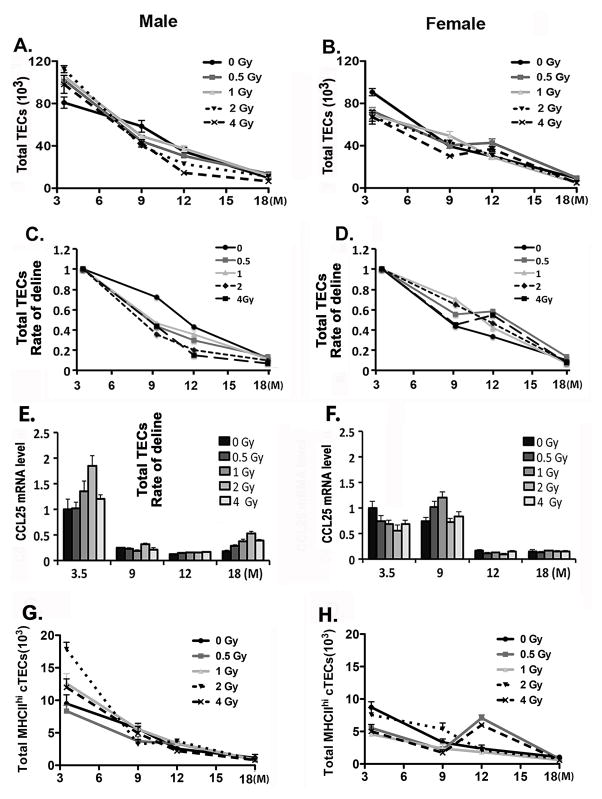
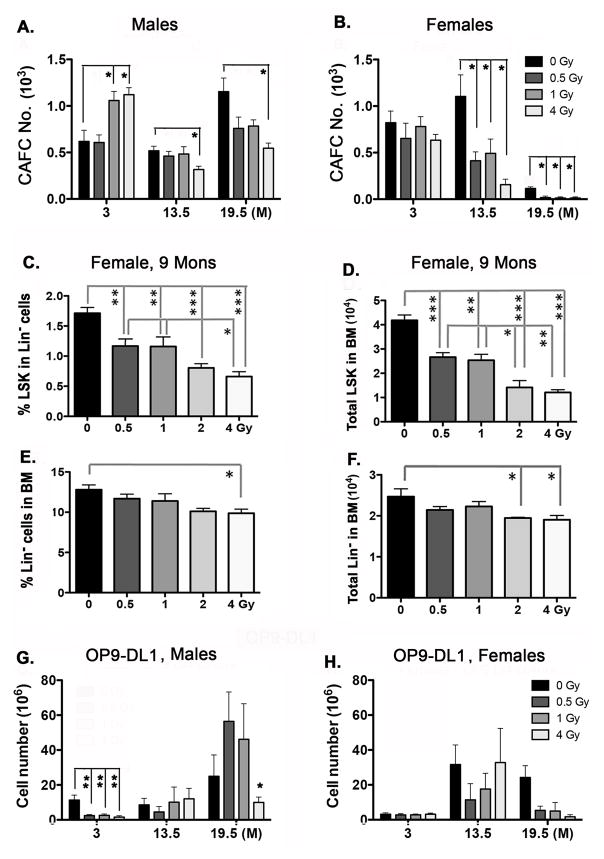
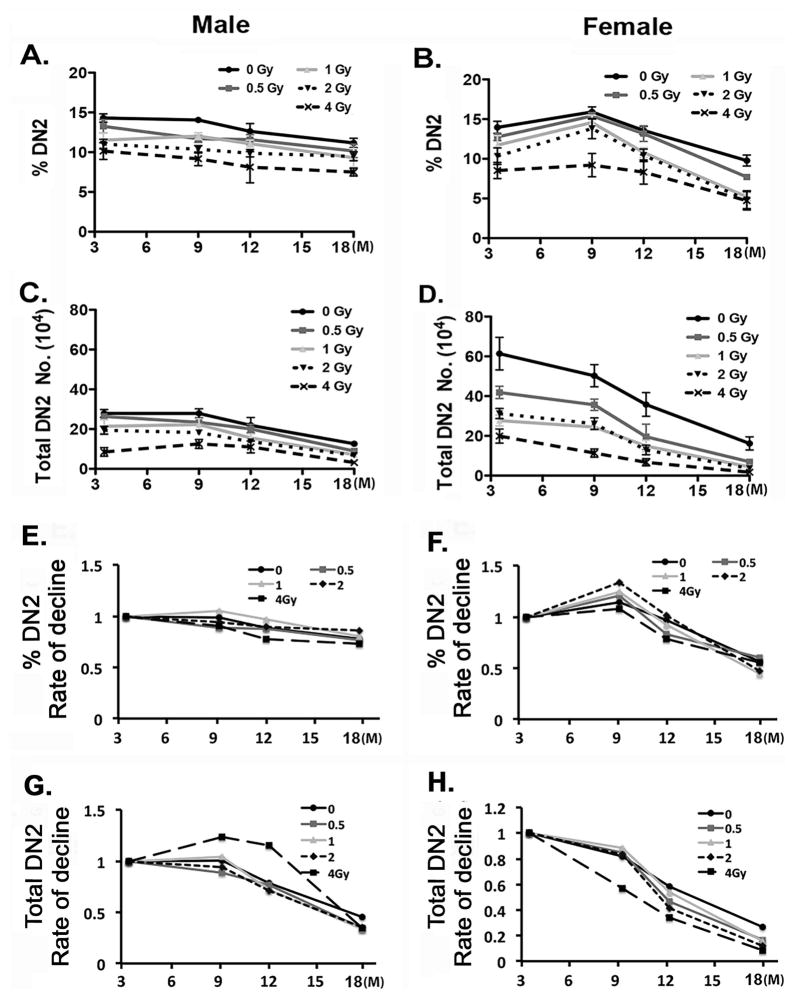
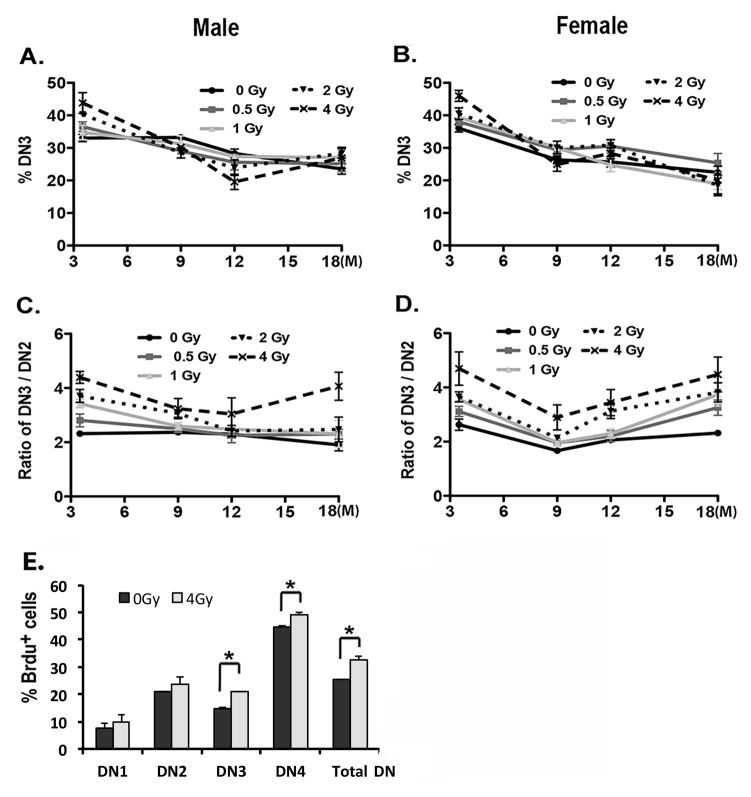
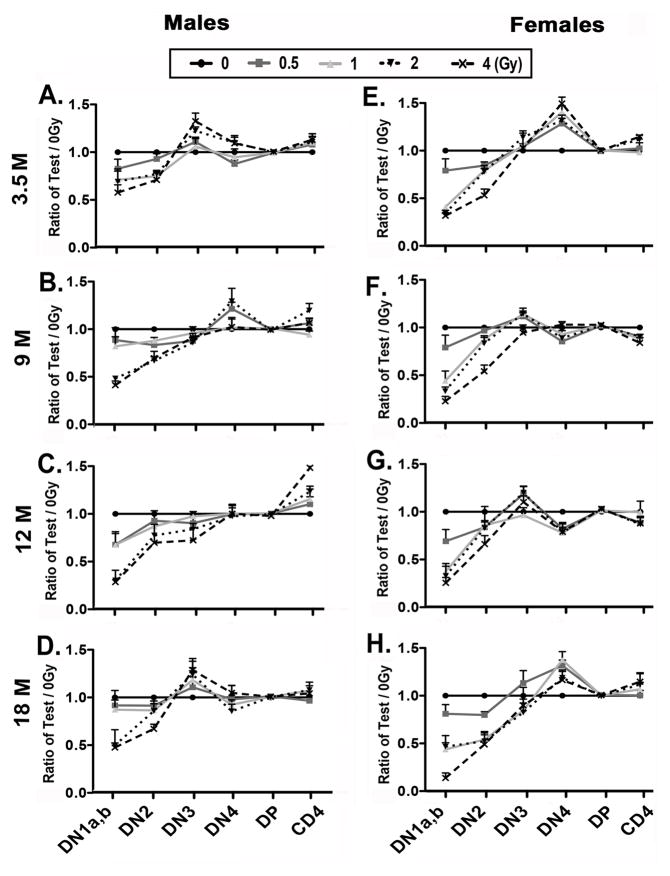
Total body irradiation (TBI) damages hematopoietic cells in the bone marrow and thymus; however, the long-term effects of irradiation with aging remain unclear. In this study, we found that the impact of radiation on thymopoiesis in mice varied by sex and dose but, overall, thymopoiesis remained suppressed for ≥12 mo after a single exposure. Male and female mice showed a long-term dose-dependent reduction in thymic cKit+ lymphoid progenitors that was maintained throughout life. Damage to hematopoietic stem cells (HSCs) in the bone marrow was dose dependent, with as little as 0.5 Gy causing a significant long-term reduction. In addition, the potential for T lineage commitment was radiation sensitive with aging. Overall, the impact of irradiation on the hematopoietic lineage was more severe in females. In contrast, the rate of decline in thymic epithelial cell numbers with age was radiation-sensitive only in males, and other characteristics including Ccl25 transcription were unaffected. Taken together, these data suggest that long-term suppression of thymopoiesis after sublethal irradiation was primarily due to fewer progenitors in the BM combined with reduced potential for T lineage commitment. A single irradiation dose also caused synchronization of thymopoiesis, with a periodic thymocyte differentiation profile persisting for at least 12 mo postirradiation. This study suggests that the number and capability of HSCs for T cell production can be dramatically and permanently damaged after a single relatively low TBI dose, accelerating aging-associated thymic involution. Our findings may impact evaluation and therapeutic intervention of human TBI events.


Figures

Figure 1
Figure 1. The effects of irradiation and aging on total thymocytes are dependent on irradiation dose and sex
(A–D) Two-month-old male and female mice were irradiated at 0, 0.5, 1, 2, and 4 Gy and analyzed at ages of 3.5, 9, 12 and 18 months. Data was collected from at least 5 mice per age and dose and shown as the mean ± SE. (A, B) Total numbers of thymocytes. (C, D) Rates of thymocyte number changes, normalized to the values at 3.5 days in each dose category. (E) Total number of thymocytes from male and female mice irradiated at age 2 months, the analyzed 35 days after irradiation. (F) Total numbers of thymocytes collected from non-irradiated control mice at ages of 1.25, 3.5, 7.5, 9, 12, and 18 months are compared in the histogram. (G,H) Kinetic change of total thymocyte number within 42 days after irradiation in 2 month-old male (G) and female (H) mice exposed to 0, 0.5 and 4 Gy of irradiation and aged 5–45 days after irratiation. Student’s t-tests; P-value: *<0.05, **<0.01, ***<0.001.
Figure 2
Figure 2. Irradiation causes a significant long-term reduction in TCRαβ progenitor DN1a,b cells in the thymus
Two-month-old mice were exposed to 0, 0.5, 1, 2, and 4 Gy of irradiation and analyzed at ages of 3.5, 9, 12 and 18 months. The thymocytes isolated from male (A, C, E) and female (B, D, F) mice are shown. (A, B). Percentages of total LinDN1 (LinCD25CD44+). (C, D). Percentages of DN1a,b (Lin,cKithi,CD24+/lo) subsets among total LinDN1 cells. (E, F). Total number of DN1a,b subsets in the thymus. (G–J) The rate of decline in the percentage and total cell number of DN1a,b cells. The percentage and total cell number for each time point and dose were plotted relative to the values at 3.5 months within each dose, to generate the rate of decline in the percentage of DN1a,b from male (G) and female (H), and in total number of DN1a,b from male (I) and female (J). Each bar represents data collected from 5 mice and is shown as the mean ± SE.
Figure 3
Figure 3. Effects of sublethal irradiation on TEC numbers with aging
Two-month-old mice were exposed to 0, 0.5, 1, 2, and 4 Gy of irradiation and analyzed at ages of 3.5, 9, 12 and 18 months. Stromal cells from one lobe per thymus stained with anti-CD45, Epcam, and MHCII antibodies, and gated on CD45MHCII+Epcam+. (A, B). The numbers of total TECs in male (A) and female (B) mice. (C, D). The percentage and total cell number for each time point and dose were plotted relative to the values at 3.5 months within each dose to generate the rate of decline of TEC numbers in male (C) and female (D) mice. (E, F). Ccl25 gene expression in sorted total TECs from male (E) and female (F) mice. (G–H) Total numbers of MHCIIhi cTECs in male (G) and female (H) mice. Data were collected from 5 mice and shown as the mean ± SE.
Figure 4
Figure 4. Irradiation causes a long-term reduction of LSK hematopoietic stem cells in the BM
Male and female mice (as indicated) were exposed to 0, 0.5, 1, 2, and 4 Gy of irradiation and analyzed at ages of 3, 13.5, and 19.5 months (A, B, G, H) or 9 months (CF). (A, B) Total bone marrow cells were isolated and assessed for Cobblestone Area-Forming Cells (CAFC) as a measure of primitive HSC numbers. (C) Percentage of LSK (LinSca-1+cKithi) cells among Lin BM cells. (D) Total number of LSK cells in the BM. (E) Percentage of Lin cells in the BM. (F) Total number of Lin cells in the BM. (G, F) Total bone marrow cells were expanded on OP9-DL1 cell layers for 28 days in MEM alpha/10% FBS/1% penicillin-streptomycin plus mIL-7 (5ng/ml) and mFlt3L (5ng/ml). Data analyzed by Wilcoxan rank sum test (A, B, G, H) or one-way ANOVA (C–F). Brackets across the top of the bars indicate significant differences between two individual samples. Data were collected from 5 mice and shown as the mean ± SE. P-values: *<0.05, **<0.01, ***<0.001.
Figure 5
Figure 5. Early developing DN2 (CD44+CD25+) thymocytes are reduced after irradiation
Two-month-old mice were exposed to 0, 0.5, 1, 2, and 4 Gy of irradiation and analyzed at ages of 3.5, 9, 12 and 18 months. (A, B) Percentages of DN2 (CD44+CD25+) subsets gated on DN (CD4CD8) cells collected from male (A) and female (B) mice. (C, D) Total numbers of DN2 cells collected from male (C) and female (D) mice. (E–H) The percentage and total cell number for each time point and dose were plotted relative to the values at 3.5 months within each dose to generate the rate of decline. The rate of decline in the percentage of DN2 cells in total DN cells from male (E) and female (F) mice, and in the total number of DN2 cells from male (G) and female (H) mice. Data were collected from 5 mice and shown as the mean ± SE.
Figure 6
Figure 6. The proliferation of the DN3 subset is increased after irradiation, resulting in an increased ratio of DN3 to DN2 cells
Two-month-old mice were exposed to 0, 0.5, 1, 2, and 4 Gy of irradiation and analyzed at ages of 3.5, 9, 12 and 18 months. (A, B) Percentage of DN3 subset generated from male (A) and female (B) are shown in the histograms. (C, D) Ratios of DN3 to DN2 subsets in male (C) and female (D) are shown in the histograms. (E) Total thymocytes were isolated from female mice at 6 weeks after irradiation at 4 Gy. BrdU+ cells gated on DN1–4 subsets and total DN cells are shown. Data were collected from 5 mice in each group and shown as the mean ± SE. *, p <0.05 by Student’s t-test.
Figure 7
Figure 7. The kinetics of thymocyte differentiation show a periodic profile after irradiation
Two-month-old mice were exposed to 0, 0.5, 1, 2, and 4 Gy of irradiation and analyzed at ages of 3.5, 9, 12 and 18 months. Total thymocytes were analyzed at the indicated ages after irradiation. Percentages of DN1a,b, DN2, DN3, DN4, DP, and CD4 SP subsets in each test dose were normalized to those of 0 Gy controls and shown as “ratio of Test/0 Gy” in the histograms. Data are shown separately from male (A, B, C, D) and female (E, F, G, H) mice. Data were collected from 5 mice each and shown as the mean ± SE.

Similar articles

Cited by

References

    1. Donskoy E, Goldschneider I. Thymocytopoiesis is maintained by blood-borne precursors throughout postnatal life. A study in parabiotic mice. J Immunol. 1992;148:1604–1612. - PubMed
    1. Foss DL, Donskoy E, Goldschneider I. The importation of hematogenous precursors by the thymus is a gated phenomenon in normal adult mice. J Exp Med. 2001;193:365–374. - PMC - PubMed
    1. Goldschneider I, Komschlies KL, Greiner DL. Studies of thymocytopoiesis in rats and mice. I. Kinetics of appearance of thymocytes using a direct intrathymic adoptive transfer assay for thymocyte precursors. J Exp Med. 1986;163:1–17. - PMC - PubMed
    1. Porritt HE, Rumfelt LL, Tabrizifard S, Schmitt TM, Zuniga-Pflucker JC, Petrie HT. Heterogeneity among DN1 prothymocytes reveals multiple progenitors with different capacities to generate T cell and non-T cell lineages. Immunity. 2004;20:735–745. - PubMed
    1. Shortman K, Wu L. Early T lymphocyte progenitors. Annu Rev Immunol. 1996;14:29–47. - PubMed

Publication types

MeSH terms

Substances