. 2017 Nov 6;214(11):3347-3360.
doi: 10.1084/jem.20170488. Epub 2017 Sep 20.

The first wave of T lymphopoiesis in zebrafish arises from aorta endothelium independent of hematopoietic stem cells

Affiliations

The first wave of T lymphopoiesis in zebrafish arises from aorta endothelium independent of hematopoietic stem cells

Ye Tian et al. J Exp Med. .

Abstract

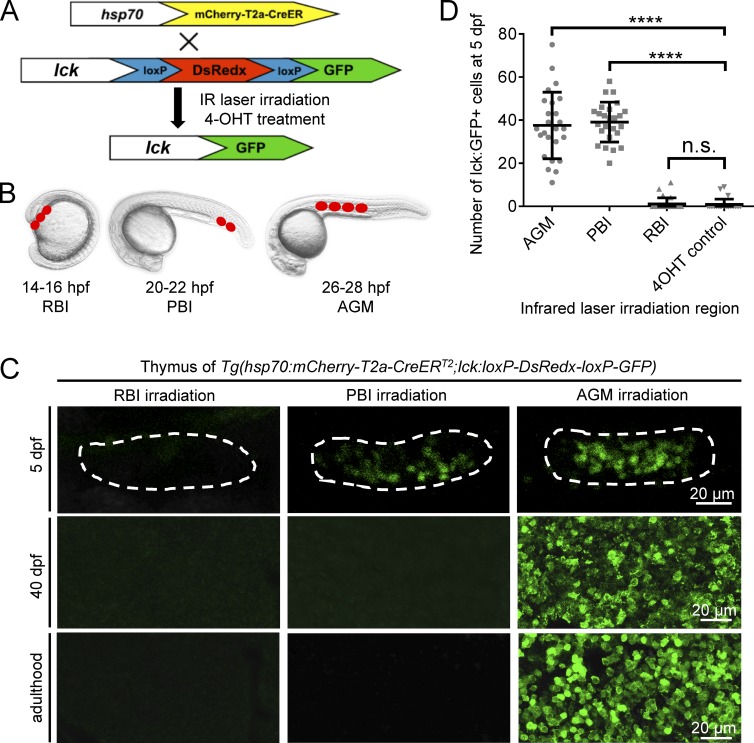
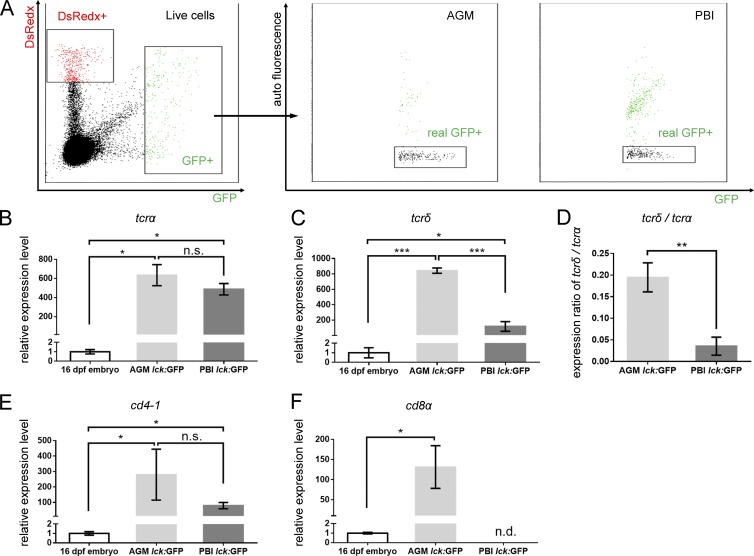
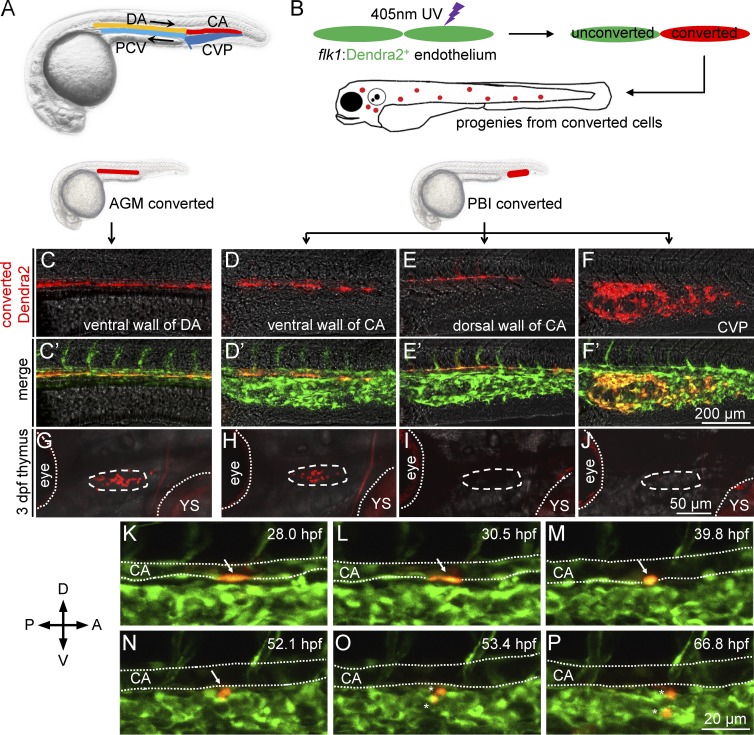
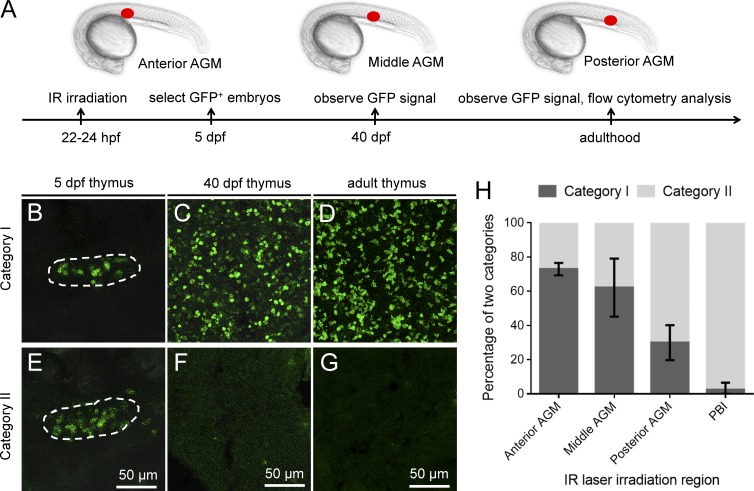
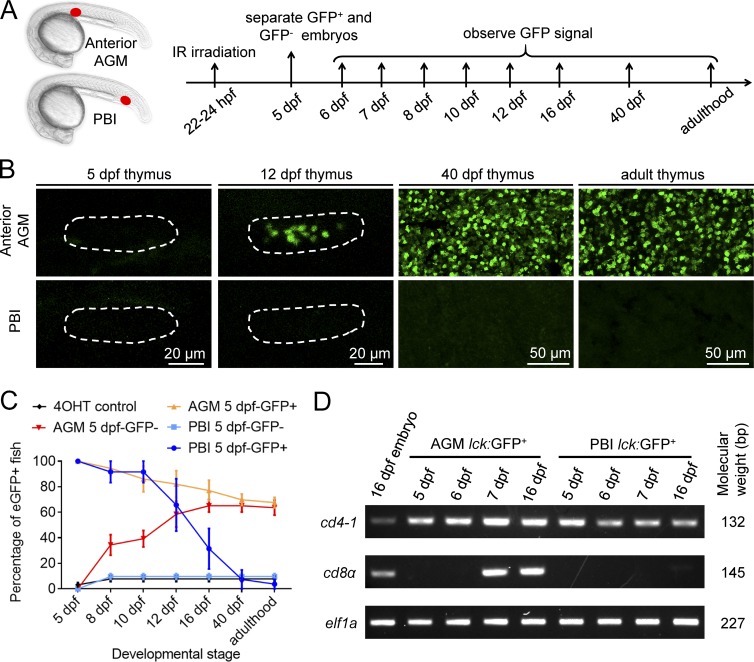
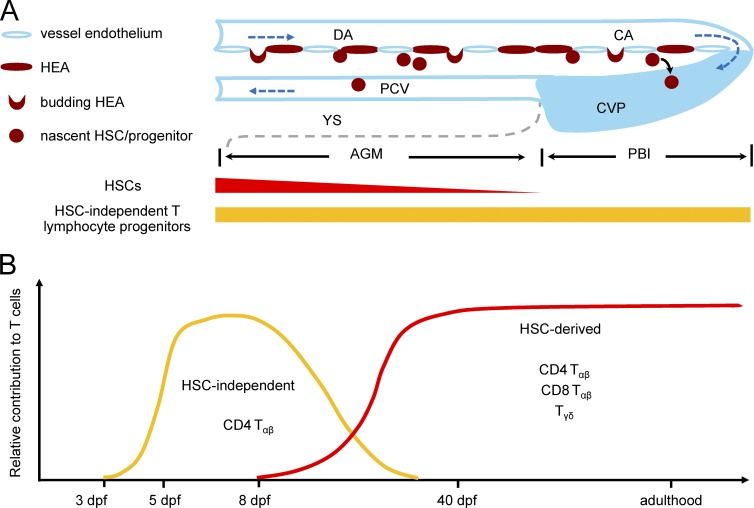
T lymphocytes are key cellular components of the adaptive immune system and play a central role in cell-mediated immunity in vertebrates. Despite their heterogeneities, it is believed that all different types of T lymphocytes are generated exclusively via the differentiation of hematopoietic stem cells (HSCs). Using temporal-spatial resolved fate-mapping analysis and time-lapse imaging, here we show that the ventral endothelium in the zebrafish aorta-gonad-mesonephros and posterior blood island, the hematopoietic tissues previously known to generate HSCs and erythromyeloid progenitors, respectively, gives rise to a transient wave of T lymphopoiesis independent of HSCs. This HSC-independent T lymphopoiesis occurs early and generates predominantly CD4 Tαβ cells in the larval but not juvenile and adult stages, whereas HSC-dependent T lymphopoiesis emerges late and produces various subtypes of T lymphocytes continuously from the larval stage to adulthood. Our study unveils the existence, origin, and ontogeny of HSC-independent T lymphopoiesis in vivo and reveals the complexity of the endothelial-hematopoietic transition of the aorta.


Figures

Figure 1.
Figure 1.
A transient wave of T cells is in situ generated from the PBI. (A and B) Outline of the infrared-mediated temporal–spatial cell labeling strategy. The T cell reporter Tg(lck:loxP-DsRedx-loxP-GFP) fish are outcrossed with Tg(hsp70:mCherry-T2a-CreERT2) line. The double-transgenic embryos are heat-shocked at restricted regions by infrared (IR) laser irradiation to induce temporal–spatial restricted expression of CreER. After 4-hydroxytamoxifen (4-OHT) treatment, CreER-mediated loxP recombination will remove DsRedx, resulting in GFP expression. The RBI region is irradiated at 14–16 hpf with three spots, the PBI region is irradiated at 20–22 hpf with two spots, and the AGM region is irradiated at 26–28 hpf with four spots. The target regions are indicated by red dots, and each dot represents one heat shock spot. (C) Images of lck:GFP+ cells in the thymus of the RBI-, PBI-, and AGM-irradiated fish at 5 dpf, 40 dpf, and adulthood. Dashed lines depict the thymus of 5-dpf embryos. The signals in the thymus of 5-dpf embryos are captured directly by fluorescent microscope, whereas the signals in the thymus of 40-dpf juveniles and adult fish are imaged after anti-GFP staining of the cryosection. (D) Quantification of lck:GFP+ cells in the thymus of 5-dpf embryos. AGM (n = 25), PBI (n = 25), and RBI (n = 25) represent embryos that are irradiated by IR and treated with 4-OHT, whereas 4-OHT control (n = 25) are embryos treated with 4-OHT only. Data are represented as mean ± SD. Unpaired, two-tailed t test was performed to determine significance. ****, P < 0.0001. See also Figs. S1, S2, and S3.
Figure 2.
Figure 2.
Characterization of PBI-derived T cells. (A) Dot plot of FACS of lck:GFP+ cells from 16-dpf AGM-irradiated (left) and PBI-irradiated (middle) fish. GFP+ cells are gated from live cells, and autofluorescent cells are excluded by real-GFP+ gate. Three independent experiments (in each group, ∼20 fish are pooled together) are conducted. The cDNA are prepared from at least 250 lck:GFP+ cells isolated from 16-dpf AGM- and PBI-irradiated embryos and subjected to qPCR analysis. cDNA prepared from the whole 16-dpf embryos are used as a control. (B and C) Relative expression levels of tcrα and tcrδ in the AGM- and PBI-derived T cells. Three independent experiments are conducted. (D) Expression ratio of tcrδ to tcrα. The values are calculated on the basis of the expression level of tcrα and tcrδ relative to the internal control gene (elf1a). (E and F) Relative expression levels of cd4-1 and cd8α in the AGM- and PBI-derived T cells. Three independent experiments are conducted. Data are represented as mean ± SD. Unpaired, two-tailed t test was performed to determine significance. *, P < 0.05; **, P < 0.01; ***, P < 0.001. See also Fig. S4.
Figure 3.
Figure 3.
PBI-derived T cells originate from the ventral endothelium of caudal aorta. (A) A schematic diagram of the anatomy of main blood vessels in 28-hpf zebrafish embryos. CA, caudal aorta (red); CVP, caudal vein plexus (dark blue); DA, dorsal aorta (orange); PCV, posterior cardinal vein (light blue). Black arrows indicate direction of blood flow. (B) A schematic diagram of photoconversion of flk1:Dendra2+ vessel endothelial cells in 28 hpf Tg(flk1:Dendra2+) embryos. Fluorescent color of Dendra2 changes from green to red after exposure to 405-nm UV laser. (C–F) Red fluorescence of Dendra2+ cells after photoconversion at 28 hpf. The ventral wall of DA, the ventral wall of CA, the dorsal wall of CA, and the CVP are photoconverted using 405-nm UV laser. Fluorescence images are captured immediately after photoconversion. (C′–F′) Merged images of converted (red) and unconverted (green) endothelial cells corresponding to C–F. (G–J) Red Dendra2 signals in the thymus of photoconverted fish. Red Dendra2 signals are detected in the thymus of the 3-dpf embryos photoconverted in the ventral wall of DA (4 of 4) and ventral wall of CA (7 of 8) but not those photo-converted in the dorsal wall of CA (0 of 9) or the CVP (0 of 10). Dashed circles depict the thymus. Dotted lines depict the boundaries of the eyes and YS. (K–P) Time-lapse confocal imaging of the PBI region of Tg(flk1:Dendra2) embryo after photoconversion. A photoconverted endothelial cell (arrows) in the ventral wall of CA undergoes EHT and subsequently divides into two daughter cells (asterisks). The endothelial cell is converted at 28 hpf and traced for ∼40 h. The lumens of CA are depicted by dotted lines. A, anterior; D, dorsal; P, posterior; V, ventral.
Figure 4.
Figure 4.
The AGM in situ generates HSC-independent T cells. (A) A schematic diagram of the experimental design. 22- to 24-hpf double-transgenic Tg(hsp70:mCherry-T2a-CreERT2;lck:loxP-DsRedx-loxP-GFP) embryos are irradiated in the anterior (somite 7), middle (somite 11), and posterior (somite 15; red dot) of the AGM region and subsequently treated with 4-hydroxytamoxifen. At 5 dpf, embryos containing lck:GFP+ cells in the thymus are selected and survived to 40 dpf and adulthood for further analysis. IR, infrared. (B–D) Images of lck:GFP+ cells in the thymus of category I fish, in which GFP+ T cells are maintained from embryonic stage to adulthood. Dashed line depicts the thymus of 5-dpf embryos. (E–G) Images of lck:GFP+ cells in the thymus of category II fish, in which GFP+ T cells are present at 5 dpf but absent at 40 dpf and adulthood. Dashed line depicts the thymus of 5 dpf embryos. (H) Percentage of category I and category II fish in total fish irradiated in the PBI and in the anterior, middle, and posterior of the AGM. Three independent experiments are conducted [(experiment 1: anterior AGM, n = 4; middle AGM, n = 8; posterior AGM, n = 13; and PBI, n = 14); (experiment 2: anterior AGM, n = 16; middle AGM, n = 19; posterior AGM, n = 20; and PBI, n = 16); (experiment 3: anterior AGM, n = 12; middle AGM, n = 7; posterior AGM, n = 12; and PBI, n = 14)]. Data are represented as mean ± SD. See also Fig. S5.
Figure 5.
Figure 5.
HSC-derived and HSC-independent T cells develop in successive waves. (A) A schematic diagram of the experimental design. 22- to 24-hpf double-transgenic Tg(hsp70:mCherry-T2a-CreERT2;lck:loxP-DsRedx-loxP-GFP) embryos are irradiated in the anterior of the AGM (red dot) and the PBI (red dot) flowed by 4-hydroxytamoxifen (4-OHT) treatment. At 5 dpf, the irradiated embryos are separated according to the presence (5-dpf-GFP+) or absence (5-dpf-GFP) of lck:GFP+ cells in the thymus. The presence of lck:GFP+ cells in the thymus and their dynamic behavior are monitored at the indicated stages. (B) Images of lck:GFP+ cells in the thymus of 5-dpf-GFP group fish at various stages. Most of the AGM-irradiated 5-dpf-GFP fish begin to acquire GFP+ T cells from 8 dpf onward and continue to maintain GFP+ T cells to adulthood. The PBI-irradiated 5-dpf-GFP fish do not contain GFP+ T cells at all the time window examined. Dashed line depicts the thymus of 5- and 12-dpf embryos. (C) Percentage of GFP+ fish of each group at various stages. Control group (black line), AGM-irradiated 5-dpf-GFP group (red line), AGM-irradiated 5-dpf-GFP+ group (orange line), PBI-irradiated 5-dpf-GFP group (light blue line), and PBI-irradiated 5-dpf-GFP+ group (dark blue line) are shown. Three independent experiments are conducted (experiment 1: anterior AGM, n = 20; PBI, n = 25; and 4-OHT control, n = 22; experiment 2: anterior AGM, n = 25; PBI, n = 17; and 4-OHT control, n = 17; experiment 3: anterior AGM, n = 61; PBI, n = 13; and 4-OHT control, n = 28). Data are represented as mean ± SD. (D) Expression of cd4-1 and cd8α in the PBI- and AGM-derived lck:GFP+ T cells at various stages detected by RT-PCR. elf1a is used as internal control.
Figure 6.
Figure 6.
Summary of distinct waves of T lymphopoiesis in zebrafish. (A) A schematic diagram illustrates that EHT occurs along the entire ventral endothelium of the aorta in zebrafish. Blood vessels are marked by light blue. Direction of blood flow is indicated by dark blue dashed arrows. Boundary of the yolk sac in the ventral side of the trunk is depicted by gray dashed line. Hemogenic endothelium of aorta (HEA) is indicated in dark red. The capacity of generating HSCs and HSC-independent T cell progenitors along the HEA are indicated by red and orange bar, respectively. (B) A schematic diagram depicts two waves of T lymphopoiesis in zebrafish. HSC-independent T cells (orange) emerge at 3 dpf and gradually decline at the late larval stages and diminish in juvenile and adulthood. HSC-derived T cells (red) emerge at around 8 dpf and are replenished continuously throughout the life span of zebrafish.

Similar articles

Cited by

References

    1. Adamo L., Naveiras O., Wenzel P.L., McKinney-Freeman S., Mack P.J., Gracia-Sancho J., Suchy-Dicey A., Yoshimoto M., Lensch M.W., Yoder M.C., et al. . 2009. Biomechanical forces promote embryonic haematopoiesis. Nature. 459:1131–1135. 10.1038/nature08073 - DOI - PMC - PubMed
    1. Alvarez-Silva M., Belo-Diabangouaya P., Salaün J., and Dieterlen-Lièvre F.. 2003. Mouse placenta is a major hematopoietic organ. Development. 130:5437–5444. 10.1242/dev.00755 - DOI - PubMed
    1. Beaudin A.E., Boyer S.W., Perez-Cunningham J., Hernandez G.E., Derderian S.C., Jujjavarapu C., Aaserude E., MacKenzie T., and Forsberg E.C.. 2016. A transient developmental hematopoietic stem cell gives rise to innate-like B and T cells. Cell Stem Cell. 19:768–783. 10.1016/j.stem.2016.08.013 - DOI - PMC - PubMed
    1. Bertrand J.Y., Kim A.D., Violette E.P., Stachura D.L., Cisson J.L., and Traver D.. 2007. Definitive hematopoiesis initiates through a committed erythromyeloid progenitor in the zebrafish embryo. Development. 134:4147–4156. 10.1242/dev.012385 - DOI - PMC - PubMed
    1. Bertrand J.Y., Chi N.C., Santoso B., Teng S., Stainier D.Y., and Traver D.. 2010. Haematopoietic stem cells derive directly from aortic endothelium during development. Nature. 464:108–111. 10.1038/nature08738 - DOI - PMC - PubMed

MeSH terms