. 2017 Nov 6;214(11):3197-3206.
doi: 10.1084/jem.20160301. Epub 2017 Sep 20.

PML is a ROS sensor activating p53 upon oxidative stress

Affiliations

PML is a ROS sensor activating p53 upon oxidative stress

Michiko Niwa-Kawakita et al. J Exp Med. .

Abstract

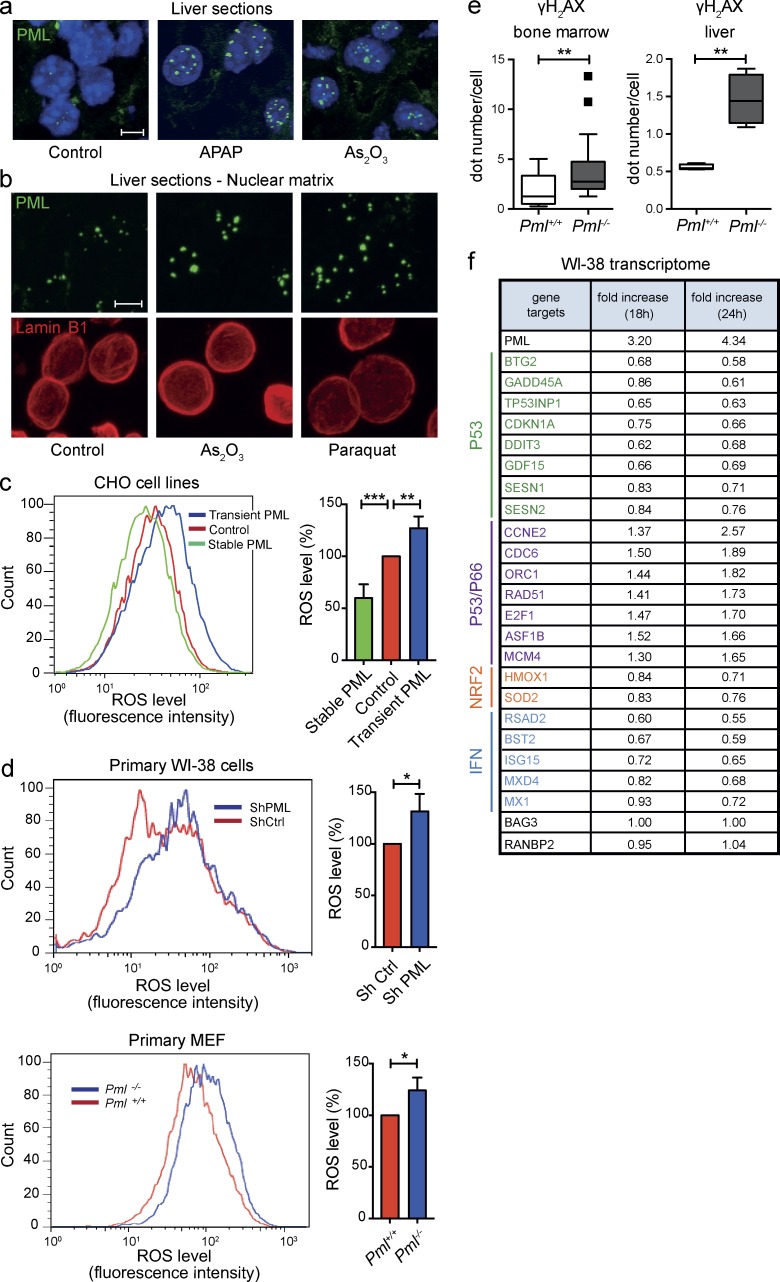
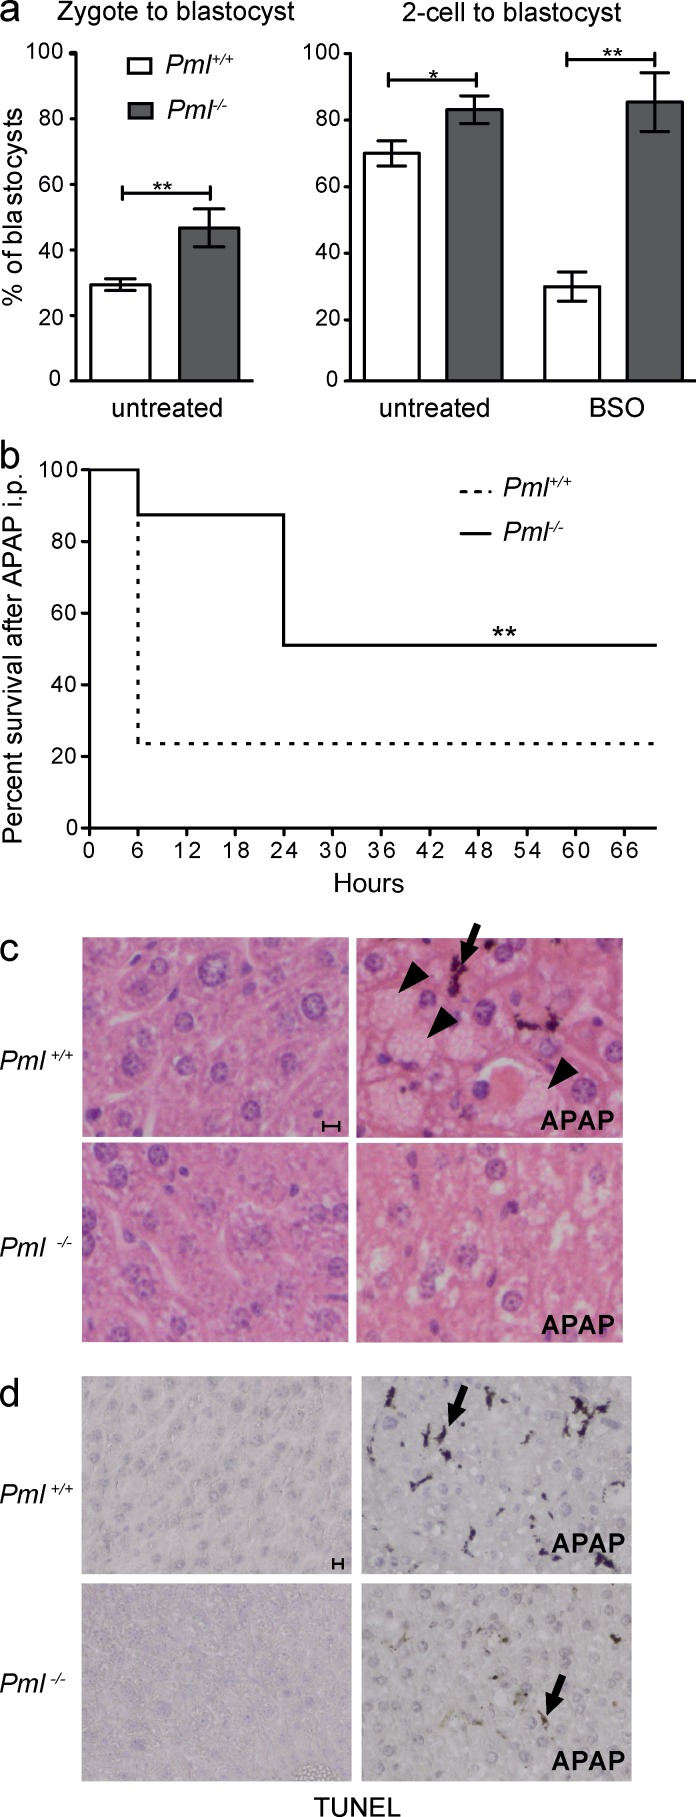
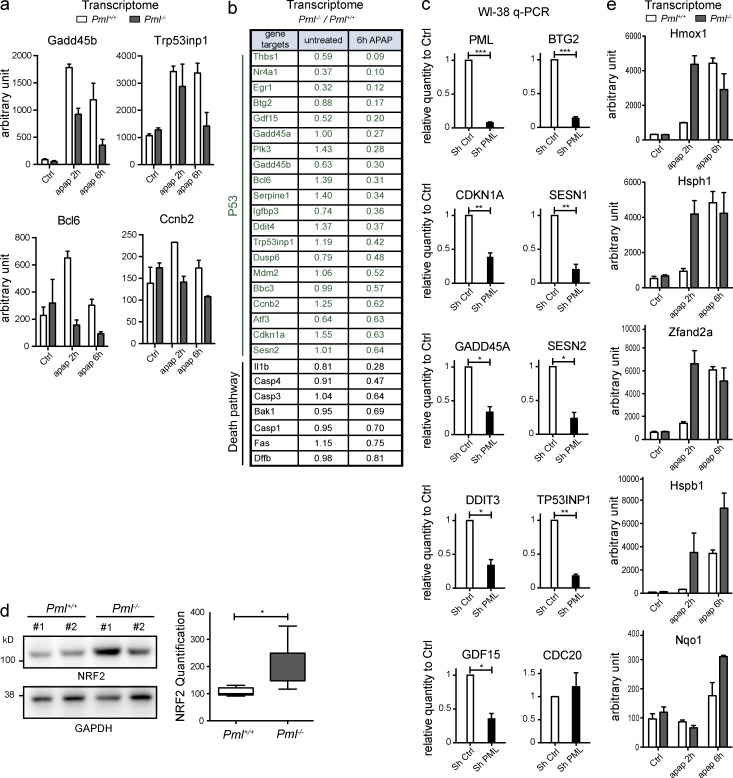
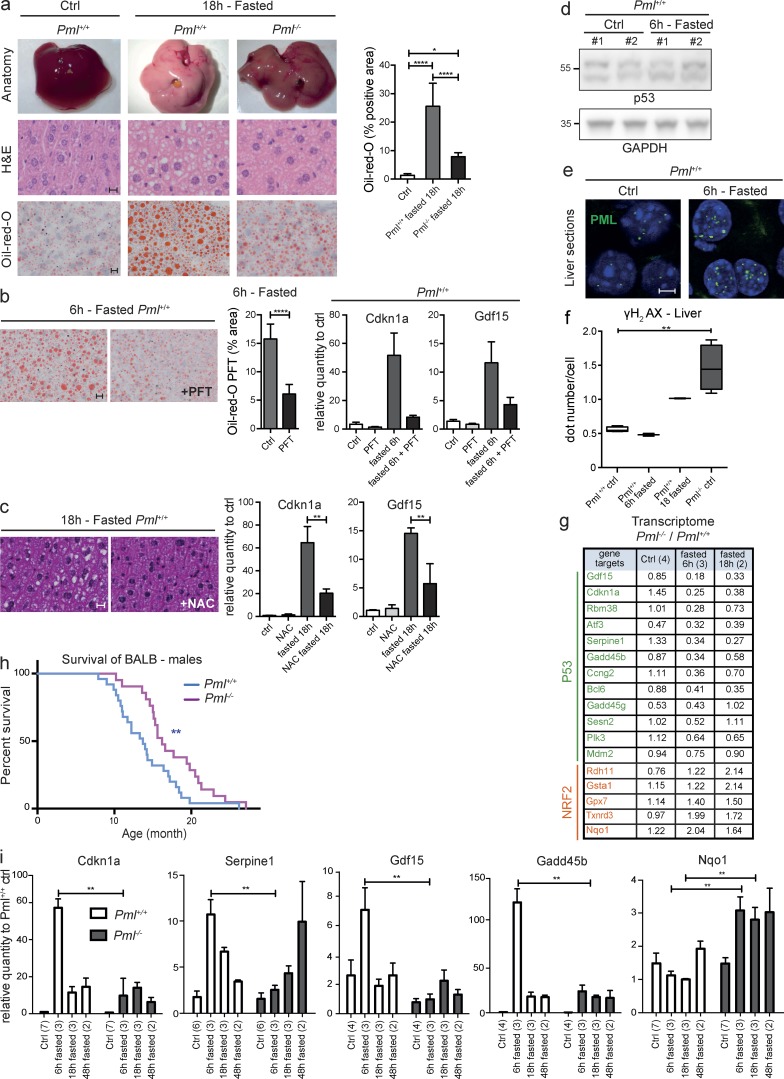
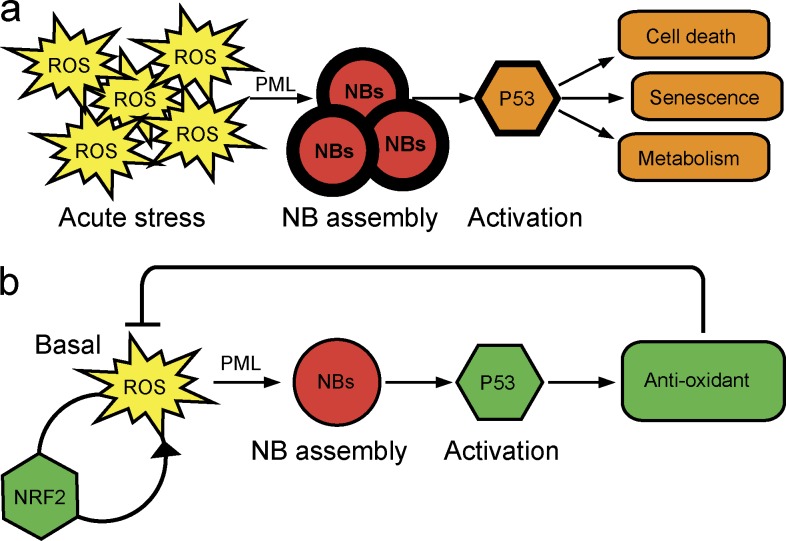
Promyelocytic leukemia (PML) nuclear bodies (NBs) recruit partner proteins, including p53 and its regulators, thereby controlling their abundance or function. Investigating arsenic sensitivity of acute promyelocytic leukemia, we proposed that PML oxidation promotes NB biogenesis. However, physiological links between PML and oxidative stress response in vivo remain unexplored. Here, we identify PML as a reactive oxygen species (ROS) sensor. Pml-/- cells accumulate ROS, whereas PML expression decreases ROS levels. Unexpectedly, Pml-/- embryos survive acute glutathione depletion. Moreover, Pml-/- animals are resistant to acetaminophen hepatotoxicity or fasting-induced steatosis. Molecularly, Pml-/- animals fail to properly activate oxidative stress-responsive p53 targets, whereas the NRF2 response is amplified and accelerated. Finally, in an oxidative stress-prone background, Pml-/- animals display a longevity phenotype, likely reflecting decreased basal p53 activation. Thus, similar to p53, PML exerts basal antioxidant properties but also drives oxidative stress-induced changes in cell survival/proliferation or metabolism in vivo. Through NB biogenesis, PML therefore couples ROS sensing to p53 responses, shedding a new light on the role of PML in senescence or stem cell biology.


Figures

Figure 1.
Figure 1.
PML controls ROS levels. (a) Immunofluorescent staining for PML in response to oxidative stress in vivo. Mice were i.p. injected with arsenic trioxide or APAP and sacrificed 1 h (arsenic) or 2 h (APAP) after injection. PML NBs (green) were analyzed on liver cryosections. DAPI is shown (blue). Data are representative of at least three independent experiments (n = 3) with two mice per condition. Bar, 5 µm. (b) Immunofluorescence analysis of insoluble PML (green) associated with the nuclear matrix prepared from liver cryosections. Livers were collected 1 h after i.p. injection with arsenic or Paraquat or from untreated mice. Lamin B1 (red) was used as a positive control and DAPI as a negative control (not depicted) for in situ nuclear matrix preparation. Bar, 5 µm. (c and d) FACS analysis of ROS levels in the indicated cells using a fluorescent CellROX probe (left), and graphs representing mean fluorescent intensity in indicated cells, normalized to control cells (right). Mean fluorescence intensity was set to 100% in control cells. Data in c and d are representative (left) or quantitative (right) of n = 5 and n = 2 independent experiments, respectively. Error bars represent SEM. (c) CHO cells were transiently or stably transfected with expression vectors encoding PML III isoform or empty vector control. **, P < 0.01; ***, P < 0.001 (t test). (d) Primary WI-38 human fibroblasts were analyzed for ROS content 24 h after transduction with PML or control shRNA lentiviral vector (top). ROS levels were assessed in MEFs freshly extracted from Pml−/− embryos or wild-type littermates (bottom). *, P < 0.05 (t test). (e) Box and whisker plot (Tukey) representing γH2AX dots counts from 100 nuclei assessed by immunofluorescence on the indicated tissues (two mice each/tissue). Mann–Whitney test is indicated (**, P < 0.01). (f) Table extracted from transcriptomic analysis of primary WI-38 cells 18 h and 24 h after transduction with lentivirus encoding the PML IV isoform or with control empty virus. RNA levels relative to control for oxidative stress–induced p53 target genes, some IFNs, p53/p66, or NRF2 targets are indicated. Two unaffected genes are shown as control (black). Data are the mean of n = 2 replicates.
Figure 2.
Figure 2.
Pml−/− embryos and mice are resistant to oxidative stress. (a) Graphs representing percentage of blastocysts derived from Pml+/+ and Pml−/− preimplantation embryos. Embryos were obtained from n = 4 (untreated) and n = 3 (BSO) independent experiments involving 15–45 embryos each; error bars represent SEM (Fisher’s exact test: *, P < 0.05; **, P < 0.01). The total number of embryos was as follows: zygotes: Pml+/+, 123; Pml−/−, 106; 2-cell embryos untreated: Pml+/+, 108; Pml−/−, 140; 2-cell embryos BSO treated: Pml+/+, 45; Pml−/−, 65. (b) Survival (percentage) of Pml−/− and Pml+/+ mice after i.p. injection with APAP (time 0). A total of n = 4 independent experiments were performed (with n = 4–6 mice for each group). **, P < 0.01 (log-rank test or Gehan–Breslow–Wilcoxon tests). (c) Hematoxylin and eosin staining of liver sections from mice treated or not with APAP and sacrificed 6 h later. Note hemorrhages (arrowheads) and an apoptotic cell (arrow). (d) TUNEL performed on liver cryosections from c. Bars, 10 µm.
Figure 3.
Figure 3.
Pml−/− mice fail to activate p53 upon oxidative stress. (a) Graphs representing transcript levels for the indicated p53 target genes determined by transcriptomic arrays of Pml−/− and Pml+/+ mouse livers 2 and 6 h after APAP or vehicle injections. Mean values from two mice per condition are shown. Error bars represent SEM. (b) Table from the transcriptomic analysis in a indicating p53 targets and death regulators and the mRNA ratio in Pml−/− versus Pml+/+ mice. (c) Transcripts from WI-38 fibroblasts transduced with PML or control shRNA were quantified by quantitative PCR. Error bars represent SEM. *, P < 0.05; **, P < 0.01; ***, P < 0.001. (d) Western blot analysis of NRF2 protein from Pml−/− and Pml+/+ mouse livers (left; two representative untreated mice). Box and whisker plot (Tukey) showing NRF2 protein quantification from six mice (right; Mann–Whitney test: *, P < 0.05). (e) Levels of NRF2 target mRNAs (transcriptomic analysis in b) 2 h or 6 h after APAP treatment. Error bars represent SEM.
Figure 4.
Figure 4.
PML is required for the fasting-activated p53 response. (a) Livers from fed or 18-h–fasted Pml−/− and Pml+/+ mice (top), hematoxylin, phloxine, and saffron staining (middle; bar, 10 µm), and oil red O staining (bottom; bar, 10 µm). Quantification of oil red staining from n = 5 mice. Error bars represent SEM. *, P < 0.05; ****, P < 0.0001 (t test). (b) Image (left; bar, 10 µm) and quantification (middle; ****, P < 0.0001 [t test]; error bars represent SEM) of oil red O staining and quantitative PCR analysis of the indicated p53 targets (right; error bars represent SEM) from fasted or fed mice treated or not with pifithrin-α. (c) Hematoxylin, phloxine, and saffron staining (left; bar, 10 µm) and quantitative PCR analysis of indicated p53 targets (right) from fasted mice treated or not with N-acetylcysteine (NAC). Error bars represent SEM. **, P < 0.01. (d) Western blot analysis of p53 and GAPDH from livers of indicated mice. Representative experiment with two mice per condition (fed and 6-h fasted) from n = 2 replicates. (e) Immunofluorescent PML staining (green) upon fasting in liver cryosections (blue, DAPI). Bar, 5 µm. (f) Box and whisker plot (Tukey) representing γH2AX foci on liver sections of Pml−/− and Pml+/+ littermates. Dots were counted from 100 nuclei of four fed mice or two mice fasted for 6 h or 18 h. **, P < 0.01 (Mann–Whitney test). (g) mRNA levels (transcriptomes) from the p53 (top) and NRF2 (bottom) signature in Pml−/− livers relative to their control littermate from fed or fasted mice. (h) Survival of Pml−/− and Pml+/+ littermates. **, P < 0.01 (Gehan–Breslow–Wilcoxon test). (i) Graphs representing quantitative PCR measurement of indicated p53 and NRF2 targets. Mean values with SEM from the indicated number of mice (in parentheses) are shown. **, P < 0.01.
Figure 5.
Figure 5.
Model for PML function in oxidative stress response in vivo. (a) Upon acute oxidative stress, high ROS levels increase NB formation, leading to p53 activation, mediating toxic effects. (b) Basal ROS levels induce PML NB assembly, recruiting p53 and its regulators and inducing antioxidant responses that ultimately decrease ROS levels. With active PML/p53 antioxidant signaling, NRF2 responses are blunted.

Similar articles

Cited by

References

    1. Ablain J., Rice K., Soilihi H., de Reynies A., Minucci S., and de Thé H.. 2014. Activation of a promyelocytic leukemia-tumor protein 53 axis underlies acute promyelocytic leukemia cure. Nat. Med. 20:167–174. 10.1038/nm.3441 - DOI - PubMed
    1. Berkers C.R., Maddocks O.D., Cheung E.C., Mor I., and Vousden K.H.. 2013. Metabolic regulation by p53 family members. Cell Metab. 18:617–633. 10.1016/j.cmet.2013.06.019 - DOI - PMC - PubMed
    1. Bernardi R., and Pandolfi P.P.. 2007. Structure, dynamics and functions of promyelocytic leukaemia nuclear bodies. Nat. Rev. Mol. Cell Biol. 8:1006–1016. 10.1038/nrm2277 - DOI - PubMed
    1. Bernardi R., Guernah I., Jin D., Grisendi S., Alimonti A., Teruya-Feldstein J., Cordon-Cardo C., Simon M.C., Rafii S., and Pandolfi P.P.. 2006. PML inhibits HIF-1alpha translation and neoangiogenesis through repression of mTOR. Nature. 442:779–785. 10.1038/nature05029 - DOI - PubMed
    1. Bieging K.T., Mello S.S., and Attardi L.D.. 2014. Unravelling mechanisms of p53-mediated tumour suppression. Nat. Rev. Cancer. 14:359–370. 10.1038/nrc3711 - DOI - PMC - PubMed

MeSH terms