. 2017 Nov;175(3):998-1017.
doi: 10.1104/pp.17.00961. Epub 2017 Sep 20.

PaCeQuant: A Tool for High-Throughput Quantification of Pavement Cell Shape Characteristics

Affiliations

PaCeQuant: A Tool for High-Throughput Quantification of Pavement Cell Shape Characteristics

Birgit Möller et al. Plant Physiol. 2017 Nov.

Abstract

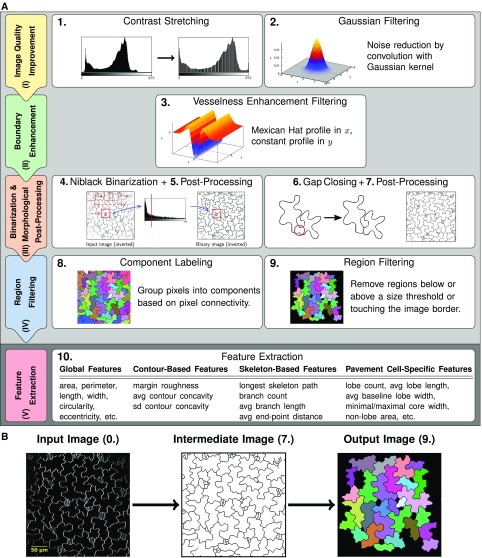
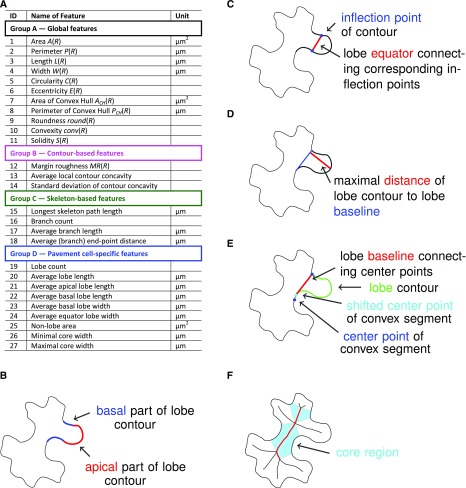
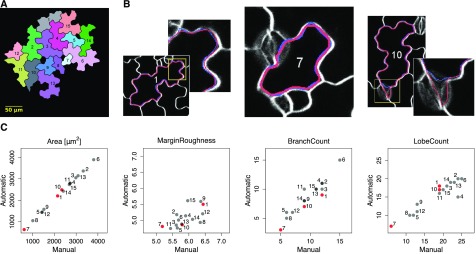
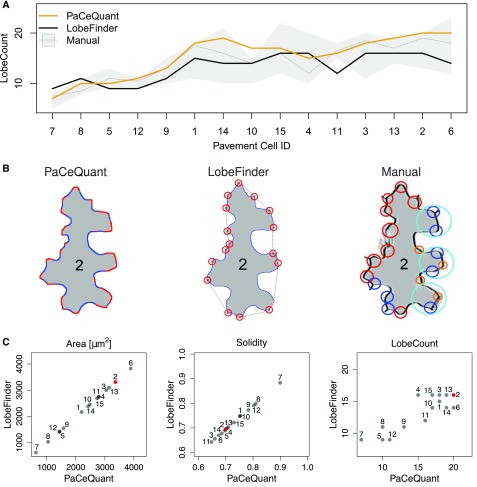
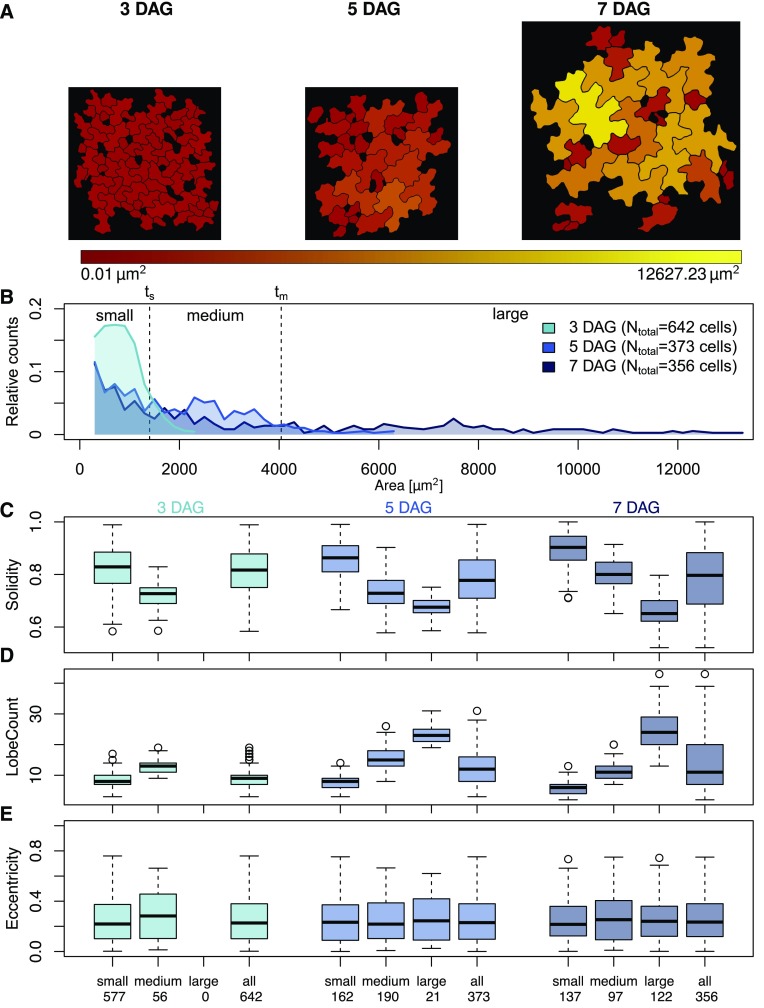
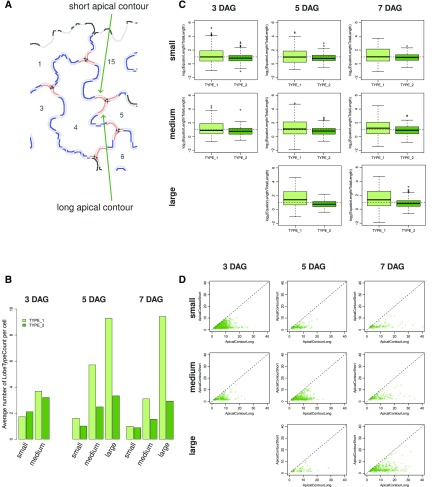
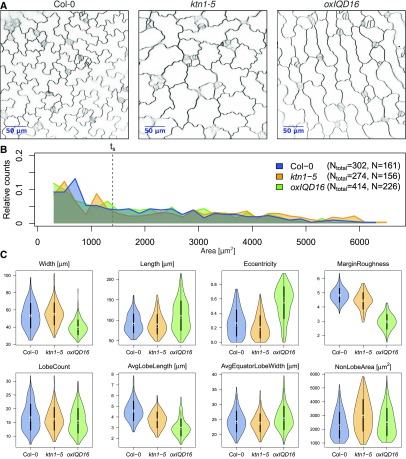
Pavement cells (PCs) are the most frequently occurring cell type in the leaf epidermis and play important roles in leaf growth and function. In many plant species, PCs form highly complex jigsaw-puzzle-shaped cells with interlocking lobes. Understanding of their development is of high interest for plant science research because of their importance for leaf growth and hence for plant fitness and crop yield. Studies of PC development, however, are limited, because robust methods are lacking that enable automatic segmentation and quantification of PC shape parameters suitable to reflect their cellular complexity. Here, we present our new ImageJ-based tool, PaCeQuant, which provides a fully automatic image analysis workflow for PC shape quantification. PaCeQuant automatically detects cell boundaries of PCs from confocal input images and enables manual correction of automatic segmentation results or direct import of manually segmented cells. PaCeQuant simultaneously extracts 27 shape features that include global, contour-based, skeleton-based, and PC-specific object descriptors. In addition, we included a method for classification and analysis of lobes at two-cell junctions and three-cell junctions, respectively. We provide an R script for graphical visualization and statistical analysis. We validated PaCeQuant by extensive comparative analysis to manual segmentation and existing quantification tools and demonstrated its usability to analyze PC shape characteristics during development and between different genotypes. PaCeQuant thus provides a platform for robust, efficient, and reproducible quantitative analysis of PC shape characteristics that can easily be applied to study PC development in large data sets.


Figures

Figure 1.
Figure 1.
Workflow of cell segmentation and feature extraction. A, Workflow implemented in PaCeQuant for automatic detection of cell outlines (part 1, light gray) and extraction of shape features (part 2, dark gray). In the first part, input images are processed in four basic stages (image quality improvement [I] to region filtering [IV], left column) via nine individual processing steps (panels on the right). In the second part, the feature extraction (step 10) is performed. B, Example of an input image (step 0), the processed image after outline extraction (step 7), and an image containing identified and filtered regions (step 9) used for feature extraction. For an overview of all image-processing steps, see Supplemental Figure S1.
Figure 2.
Figure 2.
List of PaCeQuant cell shape features and basic definitions of PC-specific features. A, List of cell shape features extracted by PaCeQuant and their units. For a detailed description of feature characteristics, see Supplemental Table S1. B to F, Basic definitions used for the quantification of PC-specific shape features, including (B) apical and basal parts of a lobe, (C) lobe equator, (D) lobe baseline, (E) neck point and neck point correction, and (F) core region dimensions.
Figure 3.
Figure 3.
Comparison between automatic and manual segmentation of cells based on PaCeQuant features. A, Sample image containing 15 individual cells, which were segmented fully automatically and manually. Numbers correspond to cell identifiers. B, Overlay of cell outlines detected by automatic (red) and manual (blue) segmentation for sample cells with high congruence and different cell sizes (left, ID 1, large cell; and middle, ID 7, small cell) and with local deviations (right, ID 10). C, Scatterplots of one exemplary feature for each of the four feature groups (see Fig. 2 and Supplemental Table S1) from a pairwise comparison between automatic and manual segmentation of all 15 cells. Cells shown in B are highlighted in red (for a summary of all features, see Supplemental Fig. S2).
Figure 4.
Figure 4.
Evaluation of lobe detection accuracy by comparison between PaCeQuant results with LobeFinder and manual lobe counting. A, Number of lobes detected in the 15 sample cells (ID 1–ID 15) after automatic segmentation by PaCeQuant (orange), LobeFinder (black), and by manual lobe counting (gray). For manual counting, lobes were analyzed by four independent researchers. The gray line represents the mean lobe number per cell of the four measurements; the gray strip represents the range of the independent measurements. Cells are sorted by their area from small (left) to large (right). B, Lobe count results in one exemplary cell (ID 2) analyzed with PaCeQuant (left, 20 lobes), LobeFinder (middle, 16 lobes), and manually (right, 13–20 lobes). Lobes identified by PaCeQuant or LobeFinder are marked in red. Lobes identified manually are marked in red (nine lobes), blue (eight lobes), pink (four lobes), and turquoise (three lobes) if identified by four, three, two, or at least one person, respectively. C, Pairwise comparison of features computed by PaCeQuant and LobeFinder in the sample set of the 15 automatically segmented cells. Scatterplots are shown for area, solidity, and lobe count (for a summary of all features, see Supplemental Fig. S3). The cell shown in B is highlighted in red.
Figure 5.
Figure 5.
Analysis of pavement cell shape characteristics during development. A, Epidermal pavement cell shape in the adaxial side of cotyledons from wild-type (Col-0) seedlings 3, 5, and 7 DAG. The color gradient represents the area of the detected cells (red, small to yellow, large). B, Relative distribution of cell areas in cotyledons of 3-, 5-, and 7-d-old seedlings. Cells were categorized into small cells (threshold ts ≤ 1400 µm2, which includes 90% of the cells in 3-d-old seedlings), medium-sized cells (threshold tm ≤ 4042 µm2, which includes 90% of the cells in 5-d-old seedlings that exceed ts), and large cells (≥tm), which represent the different stages of cell differentiation. C to E, Quantification of cell shape features during differentiation. Cells were grouped according to (B) or treated as a single input set (all). Numbers on the x axis refer to the number of cells analyzed per sample set. Feature values are shown in box plots. Results are medians; boxes range from first to third quartile. For a summary of all features and statistical analysis of feature values, see Supplemental Figure S5. (C) Solidity decreases with increasing cell size and differentiation, which is consistent with (D) an increased number of lobes, while other parameters, as shown for (E) eccentricity are largely unaffected during differentiation.
Figure 6.
Figure 6.
Analysis of type I and type II lobes and quantification of lobe characteristics. A, Image of an exemplary group of adjacent PCs after neighborhood analysis of individual lobes. Apical contours of type I and type II lobes are shown in blue and red, respectively. In type II lobes, three-cell contact points (shown as black dots) separate the lobe contours corresponding to the contact sides with the two neighboring cells (referred to as short and long contour segments). B to D, Analysis of lobe characteristics in PCs from the three developmental time points (3 DAG, 5 DAG, and 7 DAG) and the three size categories (small, medium, large; see Fig. 5). For an overview of quantified lobe features and statistical analysis, see Supplemental Figure S6. B, Bar plots showing the average number of type I (TYPE_1) and type II (TYPE_2) lobes per PC. C, Average ratio of lobe equator length to total contour length in type I and type II lobes in a logarithmic scale. D, Analysis of the length of the two parts of type II lobe contours that span the distances from the lobe equator to the three-cell contact point. Scatterplots of all individual type II lobes compare the short (ApicalContourShort) and long (ApicalContourLong) fragments.
Figure 7.
Figure 7.
Phenotypic analysis of pavement cell shape mutants. PC shape analysis in cotyledons of 5-d-old seedlings from wild type (Col-0) and two mutants, ktn1-5 and transgenic Pro-35S:IQD16 (oxIQD16) plants. A, Inverted confocal images of wild type and the two mutants stained with FM4-64. B, Relative distribution of cell areas in the three data sets. Numbers in the legend refer to the total number of cells (Ntotal) from 13 images of the wild type, 13 of ktn1-5, and 17 of oxIQD16. Cells larger than size threshold ts = 1,400 μm2 (N) were used for further analysis (see Fig. 5). C, Violin plots of value distributions for four global (top) and four PC-specific features (bottom). Circles and crosses refer to medians and means; the vertical black lines in each category represent the sd (thick lines) and the 95% confidence intervals (thin lines). The width of each violin box represents the local distribution of feature values along the y axes. For a summary of all features and a statistical analysis, see Supplemental Figure S7.

Similar articles

Cited by

References

    1. Abel S, Bürstenbinder K, Müller J (2013) The emerging function of IQD proteins as scaffolds in cellular signaling and trafficking. Plant Signal Behav 8: e24369. - PMC - PubMed
    1. Abel S, Savchenko T, Levy M (2005) Genome-wide comparative analysis of the IQD gene families in Arabidopsis thaliana and Oryza sativa. BMC Evol Biol 5: 72. - PMC - PubMed
    1. Andriankaja M, Dhondt S, De Bodt S, Vanhaeren H, Coppens F, De Milde L, Mühlenbock P, Skirycz A, Gonzalez N, Beemster GTS, et al. (2012) Exit from proliferation during leaf development in Arabidopsis thaliana: a not-so-gradual process. Dev Cell 22: 64–78 - PubMed
    1. Bai Y, Falk S, Schnittger A, Jakoby MJ, Hülskamp M (2010) Tissue layer specific regulation of leaf length and width in Arabidopsis as revealed by the cell autonomous action of ANGUSTIFOLIA. Plant J 61: 191–199 - PubMed
    1. Bannigan A, Baskin TI (2005) Directional cell expansion—turning toward actin. Curr Opin Plant Biol 8: 619–624 - PubMed

LinkOut - more resources