

Comparing two sequential Monte Carlo samplers for exact and approximate Bayesian inference on biological models
- PMID: 28931636
- PMCID: PMC5636270
- DOI: 10.1098/rsif.2017.0340
Comparing two sequential Monte Carlo samplers for exact and approximate Bayesian inference on biological models
Abstract
Bayesian methods are advantageous for biological modelling studies due to their ability to quantify and characterize posterior variability in model parameters. When Bayesian methods cannot be applied, due either to non-determinism in the model or limitations on system observability, approximate Bayesian computation (ABC) methods can be used to similar effect, despite producing inflated estimates of the true posterior variance. Owing to generally differing application domains, there are few studies comparing Bayesian and ABC methods, and thus there is little understanding of the properties and magnitude of this uncertainty inflation. To address this problem, we present two popular strategies for ABC sampling that we have adapted to perform exact Bayesian inference, and compare them on several model problems. We find that one sampler was impractical for exact inference due to its sensitivity to a key normalizing constant, and additionally highlight sensitivities of both samplers to various algorithmic parameters and model conditions. We conclude with a study of the O'Hara-Rudy cardiac action potential model to quantify the uncertainty amplification resulting from employing ABC using a set of clinically relevant biomarkers. We hope that this work serves to guide the implementation and comparative assessment of Bayesian and ABC sampling techniques in biological models.
Keywords: approximate Bayesian computation; cardiac modelling; identifiability; sequential Monte Carlo; summary statistics.
© 2017 The Author(s).
Conflict of interest statement
We declare we have no competing interests.
Figures

 . Plots (b) show the true posterior (blue) along with empirical posteriors that would result from employing a sampler with an acceptance kernel normalized to a value greater than (i), slightly less than (ii) or much less than (iii) its true modal value.


 , where
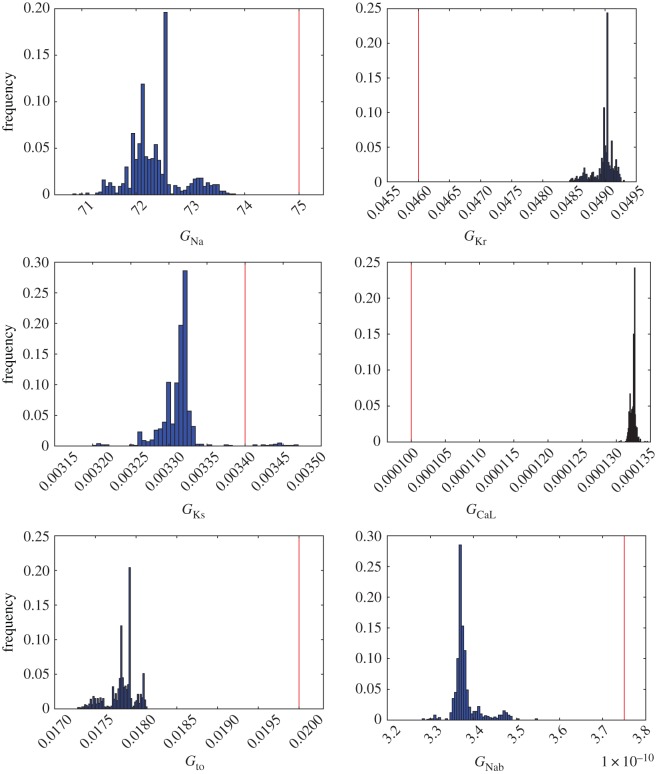
  is the maximum-likelihood estimate of the slope parameter. (a) Histogram of particle frequencies, with the red vertical line indicating the theoretical mean. (b) Quantile–quantile plot comparing the PPF of the estimated posterior (x-axis) to that of the theoretical posterior (y-axis) at 100 equally spaced quantiles. (Online version in colour.)

Similar articles
-
Bayesian inference for fitting cardiac models to experiments: estimating parameter distributions using Hamiltonian Monte Carlo and approximate Bayesian computation.Med Biol Eng Comput. 2023 Jan;61(1):75-95. doi: 10.1007/s11517-022-02685-y. Epub 2022 Nov 2. Med Biol Eng Comput. 2023. PMID: 36322242 Free PMC article.
-
Approximate Bayesian computation scheme for parameter inference and model selection in dynamical systems.J R Soc Interface. 2009 Feb 6;6(31):187-202. doi: 10.1098/rsif.2008.0172. J R Soc Interface. 2009. PMID: 19205079 Free PMC article.
-
A comparison of approximate versus exact techniques for Bayesian parameter inference in nonlinear ordinary differential equation models.R Soc Open Sci. 2020 Mar 11;7(3):191315. doi: 10.1098/rsos.191315. eCollection 2020 Mar. R Soc Open Sci. 2020. PMID: 32269786 Free PMC article.
-
Inference-based assessment of parameter identifiability in nonlinear biological models.J R Soc Interface. 2018 Jul;15(144):20180318. doi: 10.1098/rsif.2018.0318. J R Soc Interface. 2018. PMID: 30021928 Free PMC article.
-
Approximate Bayesian inference for complex ecosystems.F1000Prime Rep. 2014 Jul 17;6:60. doi: 10.12703/P6-60. eCollection 2014. F1000Prime Rep. 2014. PMID: 25152812 Free PMC article. Review.
Cited by
-
Bayesian inference for fitting cardiac models to experiments: estimating parameter distributions using Hamiltonian Monte Carlo and approximate Bayesian computation.Med Biol Eng Comput. 2023 Jan;61(1):75-95. doi: 10.1007/s11517-022-02685-y. Epub 2022 Nov 2. Med Biol Eng Comput. 2023. PMID: 36322242 Free PMC article.
-
Bayesian, Likelihood-Free Modelling of Phenotypic Plasticity and Variability in Individuals and Populations.Front Genet. 2019 Sep 20;10:727. doi: 10.3389/fgene.2019.00727. eCollection 2019. Front Genet. 2019. PMID: 31616460 Free PMC article.
-
Efficient exact inference for dynamical systems with noisy measurements using sequential approximate Bayesian computation.Bioinformatics. 2020 Jul 1;36(Suppl_1):i551-i559. doi: 10.1093/bioinformatics/btaa397. Bioinformatics. 2020. PMID: 32657404 Free PMC article.
-
CardioFit: a WebGL-based tool for fast and efficient parametrization of cardiac action potential models to fit user-provided data.R Soc Open Sci. 2025 Aug 27;12(8):250048. doi: 10.1098/rsos.250048. eCollection 2025 Aug. R Soc Open Sci. 2025. PMID: 40881984 Free PMC article.
-
Modeling the Natural History and Screening Effects of Colorectal Cancer Using Both Adenoma and Serrated Neoplasia Pathways: The Development, Calibration, and Validation of a Discrete Event Simulation Model.MDM Policy Pract. 2023 Jan 19;8(1):23814683221145701. doi: 10.1177/23814683221145701. eCollection 2023 Jan-Jun. MDM Policy Pract. 2023. PMID: 36698854 Free PMC article.
References
-
- Wilkinson DJ. 2011. Stochastic modelling for systems biology, 2nd edn Mathematical and Computational Biology London, UK: CRC.
-
- Louch WE, Land S, Niederer S, Alexander S. 2014. Strange bedfellows: biologists and mathematical modelers tie the knot on cardiomyocyte calcium homeostasis. Drug Discov. Today 14, 11–16. (10.1016/j.ddmod.2014.05.001) - DOI
-
- Noble D, Rudy Y. 2001. Models of cardiac ventricular action potentials: iterative interactions between experiment and simulation. Phil. Trans. R. Soc. Lond. A 359, 1127–1142. (10.1098/rsta.2001.0820) - DOI
Publication types
MeSH terms
Grants and funding
LinkOut - more resources
Full Text Sources
Other Literature Sources
