

Region-specific RNA m6A methylation represents a new layer of control in the gene regulatory network in the mouse brain
- PMID: 28931651
- PMCID: PMC5627058
- DOI: 10.1098/rsob.170166
Region-specific RNA m6A methylation represents a new layer of control in the gene regulatory network in the mouse brain
Abstract
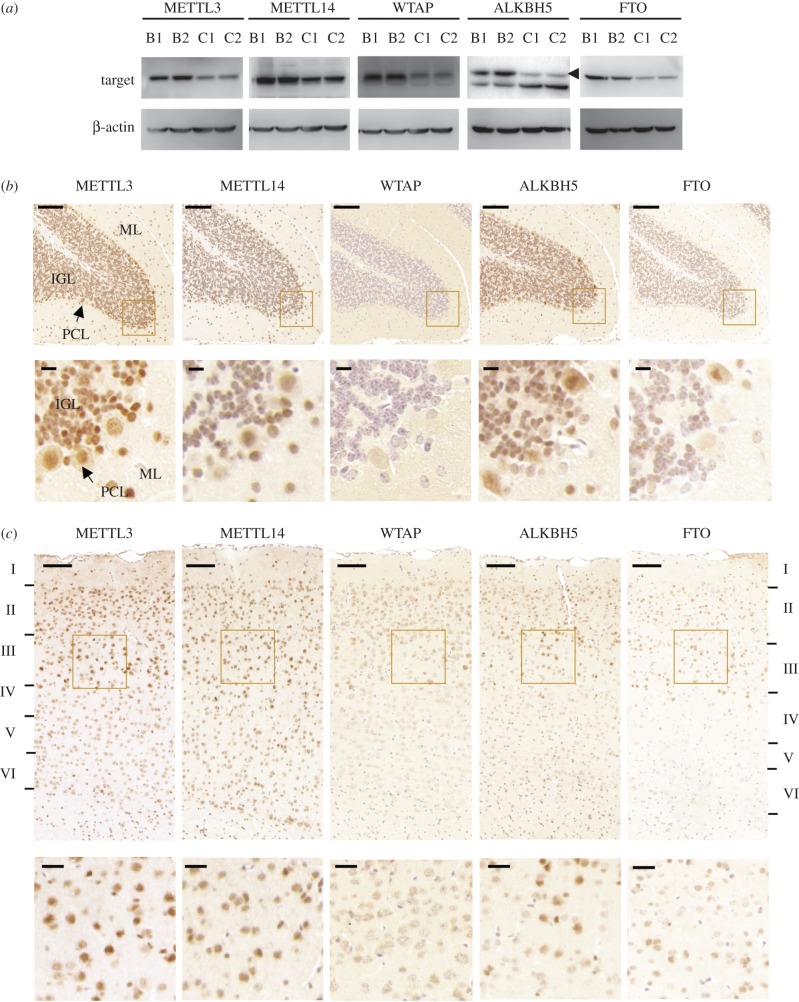
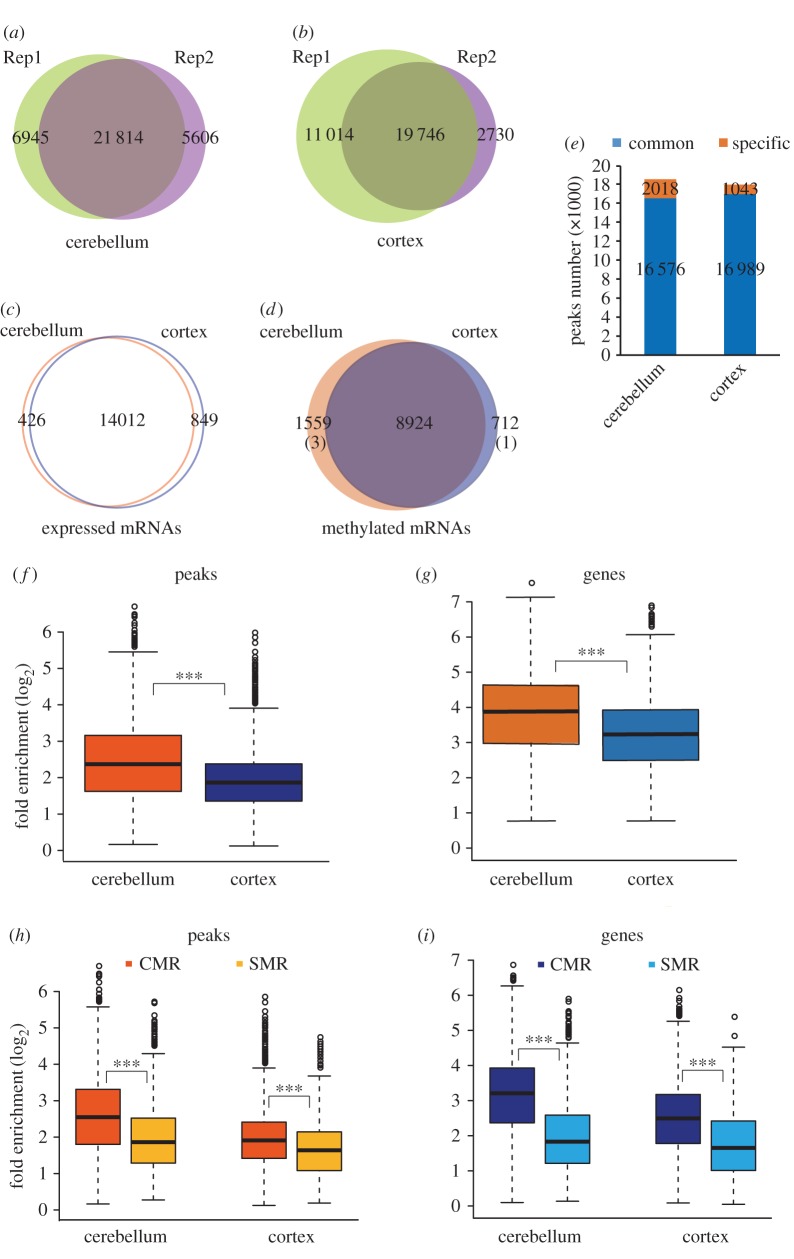
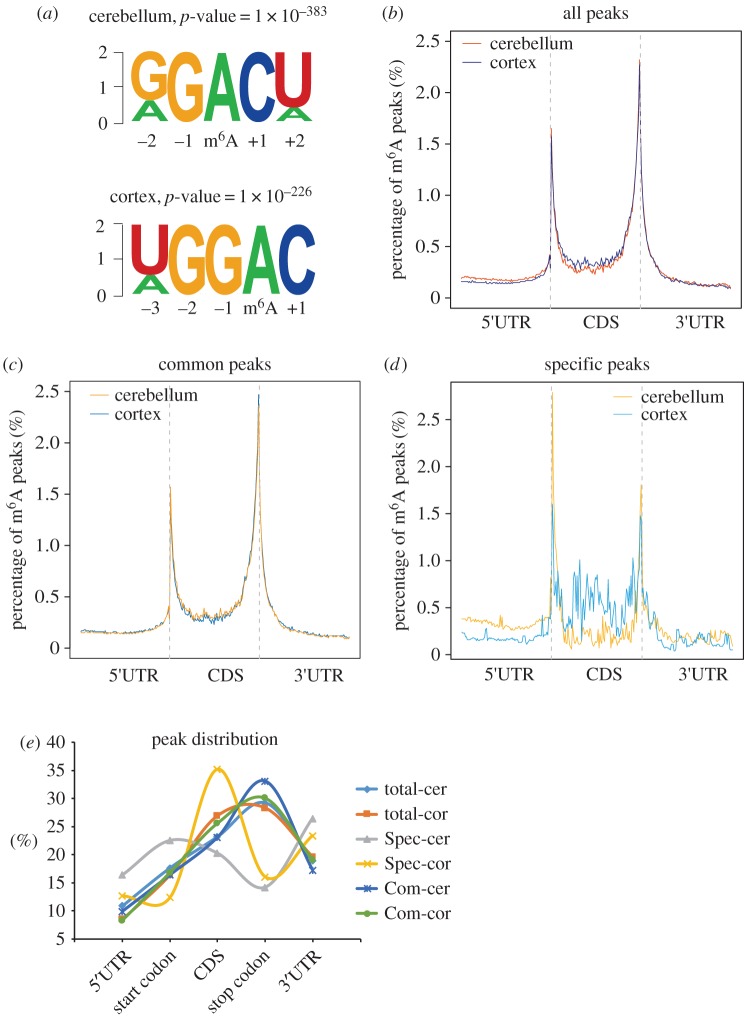
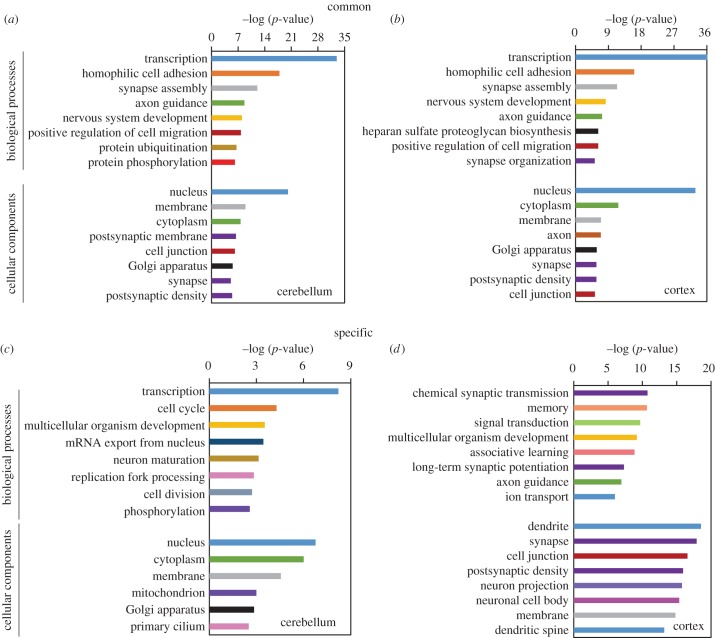
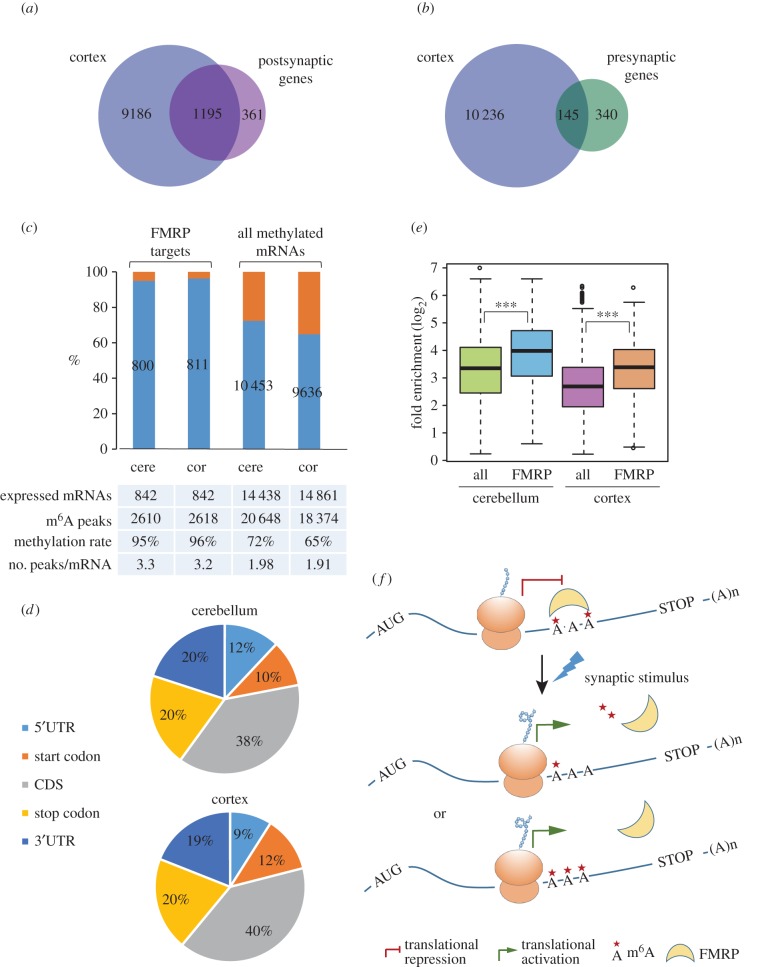
N6-methyladenosine (m6A) is the most abundant epitranscriptomic mark found on mRNA and has important roles in various physiological processes. Despite the relatively high m6A levels in the brain, its potential functions in the brain remain largely unexplored. We performed a transcriptome-wide methylation analysis using the mouse brain to depict its region-specific methylation profile. RNA methylation levels in mouse cerebellum are generally higher than those in the cerebral cortex. Heterogeneity of RNA methylation exists across different brain regions and different types of neural cells including the mRNAs to be methylated, their methylation levels and methylation site selection. Common and region-specific methylation have different preferences for methylation site selection and thereby different impacts on their biological functions. In addition, high methylation levels of fragile X mental retardation protein (FMRP) target mRNAs suggest that m6A methylation is likely to be used for selective recognition of target mRNAs by FMRP in the synapse. Overall, we provide a region-specific map of RNA m6A methylation and characterize the distinct features of specific and common methylation in mouse cerebellum and cerebral cortex. Our results imply that RNA m6A methylation is a newly identified element in the region-specific gene regulatory network in the mouse brain.
Keywords: N6-methyladenosine; RNA methylation; epitranscriptomic mark; mouse cerebellum; mouse cerebral cortex.
© 2017 The Authors.
Conflict of interest statement
The authors declare that they have no competing interests.
Figures

Similar articles
-
Fragile X mental retardation protein modulates the stability of its m6A-marked messenger RNA targets.Hum Mol Genet. 2018 Nov 15;27(22):3936-3950. doi: 10.1093/hmg/ddy292. Hum Mol Genet. 2018. PMID: 30107516 Free PMC article.
-
The RNA-binding protein FMRP facilitates the nuclear export of N6-methyladenosine-containing mRNAs.J Biol Chem. 2019 Dec 27;294(52):19889-19895. doi: 10.1074/jbc.AC119.010078. Epub 2019 Nov 21. J Biol Chem. 2019. PMID: 31753916 Free PMC article.
-
FMRP Modulates Neural Differentiation through m6A-Dependent mRNA Nuclear Export.Cell Rep. 2019 Jul 23;28(4):845-854.e5. doi: 10.1016/j.celrep.2019.06.072. Cell Rep. 2019. PMID: 31340148 Free PMC article.
-
RNA N6-methyladenosine methylation in post-transcriptional gene expression regulation.Genes Dev. 2015 Jul 1;29(13):1343-55. doi: 10.1101/gad.262766.115. Genes Dev. 2015. PMID: 26159994 Free PMC article. Review.
-
Role of identified RNA N6-methyladenosine methylation in liver.Anal Biochem. 2019 Aug 1;578:45-50. doi: 10.1016/j.ab.2019.05.005. Epub 2019 May 7. Anal Biochem. 2019. PMID: 31075230 Review.
Cited by
-
m6a methylation orchestrates IMP1 regulation of microtubules during human neuronal differentiation.Nat Commun. 2024 Jun 6;15(1):4819. doi: 10.1038/s41467-024-49139-7. Nat Commun. 2024. PMID: 38844464 Free PMC article.
-
Fragile X mental retardation protein modulates the stability of its m6A-marked messenger RNA targets.Hum Mol Genet. 2018 Nov 15;27(22):3936-3950. doi: 10.1093/hmg/ddy292. Hum Mol Genet. 2018. PMID: 30107516 Free PMC article.
-
NMDAR mediated dynamic changes in m6A inversely correlates with neuronal translation.Sci Rep. 2022 Jul 5;12(1):11317. doi: 10.1038/s41598-022-14798-3. Sci Rep. 2022. PMID: 35790863 Free PMC article.
-
Adenosine methylation as a molecular imprint defining the fate of RNA.FEBS Lett. 2018 Sep;592(17):2845-2859. doi: 10.1002/1873-3468.13107. Epub 2018 May 31. FEBS Lett. 2018. PMID: 29782652 Free PMC article. Review.
-
Relaxed initiation pausing of ribosomes drives oncogenic translation.Sci Adv. 2021 Feb 17;7(8):eabd6927. doi: 10.1126/sciadv.abd6927. Print 2021 Feb. Sci Adv. 2021. PMID: 33597240 Free PMC article.
References
-
- Liu N, Dai Q, Zheng G, He C, Parisien M, Pan T. 2015. N6-methyladenosine-dependent RNA structural switches regulate RNA–protein interactions. Nature 518, 560–564. (doi:10.1038/nature14234) - DOI - PMC - PubMed
-
- Niu Y, Zhao X, Wu YS, Li MM, Wang XJ, Yang YG. 2013. N6-methyl-adenosine (m6A) in RNA: an old modification with a novel epigenetic function. Genomics Proteomics Bioinform. 11, 8–17. (doi:10.1016/j.gpb.2012.12.002) - DOI - PMC - PubMed
-
- Fu Y, Dominissini D, Rechavi G, He C. 2014. Gene expression regulation mediated through reversible m(6)A RNA methylation. Nat. Rev. Genet. 15, 293–306. (doi:10.1038/nrg3724) - DOI - PubMed
-
- Xiao W, et al. 2016. Nuclear m(6)A reader YTHDC1 regulates mRNA splicing. Mol. Cell. 61, 507–519. (doi:10.1016/j.molcel.2016.01.012) - DOI - PubMed
-
- Roundtree IA, He C. 2016. Nuclear m6A reader YTHDC1 regulates mRNA splicing. Trends Genet. 32, 320–321. (doi:10.1016/j.tig.2016.03.006) - DOI - PubMed
MeSH terms
Substances
LinkOut - more resources
Full Text Sources
Other Literature Sources
