. 2017 Sep 20;9(408):eaan3085.
doi: 10.1126/scitranslmed.aan3085.

Combined OX40L and mTOR blockade controls effector T cell activation while preserving Treg reconstitution after transplant

Affiliations

Combined OX40L and mTOR blockade controls effector T cell activation while preserving Treg reconstitution after transplant

Victor Tkachev et al. Sci Transl Med. .

Abstract

A critical question facing the field of transplantation is how to control effector T cell (Teff) activation while preserving regulatory T cell (Treg) function. Standard calcineurin inhibitor-based strategies can partially control Teffs, but breakthrough activation still occurs, and these agents are antagonistic to Treg function. Conversely, mechanistic target of rapamycin (mTOR) inhibition with sirolimus is more Treg-compatible but is inadequate to fully control Teff activation. In contrast, blockade of OX40L signaling has the capacity to partially control Teff activation despite maintaining Treg function. We used the nonhuman primate graft-versus-host disease (GVHD) model to probe the efficacy of combinatorial immunomodulation with sirolimus and the OX40L-blocking antibody KY1005. Our results demonstrate significant biologic activity of KY1005 alone (prolonging median GVHD-free survival from 8 to 19.5 days), as well as marked, synergistic control of GVHD with KY1005 + sirolimus (median survival time, >100 days; P < 0.01 compared to all other regimens), which was associated with potent control of both TH/TC1 (T helper cell 1/cytotoxic T cell 1) and TH/TC17 activation. Combined administration also maintained Treg reconstitution [resulting in an enhanced Treg/Teff ratio (40% over baseline) in the KY1005/sirolimus cohort compared to a 2.9-fold decrease in the unprophylaxed GVHD cohort]. This unique immunologic signature resulted in transplant recipients that were able to control GVHD for the length of analysis and to down-regulate donor/recipient alloreactivity despite maintaining anti-third-party responses. These data indicate that combined OX40L blockade and sirolimus represents a promising strategy to induce immune balance after transplant and is an important candidate regimen for clinical translation.


Figures

Figure 1
Figure 1. OX40 and OX40L are up-regulated during aGVHD
(A) Representative flow cytometry plots showing OX40 expression on peripheral blood CD4 and CD8 T cells obtained from healthy, immunologically naïve Rhesus macaques (Healthy Ctrl) or from allo-HCT recipients transplanted without immunoprophylaxis, performed at terminal analysis (No Rx). (B) The percentages of OX40+ T cells in CD28+CD95- (Naïve), CD28+CD95+ (CM) and CD28-CD95+ (EM) CD4 T cells were quantified in healthy immunologically naïve animals (Healthy Ctrl, n=6; Black) and at terminal analysis in recipients transplanted without GVHD immunoprophylaxis (No Rx, n=3; Red) from a single experiment shown in (A). Data represent one of 2 similar experiments. Statistical analysis was performed using the Student's t-test ****p<0.001. (C) Peripheral blood from the healthy immunologically naïve animals (n=5) and after allo-HCT recipients transplanted without GVHD immunoprophylaxis, performed at terminal analysis (n=4) were activated with PMA/Ionomycin and cultured 4 hours. Numbers of T cells co-producing ≥ 2 cytokines simultaneously were quantified in OX40- and OX40+ CD4 T cells subsets. Statistical analysis was performed using a paired t-test (between OX40- and OX40+ CD4 T cells belonging to the same animal) or an unpaired Student's t-test (between different experimental groups). *p<0.05, **p<0.01, NS – not significant. (D) Relative expression (Log2 normalized fluorescent intensity signal) of the TNFRSF4 gene transcript (encoding OX40) in CD3+CD20- T cells, flow cytometrically sorted from the peripheral blood of healthy immunologically naïve animals (Healthy Ctrl, n=46; Black), following autologous HCT at day 100 post-transplant (Auto, n=4; Gray), following allogeneic HCT at the time of terminal analysis in experimental groups without GVHD immunoprophylaxis (No Rx, n=4; Red), prophylaxed with Tacrolimus/Methotrexate (Tac/MTX, n=3; Purple), or with sirolimus (n=4; Orange). Horizontal significance bars denote comparisons with a moderated t-statistic <0.05 corrected for multiple hypotheses testing using the Benjamini-Hochberg procedure. (E) Relative expression (Log2 normalized fluorescent intensity signal) of the TNFRSF4 gene transcript (encoding OX40) in human T cells, flow cytometrically sorted from the peripheral blood of HCT recipients with (n=7; red symbols) or without (n=7; black symbols) GVHD on day 28 post-transplant. Gene expression was measured using the Human Transcriptome 2.0 Array (Affymetrix) as detailed in Methods. Statistical analysis was performed using Student's t-test, *p<0.05. (F) The percentage of human CD3 T cells, isolated from healthy controls and labeled with CellTrace Violet dye, which underwent proliferation in an allogeneic mixed lymphocyte reaction in the absence (No antibodies, n=9; Red) or the presence (n=9; Cyan) of 150 μg/mL KY1005. ***p<0.001 using a paired t-test. (G) Representative flow cytometry plots showing anti-OX40L staining on CD11c+ myeloid dendritic cell (mDC) and CD123+ plasmacytoid dendritic cells (pDC), both gated on HLA-DR+CD3-CD56-CD20- cells (left panel) and the relative number of OX40L+ mDC and pDC (right panel), as shown in Figure S2. Flow cytometry was performed on lymph node cells from HC (n=5) and from No Rx animals (n=4). Staining is shown for mDC (top panel) and pDC (bottom panel) and is representative of 2 independent experiments. Statistical analysis was performed using Student's t-test, *p<0.05.
Figure 2
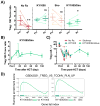
Figure 2. Impact of KY1005 on T cell expansion and cytokine secretion after HCT
(A) Experimental schema detailing the HCT protocol and KY1005-based GVHD immunoprophylaxis regimen used in this study. (B) Ki67 expression in peripheral blood CD4 (left panel) and CD8 (right panel) T cells before after allogeneic HCT in recipients without GVHD immunoprophylaxis (No Rx, number of animals included to this analysis (n) =7; Red) or prophylaxed with KY1005 (n=4; Cyan). Statistical analysis was performed using Holm-Sidak multiple-comparison t-test, *p<0.05. (C) OX40 expression on peripheral blood CD4 T cells was quantified before and following allogeneic HCT in experiments shown in (B), and the percentages of OX40+ CD4 T cells (left panel) and the absolute numbers of OX40+ and OX40- CD4 T cells (right panel) were quantified on day 7 after allo-HCT in untreated (No Rx, n=7; Red) and prophylaxed with KY1005 (KY1005, n=4; Cyan) cohorts. Statistical analysis was performed using Holm-Sidak multiple-comparison t-test (on left panel) or Student t-test (on right panel), *p<0.05. (D) The relative numbers of CD28+CD95- Naïve (TN), CD28+CD95+ central memory (TCM) CD4 T cells in peripheral blood before and at different time points following allo-HCT in recipients without immunoprophylaxis (No Rx, n=7; Red) or prophylaxed with KY1005 (n=4; Cyan). Statistical analysis was performed using Holm-Sidak multiple-comparison t-test, *p<0.05, NS – not significant. (E) Peripheral blood mononuclear cells isolated at the time of terminal analysis from allo-HCT recipients without immunoprophylaxis (No Rx, n=7; Red) or prophylaxed with KY1005 (n=4; Cyan) were activated with PMA/Ionomycin and cultured 4 hours as detailed in Methods, then were stained for CD3, CD4, CD8, CD14, CD20, OX40, IFNγ, TNFα, IL-2 and IL-17A. Numbers of T cells producing the indicated cytokines were quantified in OX40+ CD4 T cells subset. Statistical analysis was performed using Student's t-test, *p<0.05. (F) Spleen cells were isolated from healthy, immunologically-naïve Rhesus macaques (Healthy Ctrl, n=5; Black) or from allo-HCT recipients either without immunoprophylaxis (No Rx, n=7; Red) or prophylaxed with KY1005 (n=4; Cyan) at the time of terminal analysis. The percentage of OX40+ cells was quantified in Treg (CD25+CD127-FoxP3+) and Tconv (CD25-CD127+) CD4 T cell subsets and presented as the percentage of total CD4 T cells. Statistical analysis was performed using Student's t-test. **p<0.01. (G) Survival curves for recipients after allo-HCT in the unprophylaxed cohort (No Rx, n=11; Red) and in cohort prophylaxed with KY1005 (n=4; Cyan). *p<0.05 using the long-rank method. (H) The clinical score of recipients after allo-HCT in the unprophylaxed cohort (No Rx, n=11; Red) and in cohort prophylaxed with KY1005 (n=4; Cyan). Differences between clinical scores were analyzed using the Holm-Sidak multiple comparisons t-test, *p<0.05.
Figure 3
Figure 3. KY1005/Sirolimus combination prophylaxis synergistically controls T cell activation after HCT
(A) Experimental schema detailing the HCT protocol, sirolimus and KY1005/Sirolimus-based GVHD immunoprophylaxis regimens used in this study. (B) Ki67 expression in NHP peripheral blood CD4 (top panel) and CD8 (bottom panel) T cells after allo-HCT in recipients prophylaxed with sirolimus (n=10; Orange) and KY1005/Sirolimus (n=5; Green). Statistical analysis was performed using the Holm-Sidak multiple-comparison t-test, *p<0.05. (C) The relative (left panels) and absolute (right panels) numbers of CD28+CD95- Naïve (TN) CD4 (top) and CD8 (bottom) T cells in the peripheral blood measured longitudinally after allo-HCT in recipients prophylaxed with sirolimus (n=10; Orange) or KY1005/Sirolimus (n=5; Green). Statistical analysis was performed using the Holm-Sidak multiple-comparison t-test, *p<0.05. (D) The relative numbers of CD28+CD95+ central memory (TCM) CD4 (top panel) and CD8 (bottom panel) T cells in the peripheral blood of allo-HCT recipients prophylaxed with sirolimus (n=10; Orange) or KY1005/Sirolimus (n=5; Green). (E) Representative GSEA plots performed as previously described (25) showing naïve T cell-related gene sets over-represented in KY1005/Sirolimus (n=4) versus KY1005 (n=3; left panels) and KY1005/Sirolimus versus sirolimus (n=4; Right panels). All depicted gene sets are enriched in KY1005/Sirolimus cohort with FDR<0.05.
Figure 4
Figure 4. KY1005/Sirolimus combination prophylaxis permits robust hematopoietic reconstitution after allogeneic HCT
(A) Donor chimerism, determined using microsatellite analysis, in flow-cytometrically-sorted CD3+CD20- T cells following allo-HCT. Chimerism for the No Rx (n=7), KY1005 (n=4) and sirolimus (n=5) cohorts are shown at terminal analysis. Chimerism for the KY1005/Sirolimus cohort (n=5) is shown at Day 28, 60 and 100 after transplant. (B-F) Absolute blood cell counts: absolute CD3+CD14-CD20- T cell counts (T cells; B), absolute neutrophil counts (ANC; C), absolute lymphocyte counts (ALC; D), absolute platelet counts (PLT; E), in allo-HCT recipients from the KY1005/Sirolimus cohort (n=5; Green) and autologous HCT cohort (n=6; Gray). Data shown as mean (line with symbols) with SEM (shaded area around the line). (G) CMV viral load in the peripheral blood of auto-HCT recipients (Gray lines) and KY1005/Sirolimus-prophylaxed allo-HCT recipients (Green lines). Each line represents an individual recipient.
Figure 5
Figure 5. KY1005/Sirolimus prophylaxis enables reconstitution of Treg cells after allogeneic HCT
(A) The ratio of CD25+CD127-FoxP3+ Tregs to 100 Tconv cells in the peripheral blood is shown before HCT (Pre) and at terminal analysis (Nx). Each line represents a single transplant recipient. Individual graphs indicate the different GVHD prophylaxis regimens: No immunoprophylaxis (No Rx, n=7; Red), KY1005 (n=4; Cyan), sirolimus (n=4; Orange) and KY1005/Sirolimus (n=5; Green). Paired t-test was used for statistical analysis. *p<0.05, ** p <0.01 NS – not significant. (B) The ratio of CD25+CD127-FoxP3+ Treg to 100 Tconv cells in the peripheral blood tracked longitudinally in the KY1005/Sirolimus cohort (n=5). (C) The absolute numbers of CD25+CD127-FoxP3+ Treg cells in the peripheral blood tracked longitudinally by flow cytometry in No Rx (n=7), KY1005 (n=4), Sirolimus (n=9), and KY1005/Sirolimus (n=5) cohorts. (D) Representative GSEA plots performed as previously described(25) showing Treg-related gene sets over-represented with FDR q<0.05 in KY1005/Sirolimus (n=4) versus KY1005 (n=3; Left) or versus sirolimus (n=4; Right) cohorts.
Figure 6
Figure 6. KY1005/Sirolimus prophylaxis results in long-term GVHD-free survival following allogeneic HCT
(A, B) The combined clinical score (A), as detailed in Methods, and survival (B) of recipients after allo-HCT in cohorts prophylaxed with KY1005 (n=4; Cyan), sirolimus (n=6; Orange) and KY1005/Sirolimus (n=5; Green). Differences between clinical scores were analyzed using the Holm-Sidak multiple comparisons t-test, *p<0.05. Differences in survival between experimental cohorts were analyzed using the long-rank method **p<0.01. (C, D) Representative flow cytometry plots showing CellTrace Dilution profiles of CD3+ (either CD4+ or CD8+) CD14/CD20- T cells from donors (C) and recipients at terminal analysis (D) stimulated by donor PBMC (left), recipient PBMC (center) or third-party healthy control PBMC (right) after ex-vivo culture for 7 days. Inset numbers in Figure 6 C,D indicate the percentage of cells undergoing ≥ 1 divisions. (E) The calculated Proliferation Indexes from recipient MLR cultures (Green symbols) were normalized to the values of the Proliferation Indexes of the corresponding donor samples (Black symbols), and then plotted in pair-wise fashion. The paired t-test was used for statistical analysis. *p<0.05, NS – not significant.
Figure 7
Figure 7. Enrichment of Jak/STAT and Type 1 IFN pathways in T cells from the KY1005/Sirolimus immunoprophylaxis cohort
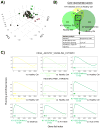
(A) First, second and third principal component (PC) projections reveal clustering of transplanted animals by immunoprophylactic regimens: Healthy controls (n=46; Black), No immunoprophylaxis (No Rx, n=4; Red), Sirolimus (n=4; Orange), KY1005 (n=3; Cyan) and KY1005/Sirolimus (n=4; Green). Each dot represents an individual array sample. (B) Weighted Venn diagram showing the number of transcripts over-represented in the KY1005/Sirolimus cohort at different time points after transplant compared to HC (top diagram). Overlapping areas indicate over-represented transcripts shared between multiple comparisons. 101 transcripts, over-represented in the KY1005/Sirolimus cohort at all time-points, were then used for pathway analysis using DAVID (26), (bottom table). (C) Representative GSEA plots performed as previously described (25) showing JAK/STAT pathway-related gene sets (top panels) and type I Interferon signaling-related gene set over-represented in gene arrays from the KY1005/Sirolimus cohort at Day 14 (n=5), 28 (n=5) and 100 (n=4) post-transplants versus HC (n=46; middle panels), or showing type I Interferon signaling-related gene sets over-represented in KY1005/Sirolimus (n=4) versus T cells purified from autologous HCT recipients at day 100 (n=4), from the sirolimus cohort (n=4) and from the KY1005 cohort (n=3; bottom panels).
Figure 8
Figure 8. KY1005/Sirolimus prophylaxis efficiently controls both Th/Tc1- and Th/Tc17-driven alloimmunity
(A) Relative expression (Log2 normalized fluorescent intensity signal) of GZMA and MKI67 gene transcripts (encoding Granzyme A, Ki67 and RORγt, respectively) in CD3+CD20- T cells, flow-cytometrically sorted from the peripheral blood of animals from the indicated experimental cohorts. Gene expression was measured using GeneChip Rhesus Macaque Genome Array (Affimetrix) as detailed in Methods. * denotes comparisons with a moderated t-statistic <0.05 corrected for multiple hypotheses testing using the Benjamini-Hochberg procedure between the indicated experimental groups. (B) Representative GSEA plots performed as previously described (25) showing Th/Tc1-related gene sets under-represented in KY1005/Sirolimus on day 14 (n=5) versus KY1005 (n=3; Left panels) or versus sirolimus (n=4; Right panels) cohorts at the time of necropsy. (C) Relative expression (Log2 normalized fluorescent intensity signal) of RORC gene transcript (encoding RORγt) in CD3+CD20- T cells. T cell isolation, gene expression measurement, and statistical analysis were performed as in (A). *p <0.05 using moderated t-test with Benjamini-Hochberg correction. (D) Representative GSEA plots performed as previously described (25) showing Th/Tc17-related gene sets under-represented in KY1005/Sirolimus on day 100 (n=4) versus CTLA4-Ig/Sirolimus (n=7; Left panels) or versus Tacrolimus/Methotrexate (Tac/MTX, n=3; Right panels) cohorts at the time of necropsy.

Comment in

Similar articles

Cited by

References

    1. Akimova T, Kamath BM, Goebel JW, Meyers KE, Rand EB, Hawkins A, Levine MH, Bucuvalas JC, Hancock WW. Differing effects of rapamycin or calcineurin inhibitor on T-regulatory cells in pediatric liver and kidney transplant recipients. Am J Transplant. 2012;12:3449–3461. - PMC - PubMed
    1. Furukawa A, Wisel SA, Tang Q. Impact of Immune-Modulatory Drugs on Regulatory T Cell. Transplantation. 2016;100:2288–2300. - PMC - PubMed
    1. Furlan SN, Watkins B, Tkachev V, Cooley S, Panoskaltsis-Mortari A, Betz K, Brown M, Hunt DJ, Schell JB, Zeleski K, Yu A, Giver C, Waller E, Miller JS, Blazar BR, Kean LS. Systems analysis uncovers inflammatory Th/Tc17-driven modules during acute GVHD in monkey and man. Blood. 2016 - PMC - PubMed
    1. Peccatori J, Forcina A, Clerici D, Crocchiolo R, Vago L, Stanghellini MT, Noviello M, Messina C, Crotta A, Assanelli A, Marktel S, Olek S, Mastaglio S, Giglio F, Crucitti L, Lorusso A, Guggiari E, Lunghi F, Carrabba M, Tassara M, Battaglia M, Ferraro A, Carbone MR, Oliveira G, Roncarolo MG, Rossini S, Bernardi M, Corti C, Marcatti M, Patriarca F, Zecca M, Locatelli F, Bordignon C, Fleischhauer K, Bondanza A, Bonini C, Ciceri F. Sirolimus-based graft-versus-host disease prophylaxis promotes the in vivo expansion of regulatory T cells and permits peripheral blood stem cell transplantation from haploidentical donors. Leukemia. 2015;29:396–405. - PubMed
    1. Pidala J, Kim J, Jim H, Kharfan-Dabaja MA, Nishihori T, Fernandez HF, Tomblyn M, Perez L, Perkins J, Xu M, Janssen WE, Veerapathran A, Betts BC, Locke FL, Ayala E, Field T, Ochoa L, Alsina M, Anasetti C. A randomized phase II study to evaluate tacrolimus in combination with sirolimus or methotrexate after allogeneic hematopoietic cell transplantation. Haematologica. 2012;97:1882–1889. - PMC - PubMed

MeSH terms