. 2017 Sep 20;9(408):eaan4220.
doi: 10.1126/scitranslmed.aan4220.

Cancer immunotherapy with recombinant poliovirus induces IFN-dominant activation of dendritic cells and tumor antigen-specific CTLs

Affiliations

Cancer immunotherapy with recombinant poliovirus induces IFN-dominant activation of dendritic cells and tumor antigen-specific CTLs

Michael C Brown et al. Sci Transl Med. .

Abstract

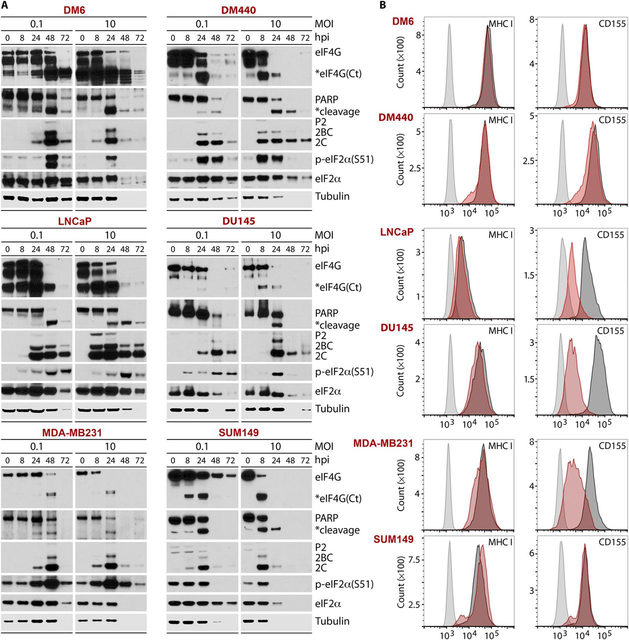
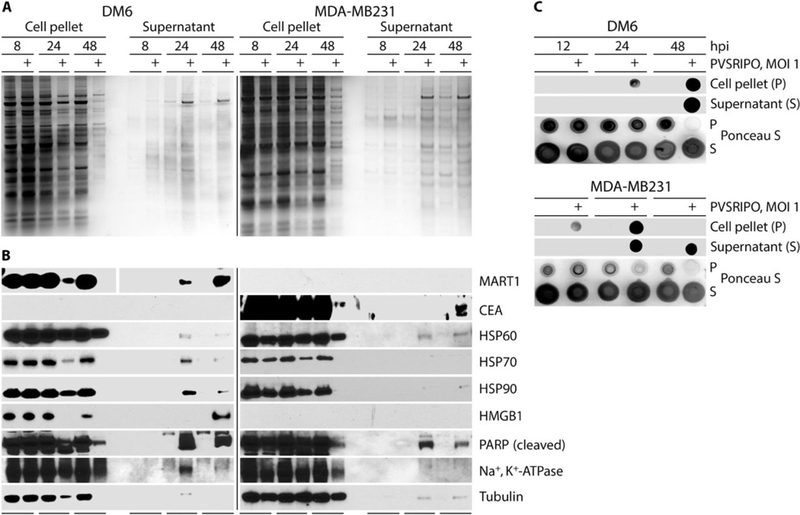
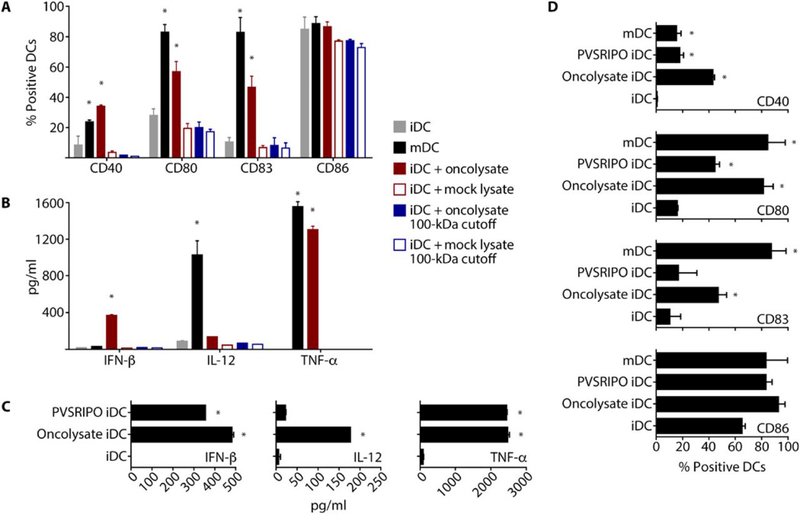
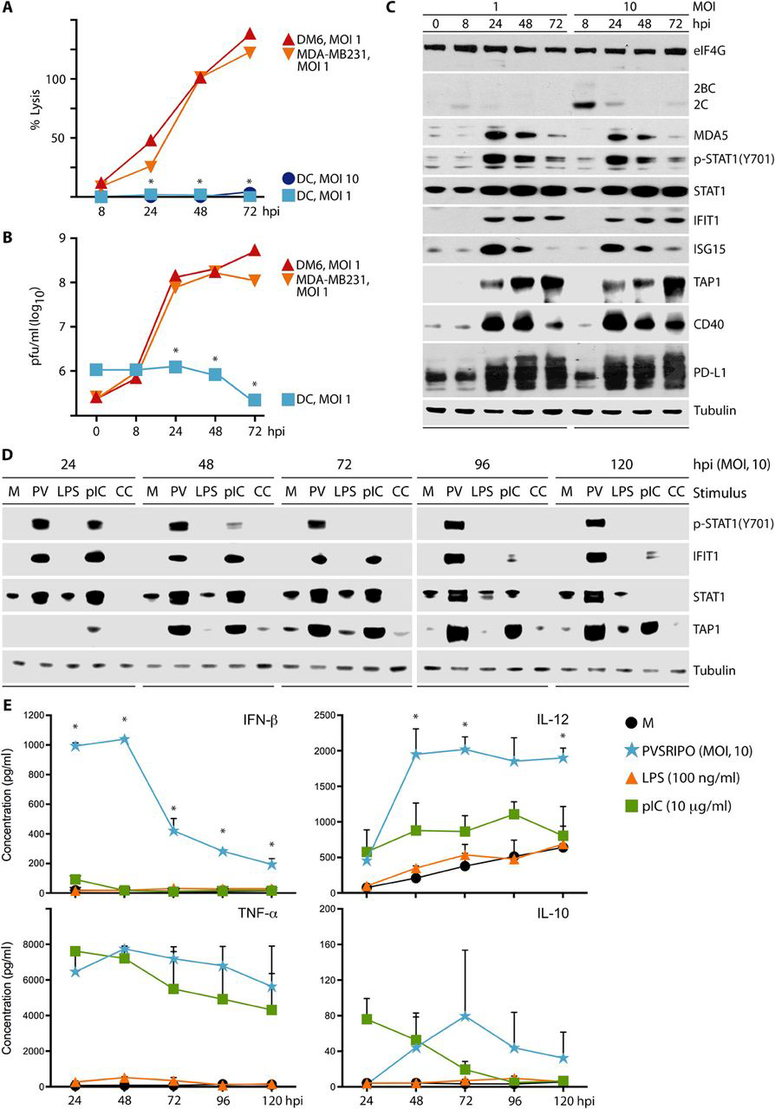
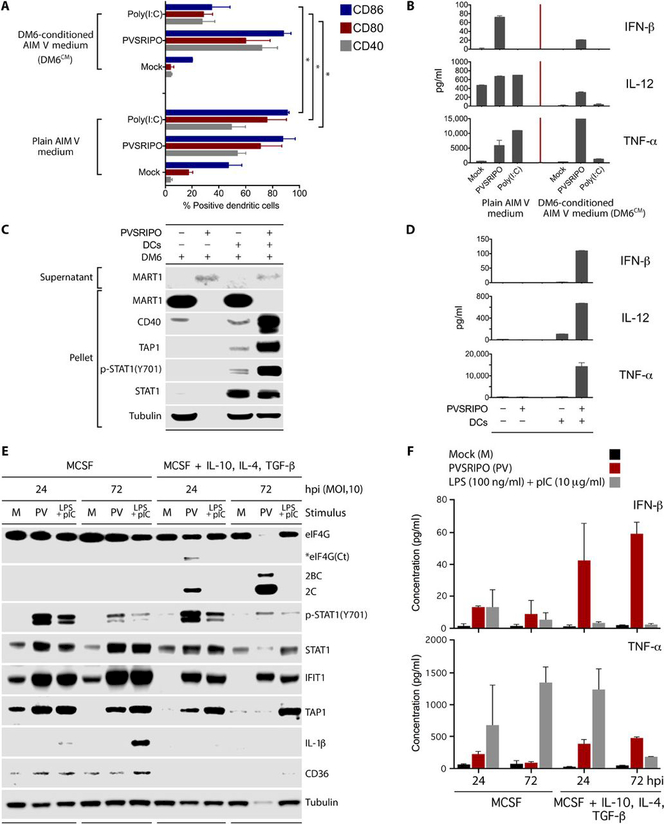
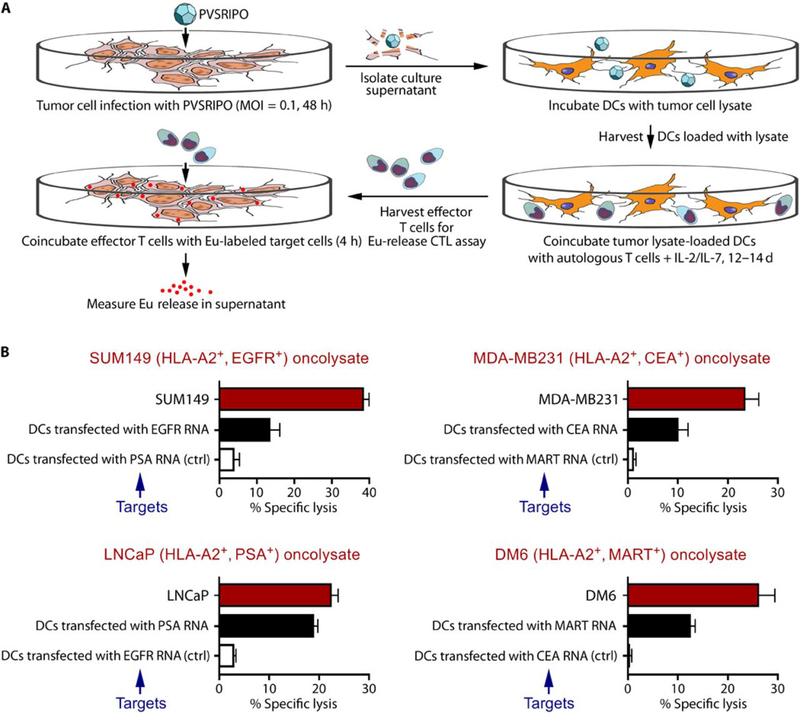
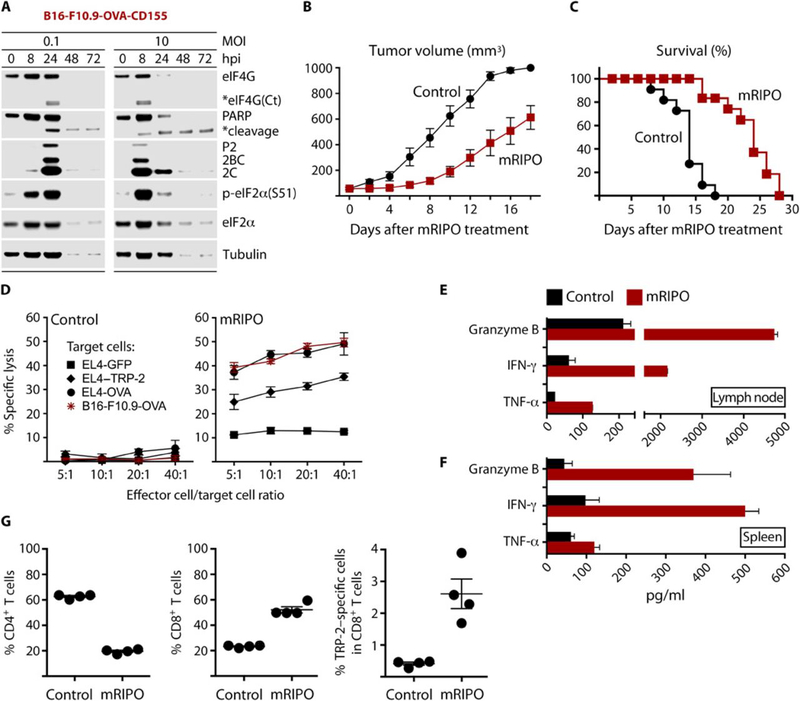
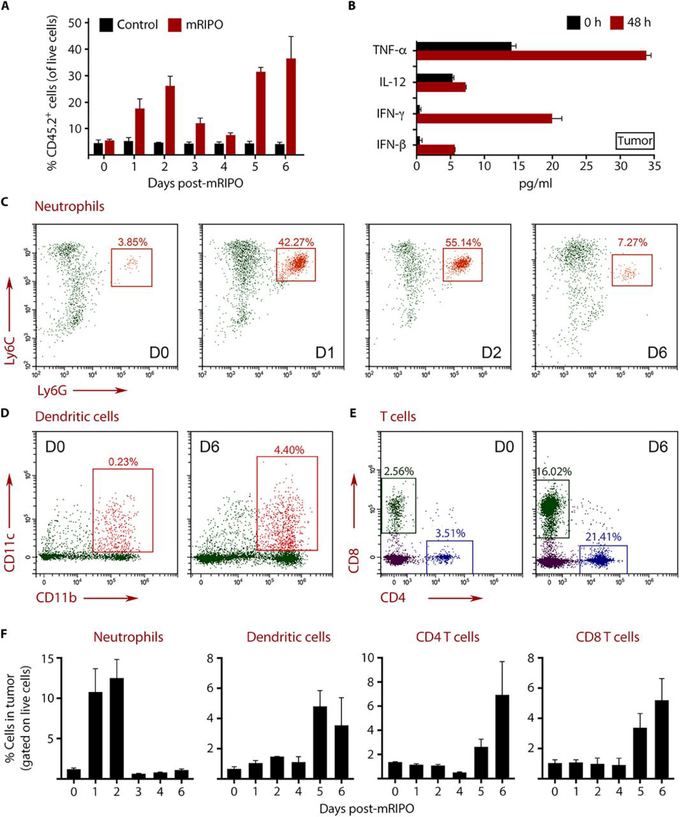
Tumors thrive in an immunosuppressive microenvironment that impedes antitumor innate and adaptive immune responses. Thus, approaches that can overcome immunosuppression and engage antitumor immunity are needed. This study defines the adjuvant and cancer immunotherapy potential of the recombinant poliovirus/rhinovirus chimera PVSRIPO. PVSRIPO is currently in clinical trials against recurrent World Health Organization grade IV malignant glioma, a notoriously treatment-refractory cancer. Cytopathogenic infection of neoplastic cells releases the proteome and exposes pathogen- and damage-associated molecular patterns. At the same time, sublethal infection of antigen-presenting cells, such as dendritic cells and macrophages, yields potent, sustained type I interferon-dominant activation in an immunosuppressed microenvironment and promotes the development of tumor antigen-specific T cell responses in vitro and antitumor immunity in vivo. PVSRIPO's immune adjuvancy stimulates canonical innate anti-pathogen inflammatory responses within the tumor microenvironment that culminate in dendritic cell and T cell infiltration. Our findings provide mechanistic evidence that PVSRIPO functions as a potent intratumor immune adjuvant that generates tumor antigen-specific cytotoxic T lymphocyte responses.


Figures

Fig. 1.
Fig. 1.. PVSRIPO causes cytopathogenicity in cancer cell lines.
Melanoma (DM6, DM440), prostate (LNCaP, DU145), and breast cancer (MDA-MB231, SUM149) cell lines were infected with PVSRIPO at multiplicities of infection (MOIs) of 0.1 or 10. (A) Lysates were collected at the denoted hpi and tested by immunoblot for markers of direct viral cytotoxicity (eIF4G cleavage), host cell demise (PARP cleavage), viral translation (viral proteins P2/2BC/2C), and the innate antiviral response [p-eIF2α(S51)]. Global reduction of host (tubulin) and viral proteins at later time points reflects gross sample loss upon lytic destruction of cells. (B) Cells were infected (MOI=0.1) and harvested (48 hpi) for analysis of MHC class I and CD155 expression by flow cytometry (light gray, uninfected cells stained with isotype control; dark gray, uninfected cells stained for MHC or CD155; red, infected cells stained for MHC or CD155). All experiments were repeated twice, and representative results are shown.
Fig. 2.
Fig. 2.. PVSRIPO oncolysis releases tumor antigens, dsRNA, and DAMPs.
DM6 and MDA-MB231 cells were infected with PVSRIPO. (A) Silver stain was performed on oncolysates/corresponding supernatants. (B) Immunoblots from oncolysates/corresponding supernatants for tumor antigens (MART1/CEA), DAMPs (HSPs, HMGB1), HSP60 (mitochondrial), Na+/K+ ATPase (membrane-associated), PARP (nucleus), and tubulin (cytoplasm). (C) Immunoblot for dsRNA was performed from oncolysates/ corresponding supernatants of DM6 and MDA-MB231 cells (48 hpi); Ponceau S stain serves as loading control. Loss of total protein late during PVSRIPO infection corresponds with cell lysis. All experiments were repeated twice, and a representative series is shown.
Fig. 3.
Fig. 3.. PVSRIPO-induced oncolysate mediates DC activation.
Human DCs (immature DCs, iDCs; mature DCs, mDCs) were generated, and iDCs were treated as indicated. iDCs and mDCs were used as controls, as indicated in the figure. (A and B) Supernatant from untreated or PVSRIPO-infected (MOI=0.1; 48 hpi) DM6 melanoma cells was either unfiltered or filtered through a 100 kD cut-off filter. iDCs were treated with the resulting supernatants (24 h). Flow cytometry (A) and ELISA (B) were used to assess DC activation/maturation phenotype, viability, and pro-inflammatory cytokine production. (C and D) Human DCs were treated with DM6 oncolysate produced as in (A) or PVSRIPO at a titer equal to the amount detected in DM6 oncolysate. Supernatants were assessed for cytokine production by ELISA (C) and cell phenotype by flow cytometry (D). (A and D) For representative flow cytometry data see fig. S2. Experiments were repeated three times with cells from 2 donors; error bars denote SEM, and asterisks denote significant (p<0.05) ANOVA protected Tukey’s HSD test compared to mock controls.
Fig. 4.
Fig. 4.. PVSRIPO infection of DCs is sublethal, marginally productive, and induces sustained pro-inflammatory cytokine production.
Analysis of percent lysis (as measured by LDH release) (A) and viral progeny (B) after PVSRIPO infection of DCs compared to PVSRIPO infection of DM6 and MDA-MB231 cells. (A and B) Asterisks denote statistical significance comparing pooled cancer cell line data to DC values by ANOVA protected HSD test; error bars depict SEM. (C) Dose-dependent PVSRIPO infection (viral protein 2C), type I IFN responses, and lack of cytotoxicity (PARP and eIF4G) in primary human DCs shown by immunoblot. (D and E) iDCs were untreated (mock; M) or treated with PVSRIPO (PV; MOI=10), LPS (100 ng/ml), poly(I:C) (10 μg/ml), or maturation cytokine cocktail (CC) as shown. Cells and supernatant were harvested at the designated intervals. (D) Cell lysates were analyzed by immunoblot for the IFN response and DC activation proteins. (E) ELISA was used to measure IFN-β, TNF-α, IL-12, and IL-10 in DC supernatants after treatment. Data represent cumulative cytokine release at the designated time point. The mean of 2 experiments is shown for each time point. Asterisks denote PVSRIPO mediated cytokine production that is significant compared to all other groups using ANOVA protected Tukey’s HSD test. Repeat assays and magnified view of these data are presented in fig. S3.
Fig. 5.
Fig. 5.. PVSRIPO-mediated APC activation occurs in immunosuppressive conditions.
. (A and B) DCs were cultured in the presence of AIM-V or DM6CM (24 h) and untreated (mock) or treated with PVSRIPO (MOI=10) or poly(I:C) (10 μg/ml) (48 h). (A) Cells were analyzed for activation markers by flow cytometry. Data bars represent the mean of two independent experiments, and error bars denote SEM. Asterisks depict significance as determined by ANOVA protected Tukey’s HSD test. For representative flow cytometry data, see fig. S4. (B) Supernatant from (A) was tested for pro-inflammatory cytokine production by ELISA. (C and D) DM6 cells were cultured alone or with DCs and mock-/PVSRIPO infected (MOI=10). Supernatant was tested for lytic release of MART1 by immunoblot; cell pellets were tested for markers of DM6 cells (MART1) and DC activation [CD40, TAP1, p-STAT1(Y701), STAT1] (C). Supernatants from (C) were assessed for pro-inflammatory cytokine production (D). (E, F) Negatively selected human monocytes were differentiated with MCSF (25 ng/ml) or MCSF + IL-10, TGF-β, and IL-4 (all at 20 ng/ml) for 7 days. The cells were infected with PVSRIPO (MOI=10) or treated with combined poly(I:C) (10 μg/ml) and LPS (100 ng/ml) as shown. Cell lysates were retained for immunoblot (E), and supernatants were used for ELISA (F). (B, C, E) Experiments were repeated three times, and representative data are shown. (D, E) Data bars represent the mean of two independent experiments, and error bars indicate SEM.
Fig. 6.
Fig. 6.. PVSRIPO oncolysate-pulsed DCs generate tumor antigen-specific CTL immunity in vitro.
Primary human DCs co-incubated with SUM149, MDA-MB231, LNCaP, or DM6 oncolysate stimulate tumor antigen-specific T cell responses in vitro. (A) Schema of the assay. (B) T cells were co-cultured with oncolysate-pulsed autologous DCs, and the stimulated effector T cells were then harvested and tested in a CTL assay against the corresponding tumor cells (red bars), autologous DCs transfected with RNA that encodes for a relevant tumor antigen (black bars; positive control), or autologous DCs transfected with RNA that encodes for an irrelevant tumor antigen (white bars; negative control). Each bar represents mean % specific lysis and standard deviation (SD) of triplicate samples. Statistical significance comparing autologous DCs expressing either the relevant or irrelevant tumor antigen for each panel in (B) was calculated using paired two-tailed Student’s t test. A probability of less than 0.05 (p<0.05) is considered statistically significant. Panel SUM149 DC targets, p=0.04; Panel LNCaP DC targets, p=0.0008; panel MDA-MB231 DC targets, p=0.01; Panel DM6 DC targets, p=0.01.
Fig. 7.
Fig. 7.. mRIPO therapy restricts tumor growth and produces antigen-specific antitumor immunity.
(A) Cytopathogenicity profile of mRIPO in B16-F10.9-OVA-CD155 cells. (B and C) Subcutaneous B16-F10.9-OVA-CD155 tumors were injected with either control (DMEM) or mRIPO (20 μl) when they reached a volume of ~50–100 mm3. Tumor volume was measured (n=11 per group) on the days indicated (B); mice were euthanized when tumors reached 1000 mm3 (C). Data are from two pooled assays. Tumor growth curves were compared using multiple t-tests with Holm-Sidak multiple comparison post-test; p≤0.005 starting on day 6. Comparison of survival curves between the 2 groups was performed using the log-rank test (Mantel–Cox test), p<0.0001. Median survival day: control=14; mRIPO=24. (D) Tumor-draining inguinal lymph nodes were harvested from mice (n=4) 7 days after treatment with DMEM or mRIPO and restimulated with antigen-expressing cells for 5 days. Restimulated cells were tested for lytic activity against B16-F10.9-OVA cells or EL4 cells electroporated with RNA encoding GFP (control), TRP-2 (melanoma antigen), or OVA. (E) Supernatant from the CTL assay (D) was tested for markers of T cell activation and lytic activity by ELISA. (F) Tumor-bearing mice were treated with DMEM or mRIPO, and spleens were harvested 14 days after treatment (n=4). Splenocytes from individual mice were co-cultured with B16-F10.9-OVA-CD155 cells (5:1 ratio; 48 h); supernatant was tested as in (E). (G) Tumor-draining inguinal lymph nodes were harvested after treatment with DMEM or mRIPO and individually restimulated in vitro. After 5 days, restimulated cells were analyzed for CD4 and CD8 T cells by flow cytometry. TRP-2-specific response was assessed using a H-2Kb TRP-2 tetramer (right panel). TRP-2 specific responses were compared using student t test, with p<0.05 considered significant. Fig. S8D shows representative flow cytometry analyses of T cells and TRP-2-specific T cells (out of 4 tested per group).
Fig. 8.
Fig. 8.. mRIPO elicits neutrophil influx followed by DC and T cell infiltration into tumors.
B16-F10.9-OVA-CD155 tumors were implanted subcutaneously, and when the tumor volume reached ~100 mm3, they were injected with DMEM (control) or mRIPO. Tumors were harvested after injection as indicated, digested to single cell suspensions, and analyzed by flow cytometry. (A) Analysis of percentage of CD45.2+ immune cells in the tumor after DMEM (control) or mRIPO treatment. Each bar represents 3 mice analyzed individually. (B) Cytokine concentrations in tumor homogenates. (C to E) Analysis of tumor-infiltrating neutrophils (C), DCs (D), and T cells (E) at the indicated days after mRIPO injection. (F) Longitudinal analysis of neutrophil, DC, CD4+ T cell, and CD8+ T cell infiltration is depicted as a percentage of total live cells in the tumor. Each bar represents 3 mice analyzed individually. Error bars represent SEM. The flow cytometry gating strategy is shown in fig. S9 and S10.

Comment in

Similar articles

Cited by

References

    1. Spranger S, Spaapen RM, Zha Y, Williams J, Meng Y, Ha TT, Gajewski TF, Up-regulation of PD-L1, IDO, and T(regs) in the melanoma tumor microenvironment is driven by CD8(+) T cells. Sci Transl Med 5, 200ra116 (2013). - PMC - PubMed
    1. Zou W, Immunosuppressive networks in the tumour environment and their therapeutic relevance. Nat Rev Cancer 5, 263-274 (2005). - PubMed
    1. Palucka K, Banchereau J, Cancer immunotherapy via dendritic cells. Nat Rev Cancer 12, 265-277 (2012). - PMC - PubMed
    1. Gilboa E, DC-based cancer vaccines. J Clin Invest 117, 1195-1203 (2007). - PMC - PubMed
    1. Melief CJ, van Hall T, Arens R, Ossendorp F, van der Burg SH, Therapeutic cancer vaccines. J Clin Invest 125, 3401-3412 (2015). - PMC - PubMed

MeSH terms