. 2017 Nov 14;91(23):e01051-17.
doi: 10.1128/JVI.01051-17. Print 2017 Dec 1.

Pathogenic Correlates of Simian Immunodeficiency Virus-Associated B Cell Dysfunction

Affiliations

Pathogenic Correlates of Simian Immunodeficiency Virus-Associated B Cell Dysfunction

Egidio Brocca-Cofano et al. J Virol. .

Abstract

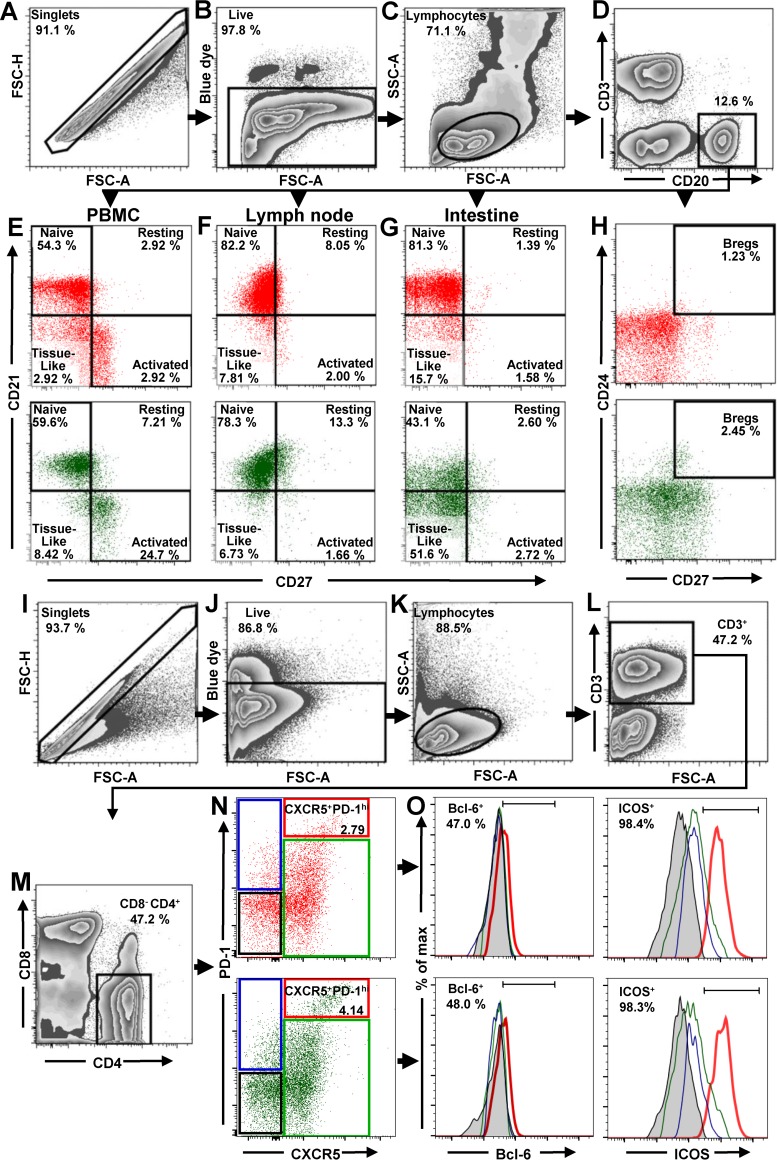
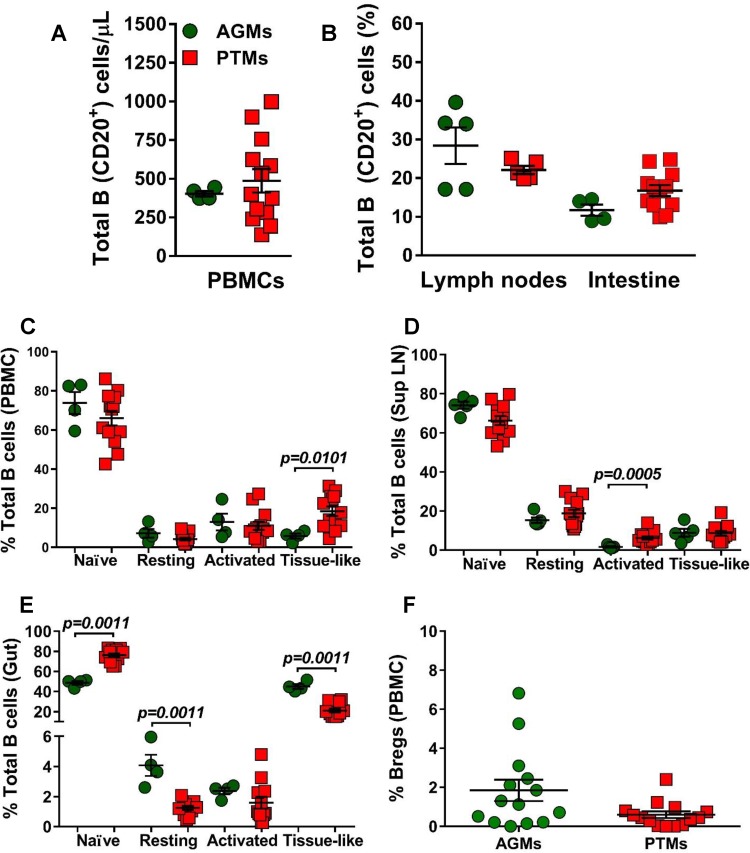
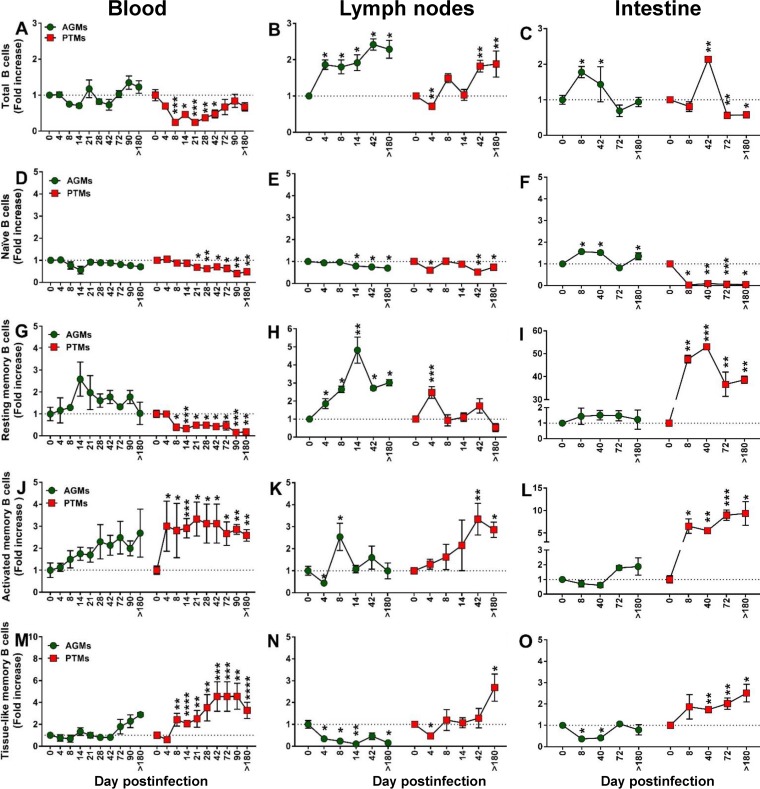
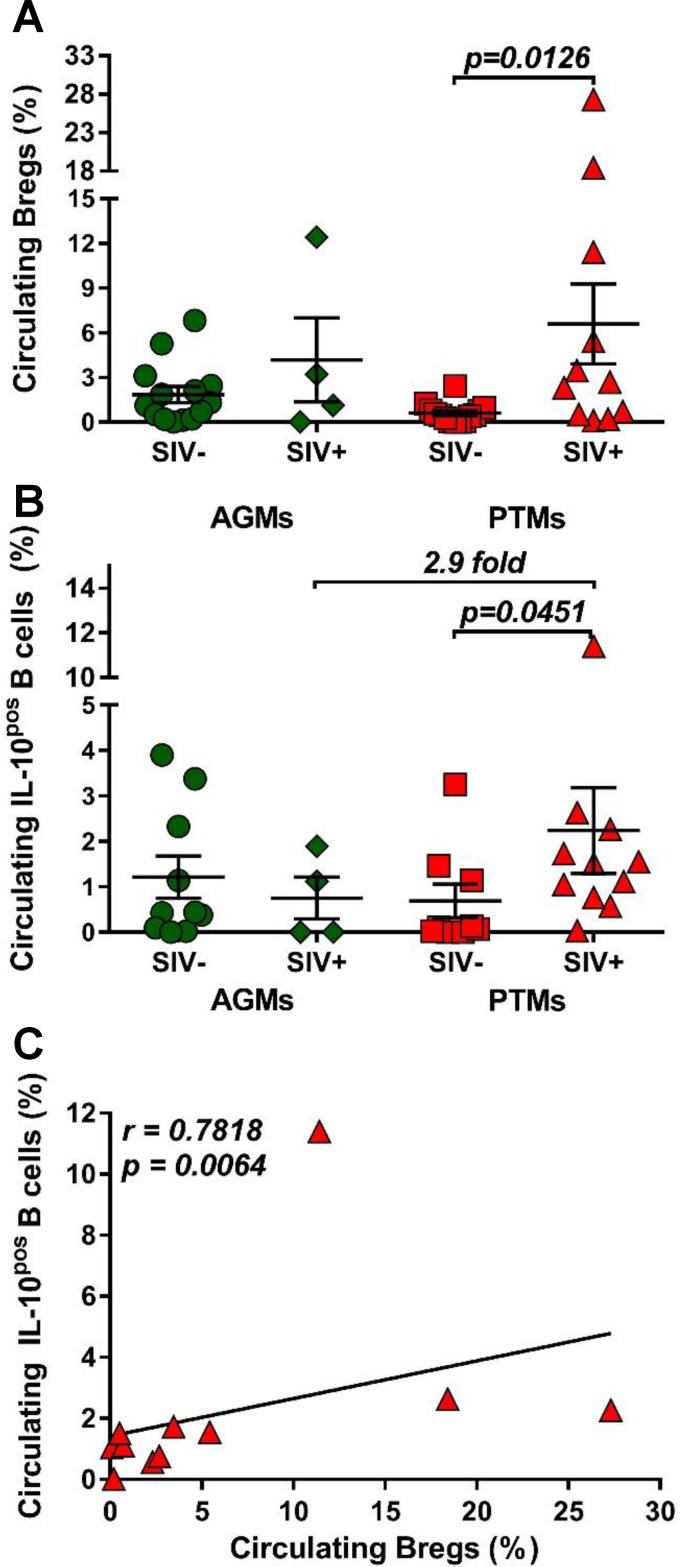
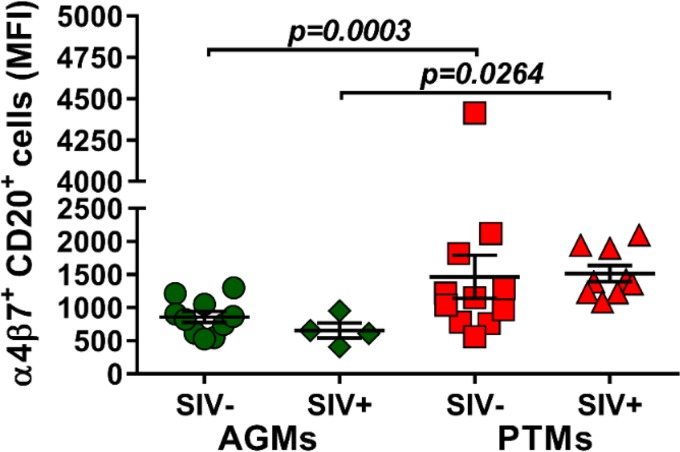
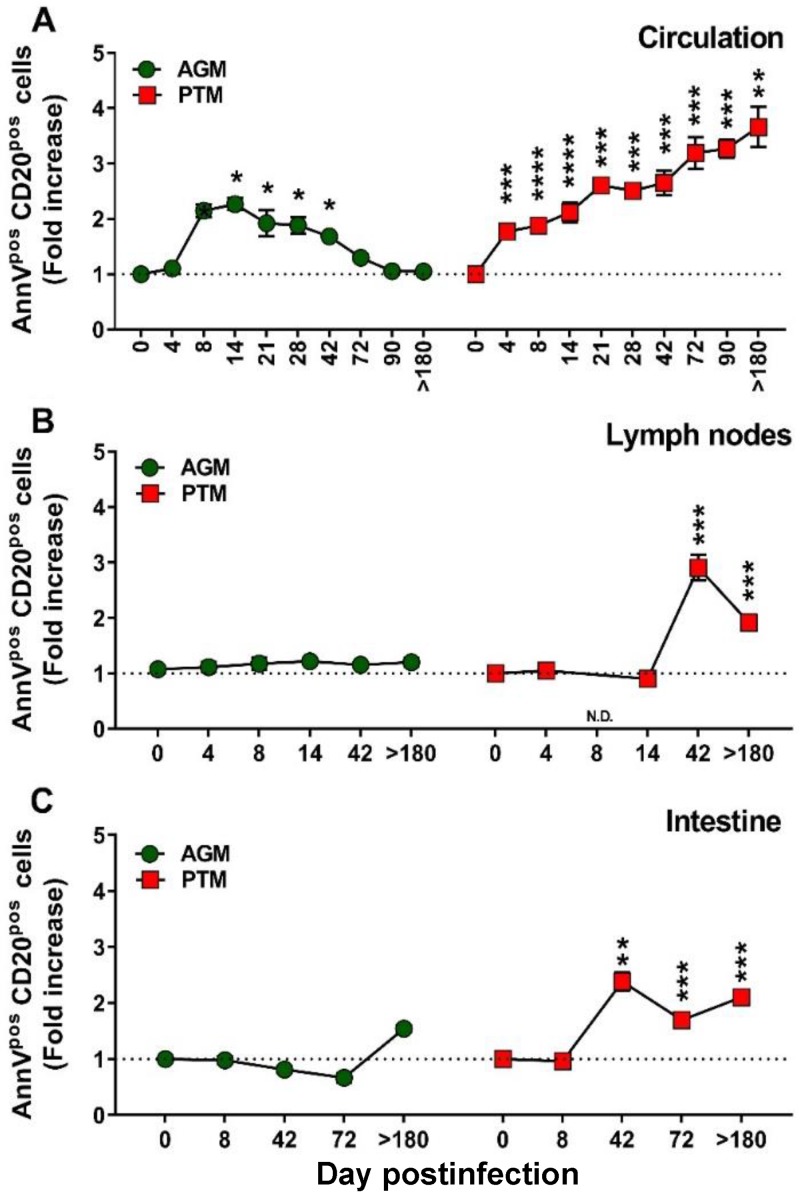
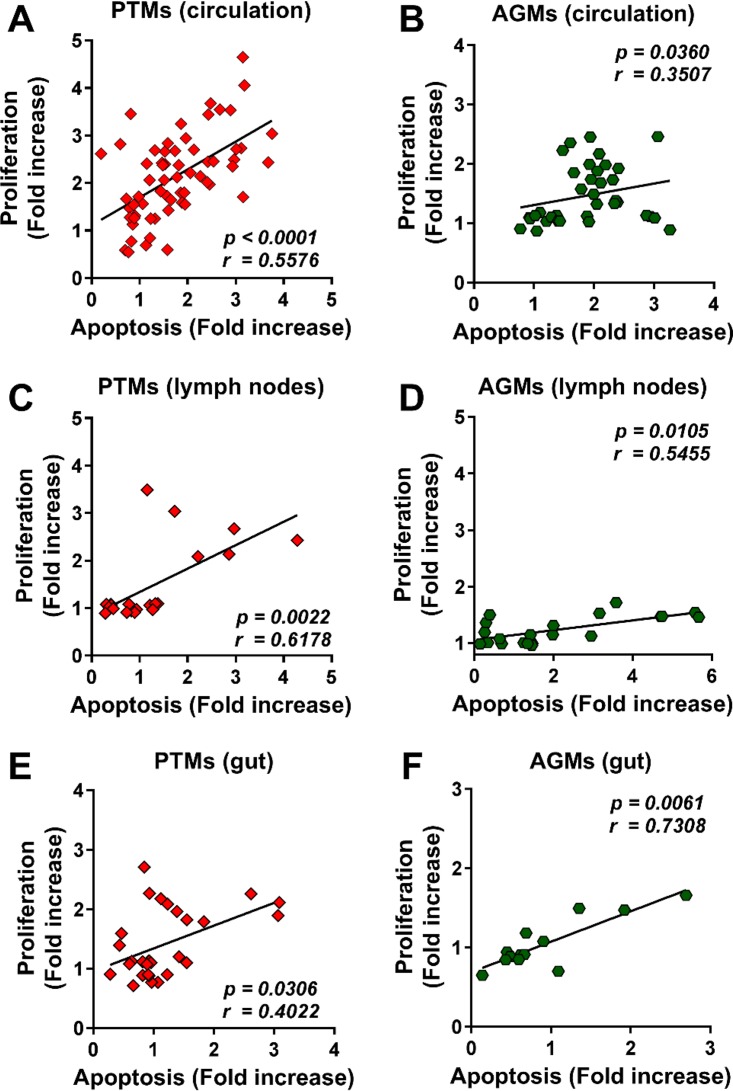
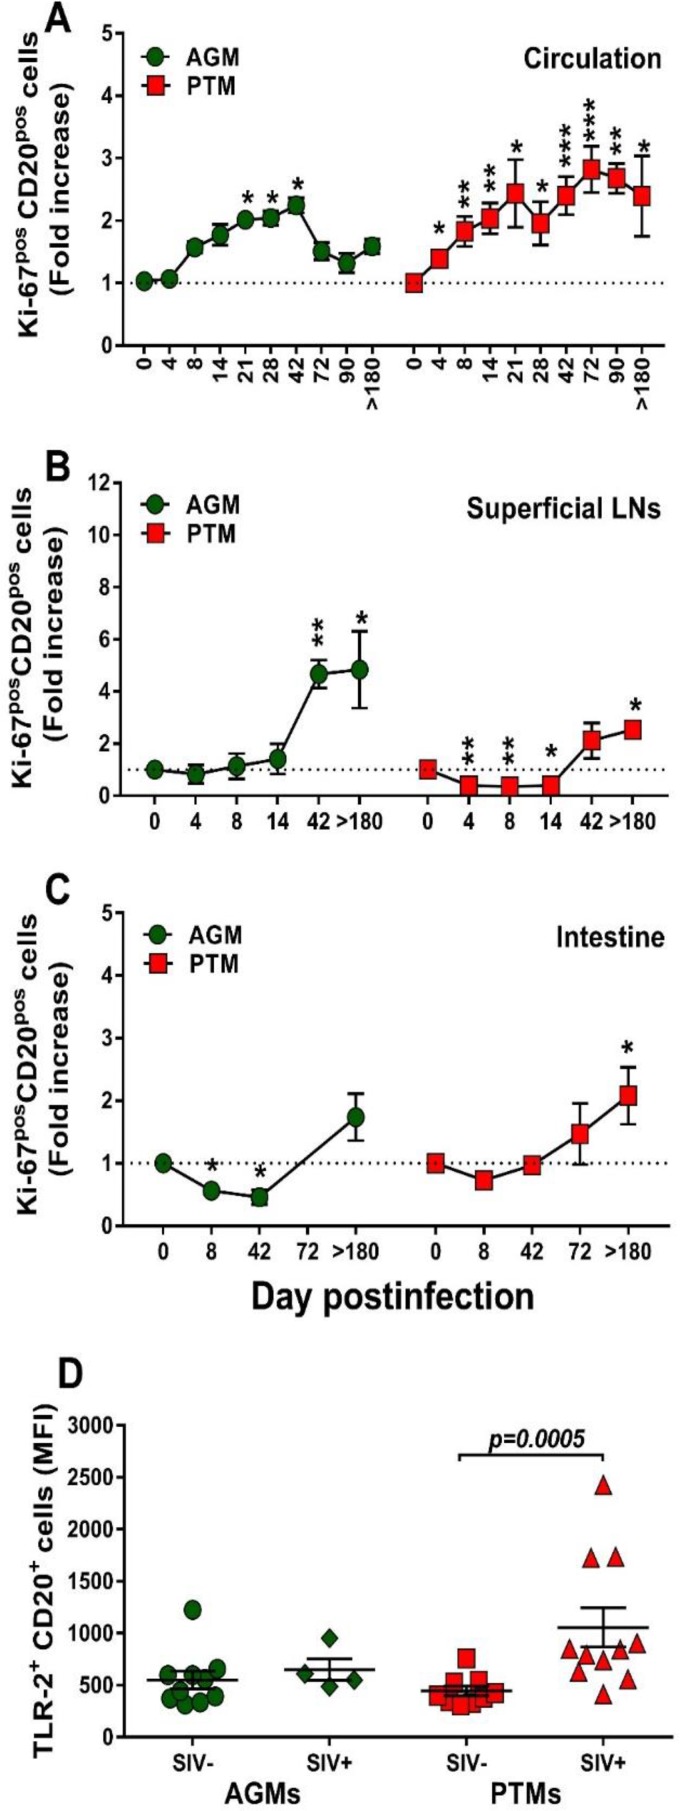
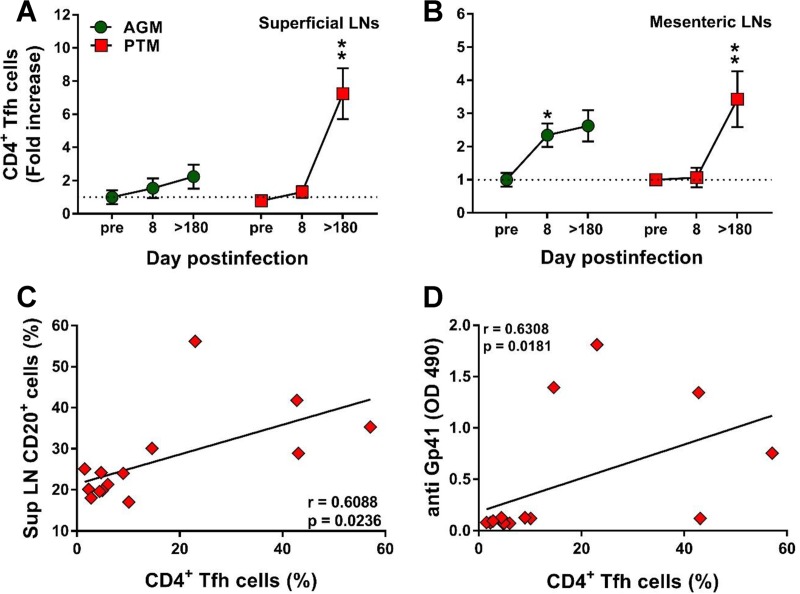
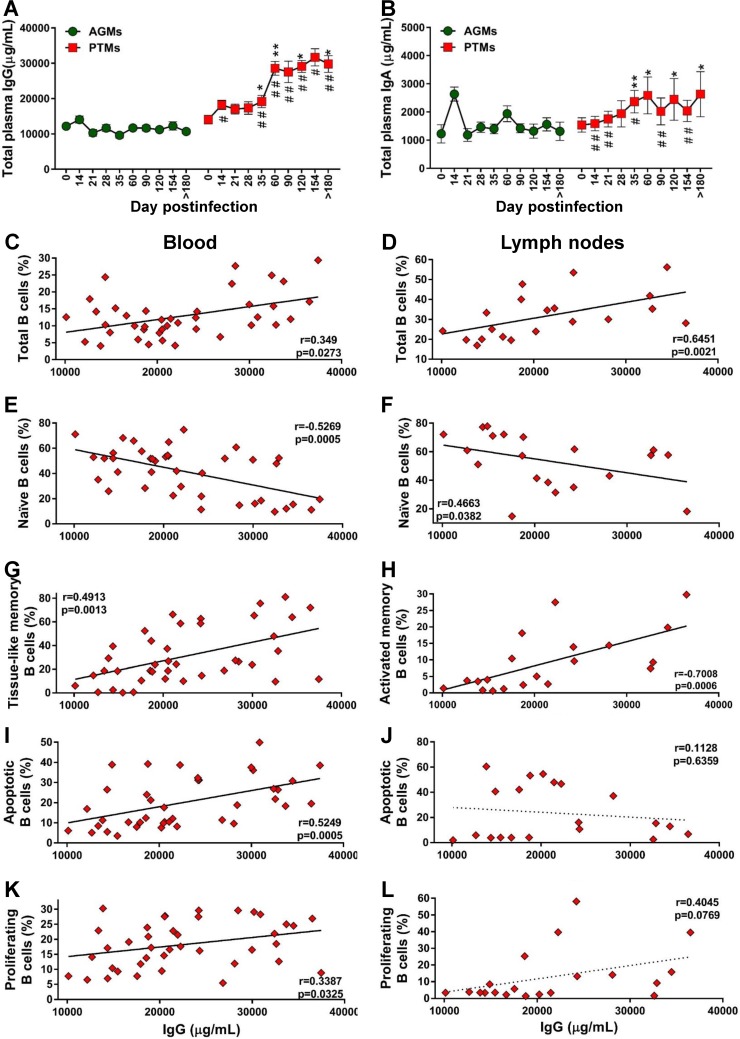
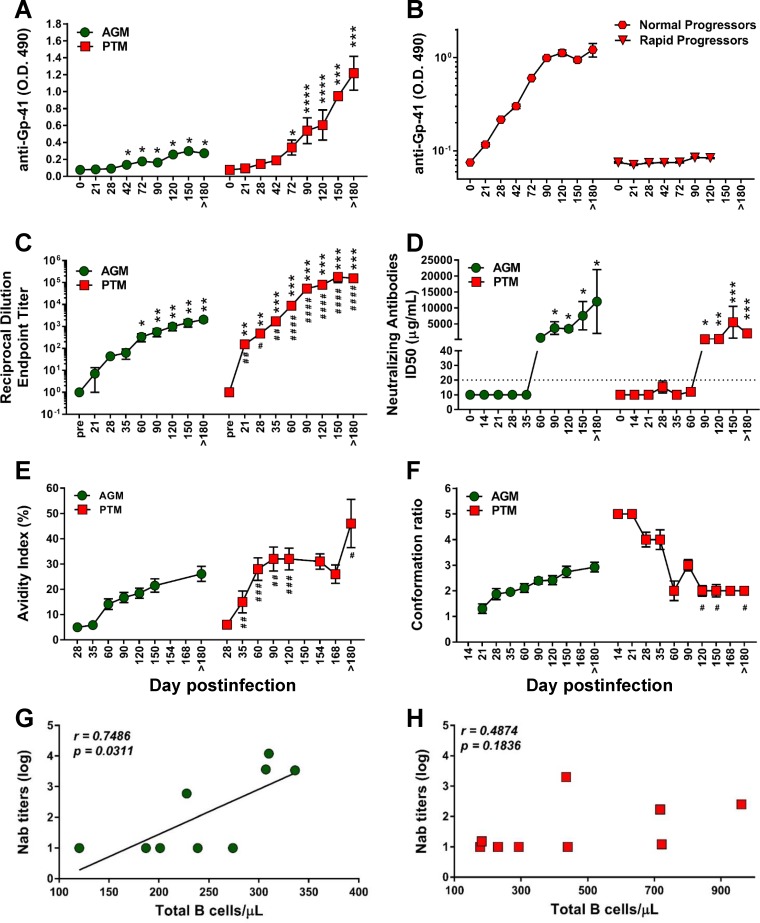
We compared and contrasted pathogenic (in pig-tailed macaques [PTMs]) and nonpathogenic (in African green monkeys [AGMs]) SIVsab infections to assess the significance of the B cell dysfunction observed in simian (SIV) and human immunodeficiency virus (HIV) infections. We report that the loss of B cells is specifically associated with the pathogenic SIV infection, while in the natural hosts, in which SIV is nonpathogenic, B cells rapidly increase in both lymph nodes (LNs) and intestine. SIV-associated B cell dysfunction associated with the pathogenic SIV infection is characterized by loss of naive B cells, loss of resting memory B cells due to their redistribution to the gut, increases of the activated B cells and circulating tissue-like memory B cells, and expansion of the B regulatory cells (Bregs). While circulating B cells are virtually restored to preinfection levels during the chronic pathogenic SIV infection, restoration is mainly due to an expansion of the "exhausted," virus-specific B cells, i.e., activated memory cells and tissue-like memory B cells. Despite of the B cell dysfunction, SIV-specific antibody (Ab) production was higher in the PTMs than in AGMs, with the caveat that rapid disease progression in PTMs was strongly associated with lack of anti-SIV Ab. Neutralization titers and the avidity and maturation of immune responses did not differ between pathogenic and nonpathogenic infections, with the exception of the conformational epitope recognition, which evolved from low to high conformations in the natural host. The patterns of humoral immune responses in the natural host are therefore more similar to those observed in HIV-infected subjects, suggesting that natural hosts may be more appropriate for modeling the immunization strategies aimed at preventing HIV disease progression. The numerous differences between the pathogenic and nonpathogenic infections with regard to dynamics of the memory B cell subsets point to their role in the pathogenesis of HIV/SIV infections and suggest that monitoring B cells may be a reliable approach for assessing disease progression.IMPORTANCE We report here that the HIV/SIV-associated B cell dysfunction (defined by loss of total and memory B cells, increased B regulatory cell [Breg] counts, and B cell activation and apoptosis) is specifically associated with pathogenic SIV infection and absent during the course of nonpathogenic SIV infection in natural nonhuman primate hosts. Alterations of the B cell population are not correlated with production of neutralizing antibodies, the levels of which are similar in the two species. Rapid progressive infections are associated with a severe impairment in SIV-specific antibody production. While we did not find major differences in avidity and maturation between the pathogenic and nonpathogenic SIV infections, we identified a major difference in conformational epitope recognition, with the nonpathogenic infection being characterized by an evolution from low to high conformations. B cell dysfunction should be considered in designing immunization strategies aimed at preventing HIV disease progression.

Keywords: B cell; follicular T helper cells; humoral immune response; immune activation; nonpathogenic infection; pathogenic infection; simian immunodeficiency virus.


Figures

FIG 1
FIG 1
Flow cytometry strategy for identification of total B cells, B cells subsets, and Tfh cells in PBMCs, LNs, and intestine. The gating strategy to identify total B cells, B cell subsets, and Tfh cells in uninfected AGMs (green dot plots) and uninfected PTMs (red dot plots) is shown. Lymphocytes were gated on singlets, followed by gating on live cells (A to C). B cells from PBMCs, LNs, and intestine were selected by gating on CD20+ (D). CD21 and CD27 markers were used to distinguish naive (CD27neg CD21+), resting memory (CD27+ CD21+), activated memory (CD27+ CD21neg), and tissue-like memory (CD27neg CD21neg) B cells from PBMCs (E), LNs (F), and intestine (G). CD27 and CD24 were used to identify regulatory B cells from PBMCs (H). To characterize Tfh cells in mesenteric and axillary LNs, lymphocytes were gated on singlets, followed by selection of live CD3+ cells (I to L). CD4+ CD8neg cells were then gated (M) and analyzed based on expression of PD-1 and CXCR5. The doubly positive PD-1high CXCR5+ population was used to identify Tfh cells (N). Expression of Bcl-6 and ICOS was assessed in CXCR5neg PD-1neg CD4+ T cells (black square), CXCR5neg PD-1+ CD4+ T cells (blue square), CXCR5+ PD-1neg CD4+ T cells (green square), and CXCR5+ PD-1high CD4+ T cells (red square) (O). FSC-A, forward-scatter area; FSC-H, forward-scatter height; SSC-A, side scatter area.
FIG 2
FIG 2
Total B cells and B cell subsets in peripheral blood, lymph nodes, and intestine in uninfected African green monkeys (AGMs) and pig-tailed macaques (PTMs). (A) Absolute counts of the total circulating B cells in peripheral blood (A) and frequency of total B cells in axillary lymph nodes and intestine (B). (C to E) Frequencies of the memory B cell subsets in peripheral blood (C), axillary lymph nodes (D), and intestine (E). (F) Frequency of regulatory B cells in peripheral blood. Values of individual animals are plotted, with the group means (long solid lines) and standard errors of means (short solid lines) shown. The Mann-Whitney U test was used to assess significance; P values are shown.
FIG 3
FIG 3
Changes in the total B cells as well as naive versus memory B cells from circulation, lymph nodes, and intestine over the course of progressive SIVsab infection of AGMs and nonprogressive SIVsab infection of PTMs. (A to C) Fold increase of the absolute counts of total B cells in peripheral blood (A) and in the frequency of B cells from the lymph nodes (B) and intestine (C) in AGMs and PTMs. (D to O) Fold increase of naive (D to F), resting memory (G to I), activated memory (J to L), and tissue-like memory (M to O) B cells from circulation (left), lymph nodes (middle), and intestine (right) in AGMs and PTMs. Dotted lines mark the baseline levels of total B cells and of the different cell subsets. The Mann-Whitney U test was used to assess significance. Error bars correspond to standard errors of the means. Significant changes from the preinfection baseline levels are indicated as follows: *, P < 0.05; **, P < 0.01; ***, P < 0.001; and ****, P < 0.0001.
FIG 4
FIG 4
Frequencies of regulatory B cells and IL-10 production over the course of progressive SIVsab infection of AGMs and nonprogressive SIVsab infection of PTMs. (A) Frequencies of regulatory B cells in uninfected (green circles) versus SIVsab-infected (green diamonds) AGMs and uninfected (red squares) versus SIVsab-infected (red triangles) PTMs. (B) Expression of IL-10 in circulating total B cells from uninfected versus SIVsab-infected AGMs and uninfected versus SIVsab-infected PTMs. (C) Positive correlation between circulating total B cells expressing IL-10 and circulating Bregs in PTMs infected with SIVsab. Values of individual animals are plotted, with the group means (long solid lines) and standard errors of the means (short solid lines) shown. The Mann-Whitney U test was used to assess significance; P values are shown. Relationships between total circulating B cells expressing IL-10 and of the frequency of total circulating Bregs were evaluated using the Spearman rank correlation test. The significant correlation illustrated as a solid line; P and Spearman rank correlation (r) values are shown.
FIG 5
FIG 5
Mean fluorescence intensity (MFI) of α4β7 integrin expression on total B cells in AGMs and PTMs. Results for uninfected (green circles) and SIVsab-infected (green diamonds) AGMs and uninfected (red squares) and SIVsab-infected (red triangles) PTMs are shown. Values of individual animals are plotted, with the group means (long solid lines) and standard errors of means (short solid lines) shown. The Mann-Whitney U test was used to assess significance; P value is shown.
FIG 6
FIG 6
Changes in the levels of apoptotic B cells over the course of progressive SIVsab infection of AGMs and nonprogressive SIVsab infection of PTMs. Fold increases of the apoptotic cells from the PBMCs (A), lymph nodes (B), and intestine (C) are shown. AGMs are shown by green circles and PTMs by red squares. Dotted lines mark the baseline levels of the different cell subsets. The Mann-Whitney U test was used to assess significance. Error bars correspond to standard errors of the means. Significant changes from the preinfection baseline levels are indicated as follows: *, P < 0.05; **, P < 0.01; and ***, P < 0.001. AnnV, annexin V.
FIG 7
FIG 7
Correlations between proliferation and apoptosis over the course of progressive SIVsab infection of AGMs and nonprogressive SIVsab infection of PTMs. Positive correlations between proliferation and apoptosis were observed in both PTMs (red diamonds) and AGMs (green hexagons) in the blood (A and B), lymph nodes (C and D), and intestine (E and F). Relationships between proliferation and apoptosis were assessed using the Spearman rank correlation test. Significant correlations are represented by solid lines; P and Spearman rank correlation (r) values are shown.
FIG 8
FIG 8
Changes in Ki-67 expression on total B cells over the course of progressive SIVsab infection of AGMs and nonprogressive SIVsab infection of PTMs. (A to C) Fold increase of Ki-67 expression in PBMCs (A), lymph nodes (B), and intestine (C). Dotted lines mark the baseline levels of the different cell subsets. The Mann-Whitney U test was used to assess significance. Error bars correspond to standard errors of the means. Significant changes from the preinfection baseline levels are indicated as follows: *, P < 0.05; **, P < 0.01; and ***, P < 0.001. (D) MFI of TLR-2 expression on total B cells over the course of progressive SIVsab infection of AGMs and nonprogressive SIVsab infection of PTMs. AGMs are shown by green circles and PTMs by red squares. Results for uninfected (green circles) versus SIVsab-infected AGMs (green diamonds) and uninfected (red squares) versus SIVsab-infected PTMs (red triangles) are shown. Values of individual animals are plotted, with the group means (long solid lines) and standard errors of means (short solid lines) shown. The Mann-Whitney U test was used to assess significance; P values are shown.
FIG 9
FIG 9
Changes in the levels of follicular helper CD4+ T (Tfh) cells in lymph nodes over the course of progressive SIVsab infection of AGMs and nonprogressive SIVsab infection of PTMs. (A and B) Changes in the Tfh cell frequency in axillary (A) and mesenteric (B) lymph nodes in AGMs and PTMs. Dotted lines mark the baseline levels of the different cell subsets. The Mann-Whitney U test was used to assess significance. Error bars correspond to standard errors of the means. Significant changes from the preinfection baseline levels are indicated as follows: *, P < 0.05; **, P < 0.01; and ***, P < 0.001. Significant differences between pathogenic and nonpathogenic species at same time point are indicated as follows: #, P < 0.05; ##, P < 0.01; and ###, P < 0.001. (C) Significant correlation between the frequency of total B cells and that of CD4+ Tfh cells in PTMs. (D) Significant positive correlation between frequency of CD4+ Tfh cells and the plasma levels of anti-gp41 antibodies in PTMs. Relationships between the frequencies of B cells and anti-gp-41 antibodies versus the frequency of CD4+ Tfh cells in the axillary lymph nodes were evaluated using the Spearman rank correlation test. Significant correlations are represented by solid lines; P and Spearman rank correlation (r) value are shown.
FIG 10
FIG 10
Assessment of the relationship between B cell dysfunction and overall humoral immune response over the course of progressive SIVsab infection of AGMs and nonprogressive SIVsab infection of PTMs. (A and B) Total levels of IgG (A) and total IgA (B) in AGMs and PTMs. Dotted lines mark the baseline levels of the different cell subsets. The Mann-Whitney U test was used to assess significance. Error bars correspond to standard errors of the means. Significant changes from the preinfection baseline levels are indicated as follows: *, P < 0.05; **, P < 0.01; and ***, P < 0.001. Significant differences between pathogenic and nonpathogenic species at same time point are indicated as follows: #, P < 0.05; ##, P < 0.01; and ###, P < 0.001. Significant positive correlations were established during the pathogenic SIV infection of PTMs between the levels of total IgG and total (C) and tissue-like memory (G) B cells from circulation (C) and total (D) and activated (H) B cells from the lymph nodes (D). Negative correlations between were established during the pathogenic SIV infection of PTMs between the levels of total IgG and the naive B cells from the peripheral blood (E) and lymph nodes (F). Significant positive correlation between the levels of total IgG and the levels of apoptotic B cells (I) and proliferating B cells (K) from peripheral blood and only trends for a negative correlation with the levels of apoptotic B cells (J) and for a positive correlation with the levels of proliferating B cells (L) from the lymph nodes were established. Relationships between the levels of total B cells and subsets, apoptotic and proliferating B cells from blood and lymph nodes, and total IgG were assessed using the Spearman rank correlation test. Significant correlations and positive or negative trends are illustrated by solid and dotted lines, respectively; P and Spearman rank correlation (r) value are shown.
FIG 11
FIG 11
Antibody responses and antibody maturation profiles over the course of progressive SIVsab infection of AGMs and nonprogressive SIVsab infection of PTMs. (A) Anti-gp41 titers in AGMs and PTMs; (B) anti-gp41 antibody titers in normal progressor versus rapid progressor PTMs; (C) mean of endpoint titers of the highest reciprocal dilution; (D) neutralization antibodies titers; (E) mean avidity index; (F) mean conformation ratio. The Mann-Whitney U test was used to determine significance. Error bars correspond to standard errors of means. Significant differences compared to baseline values before infection are indicated as follows: *, P < 0.05; **, P < 0.01; ***, P < 0.001; and ****, P < 0.0001. Significant differences between AGMs and PTMs for the same time point are indicated as follows: #, P < 0.05; ##, P < 0.01; ###, P < 0.001; and ####, P < 0.0001. (G) Significant positive correlation between total peripheral B cells and production of neutralizing antibodies in AGMs (green circles). (H) Lack of correlation between the levels of total B cells and production of neutralizing antibodies in PTMs (red squares). Relationships between the levels of neutralizing antibodies and absolute counts of the total B cells were assessed using the Spearman rank correlation test. Significant correlations are represented by solid line; P and Spearman rank correlation (r) values are shown.

Similar articles

Cited by

References

    1. Pandrea I, Apetrei C. 2010. Where the wild things are: pathogenesis of SIV infection in African nonhuman primate hosts. Curr HIV/AIDS Rep 7:28–36. doi:10.1007/s11904-009-0034-8. - DOI - PMC - PubMed
    1. Pandrea I, Sodora DL, Silvestri G, Apetrei C. 2008. Into the wild: simian immunodeficiency virus (SIV) infection in natural hosts. Trends Immunol 29:419–428. doi:10.1016/j.it.2008.05.004. - DOI - PMC - PubMed
    1. VandeWoude S, Apetrei C. 2006. Going wild: lessons from naturally occurring T-lymphotropic lentiviruses. Clin Microbiol Rev 19:728–762. doi:10.1128/CMR.00009-06. - DOI - PMC - PubMed
    1. Silvestri G, Paiardini M, Pandrea I, Lederman MM, Sodora DL. 2007. Understanding the benign nature of SIV infection in natural hosts. J Clin Invest 117:3148–3154. doi:10.1172/JCI33034. - DOI - PMC - PubMed
    1. Gaufin T, Pattison M, Gautam R, Stoulig C, Dufour J, MacFarland J, Mandell D, Tatum C, Marx MH, Ribeiro RM, Montefiori D, Apetrei C, Pandrea I. 2009. Effect of B-cell depletion on viral replication and clinical outcome of simian immunodeficiency virus infection in a natural host. J Virol 83:10347–10357. doi:10.1128/JVI.00880-09. - DOI - PMC - PubMed

MeSH terms

LinkOut - more resources