. 2017 Nov 14;91(23):e01309-17.
doi: 10.1128/JVI.01309-17. Print 2017 Dec 1.

Susceptibility of Human Endogenous Retrovirus Type K to Reverse Transcriptase Inhibitors

Affiliations

Susceptibility of Human Endogenous Retrovirus Type K to Reverse Transcriptase Inhibitors

Rafael Contreras-Galindo et al. J Virol. .

Abstract

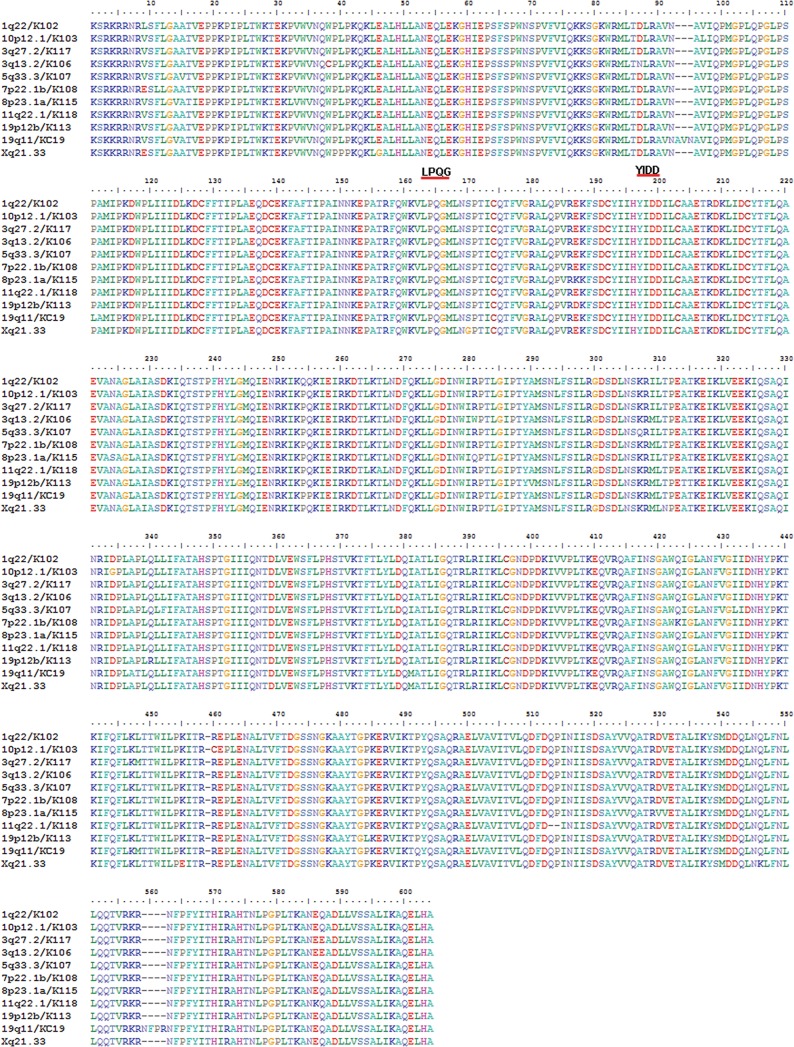
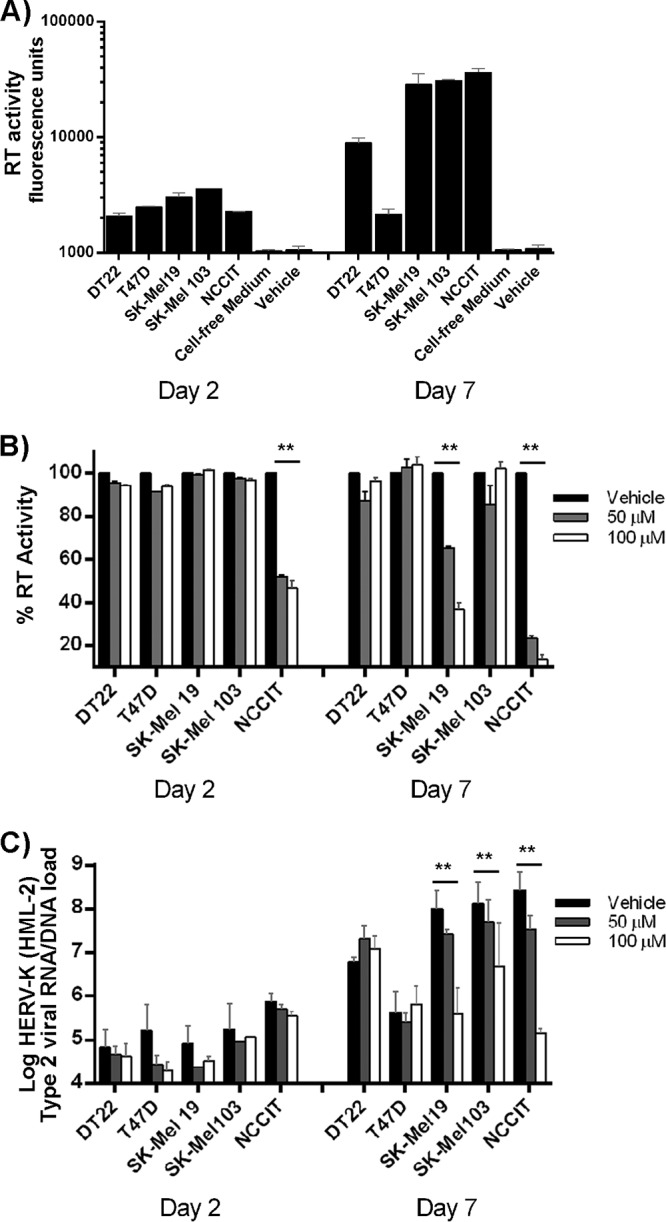
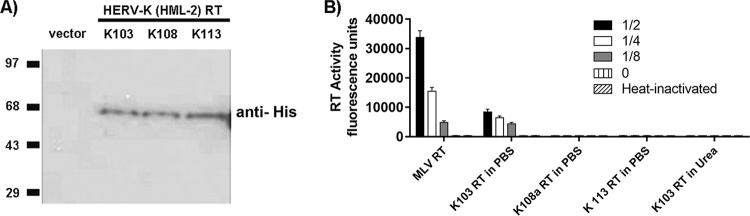
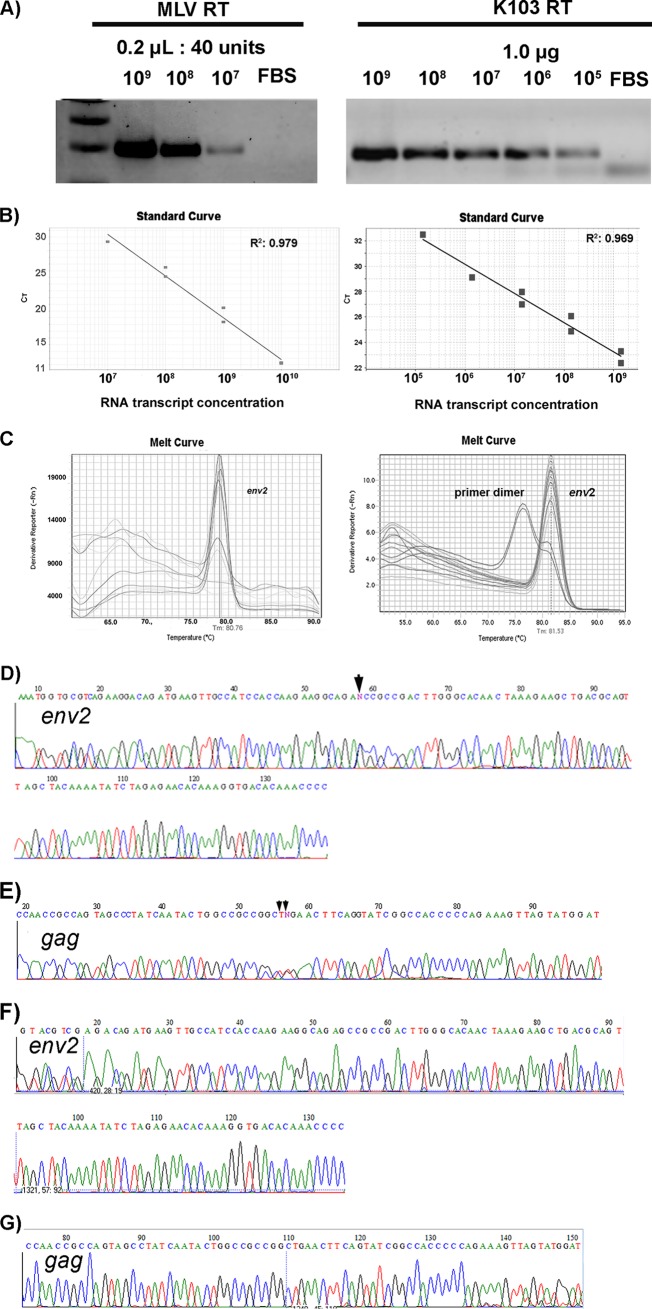
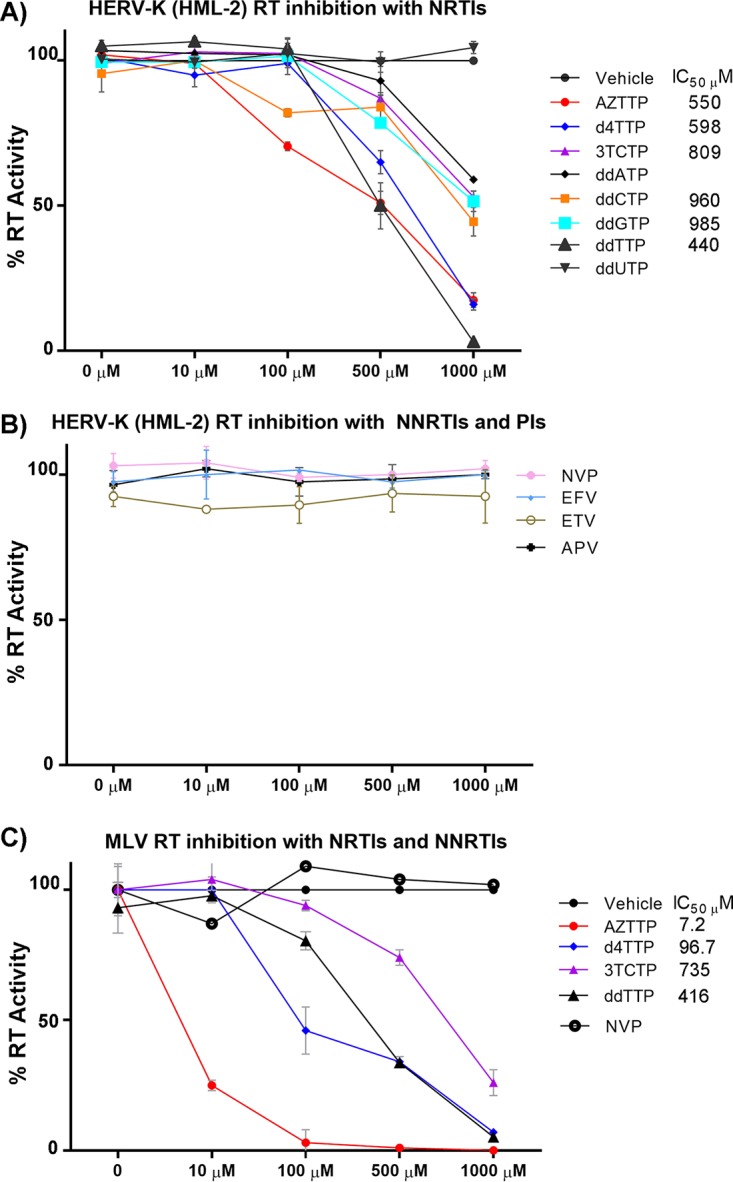
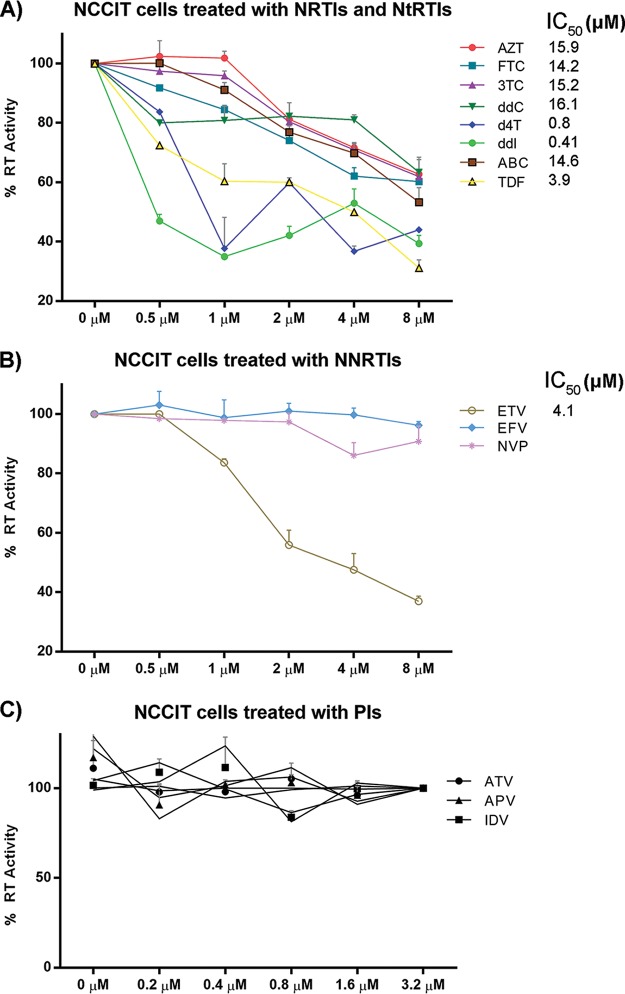
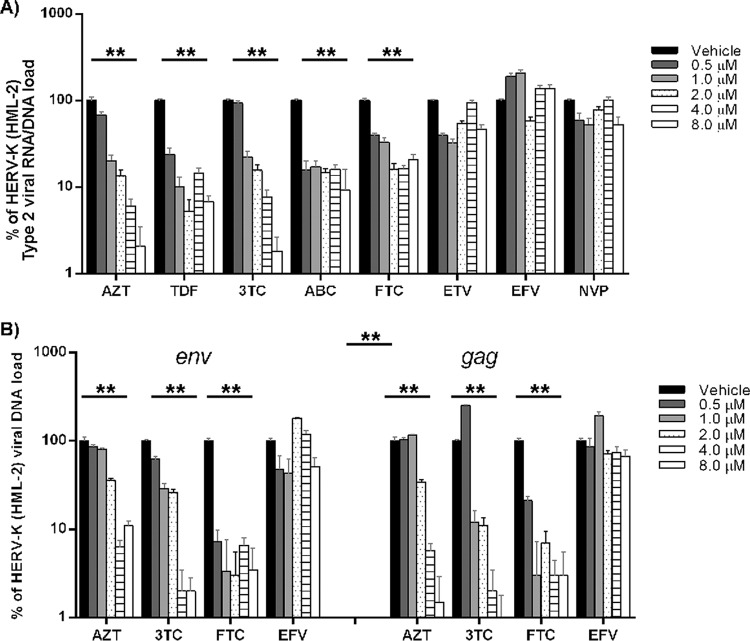
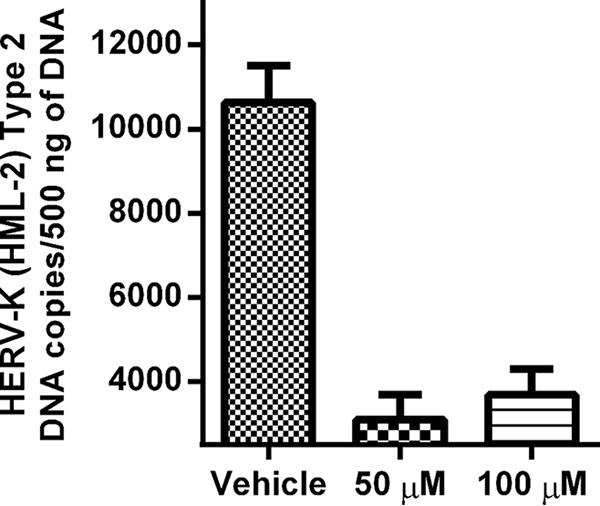
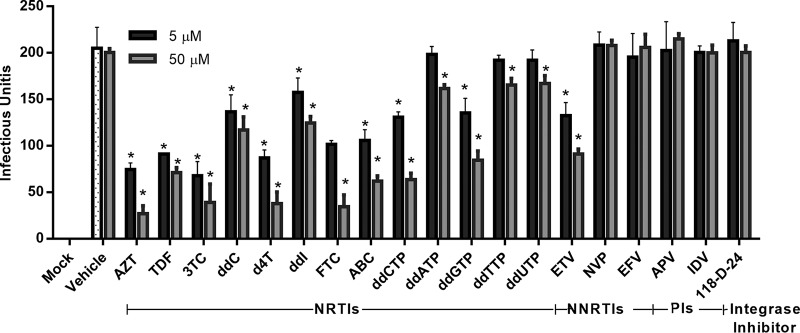
Human endogenous retroviruses (HERVs) make up 8% of the human genome. The HERV type K (HERV-K) HML-2 (HK2) family contains proviruses that are the most recent entrants into the human germ line and are transcriptionally active. In HIV-1 infection and cancer, HK2 genes produce retroviral particles that appear to be infectious, yet the replication capacity of these viruses and potential pathogenicity has been difficult to ascertain. In this report, we screened the efficacy of commercially available reverse transcriptase inhibitors (RTIs) at inhibiting the enzymatic activity of HK2 RT and HK2 genomic replication. Interestingly, only one provirus, K103, was found to encode a functional RT among those examined. Several nucleoside analogue RTIs (NRTIs) blocked K103 RT activity and consistently inhibited the replication of HK2 genomes. The NRTIs zidovudine (AZT), stavudine (d4T), didanosine (ddI), and lamivudine (3TC), and the nucleotide RTI inhibitor tenofovir (TDF), show efficacy in blocking K103 RT. HIV-1-specific nonnucleoside RTIs (NNRTIs), protease inhibitors (PIs), and integrase inhibitors (IIs) did not affect HK2, except for the NNRTI etravirine (ETV). The inhibition of HK2 infectivity by NRTIs appears to take place at either the reverse transcription step of the viral genome prior to HK2 viral particle formation and/or in the infected cells. Inhibition of HK2 by these drugs will be useful in suppressing HK2 infectivity if these viruses prove to be pathogenic in cancer, neurological disorders, or other diseases associated with HK2. The present studies also elucidate a key aspect of the life cycle of HK2, specifically addressing how they do, and/or did, replicate.IMPORTANCE Endogenous retroviruses are relics of ancestral virus infections in the human genome. The most recent of these infections was caused by HK2. While HK2 often remains silent in the genome, this group of viruses is activated in HIV-1-infected and cancer cells. Recent evidence suggests that these viruses are infectious, and the potential exists for HK2 to contribute to disease. We show that HK2, and specifically the enzyme that mediates virus replication, can be inhibited by a panel of drugs that are commercially available. We show that several drugs block HK2 with different efficacies. The inhibition of HK2 replication by antiretroviral drugs appears to occur in the virus itself as well as after infection of cells. Therefore, these drugs might prove to be an effective treatment by suppressing HK2 infectivity in diseases where these viruses have been implicated, such as cancer and neurological syndromes.

Keywords: AZT; HERV-K; NNRTIs; NRTIs; NtRTIs; reverse transcriptase inhibitors.


Figures

FIG 1
FIG 1
Intact HK2 reverse transcriptase genes in the human genome. An amino acid alignment of translated nucleotide reverse transcriptase (RT) genes carried by the HK2 family. The alignment shows 11 proviruses (left) that appear to code for an intact RT with the conserved functional motifs LPQG and YIDD required for reverse transcription. HK2 proviruses K103, K106, K108b, K113, K115, and Xp21.33 are polymorphic among humans. All of these proviruses have intact ORFs in the pol gene. The accession numbers are the following: 1q22/K102, P63135.1; 10p12.1/K103, AAC63291.1 or AF164611; 3q27.2/K117, Q9UQG0.2; 3q13.2/K106, JN675022.1; 5q33.3/K107, P10266.2; 7p22.1b/K108, AAK11553.1; 8p23.1a/K115, P63133.1; 11q22.1/K118, P63136.1; 19p12b/K113, P63132.1; 19q11/KC19, Q9WJR5.2; and Xq21.33, KU054272.1.
FIG 2
FIG 2
Inhibition of reverse transcription by AZT in HK2 particle-producing cells. Fifty thousand cells were seeded in 6-well plates, and the supernatants were collected to measure RT activity. Cells were treated with vehicle or with a 50 μM or 100 μM concentration of AZT for 2 or 7 days. After treatment, cell supernatants were collected and RT activity and HK2 viral genome expression were measured by RT assays and qRT-PCR, respectively. (A) RT activity of HK2 particle-producing cells DT22, T47D, Sk-Mel19, Sk-Mel103, and NCCIT at days 2 and 7 of culture. (B) Percent RT activity of cell line supernatants after treatment with AZT as measured by the EnzChek reverse transcription kit. (C) Abundance of HK2 type 2 env viral genomes in cell supernatants measured by qRT-PCR. Values shown represent the means ± standard deviations (SD) from at least three independent experiments. Stars indicate significant values (P < 0.01 by t test).
FIG 3
FIG 3
Purification and measurement of activity of HK2 reverse transcriptase. The rt gene of proviruses K103, K108, and K113 was cloned in frame with a His tag in the pET32-EK/LIC vector, and the recombinant RT protein was expressed in E. coli and purified using a Ni column. (A) Western blot analysis of the HK2 His-RT proteins. Purified proteins were electrophoresed in 12% PAGE, transferred onto a polyvinylidene difluoride (PVDF) membrane, and detected using an anti-His antibody. The control vector did not produce detectable bands. (B) RT activity of HK2 103, 108, and 113 RT. The RT activity of purified proteins was assessed using the EnzChek reverse transcriptase kit. As a positive control, we used MLV RT. The graph shows the RT activity produced by serially diluted RT enzymes in three independent experiments. No RT activity was detected from the K108b and K113 RT, in heat-inactivated proteins, or in K103 RT denatured in the presence of urea. Values represent the means ± SD from at least three independent experiments.
FIG 4
FIG 4
Functional capacity and fidelity of K103 RT. Capacity of K103 RT to efficiently reverse transcribe HK2 K108 env transcripts produced in vitro in RT-PCRs. Serial dilutions of HK2 DNA-free RNA transcripts ranging from a concentration of 109 to 106 copies per microliter were subjected to RT-PCR using the MLV RT or the K103 RT using the master mix buffer provided by the Qiagen OneStep qRT-PCR kit. (A) An electrophoresis gel showing the amplification products generated by qRT-PCRs using serial dilutions of HK2 transcripts and the negative-control fetal bovine serum (FBS). The upper band represents HK2 amplicon, whereas the lower band represents primer dimer. Efficient amplification was observed when using a lower concentration of K103 RT. Amplification efficiency (B) and melting curve analysis (C) of reverse-transcribed RNAs generated by the MLV RT (left) and the K103 RT. The calibration curves display the squared correlation coefficient (R2). The melting curve analysis shows the melting temperature peaks of the PCR amplicons and the primer dimers in each RT reaction using different enzymes. (D and E) Sequence of HK2 env type 2 (D) or gag (E) PCR amplicons produced by RT-PCRs using K103 RT on HK2 transcripts produced in vitro. Arrows indicate misincorporation of nucleotides, likely generated by the K103 RT. (F and G) Sequence chromatograms of env type 2 (F) and gag (G) on amplicons produced by RT-PCRs using MLV RT on HK2 transcripts. We did not find misincorporation of bases using the MLV RT.
FIG 5
FIG 5
Activity of K103 RT in the presence of NRTIs (A) and NNRTIs and PIs (B). K103 RT activity was measured using the EnzChek reverse transcription kit in the presence of vehicle or different concentrations of triphosphate NRTIs (AZTTP, d4TTP, and 3TCTP); triphosphate chain terminators (ddATP, ddCTP, ddGTP, ddTTP, and ddUTP); NNRTIs (NVP, EFV, and ETV); and the PI APV. The graph shows the percent RT activity (y axis) of the K103 RT in the presence of increasing concentrations of NRTIs, NNRTIs, or PIs (x axis). (C) Activity of MLV RT in the presence of NRITs and NNRTIs. Shown is a plot indicating the RT activity of the enzyme MLV RT in the presence of the triphosphate NRTI AZTTP, d4TTP, ddTTP, or 3TCTP and the NNRTI nevirapine (NVP). RT activity was measured using the EnzChek reverse transcription kit. The graph shows the percent MLV RT activity (y axis) in the presence of increasing concentrations of NRTIs, an NNRTI, or the vehicle (x axis). Values represent the means ± SD from at least three independent experiments. Shown are the 50% inhibitory concentrations (IC50s). No IC50s are shown for drugs that did not inhibit RT activity.
FIG 6
FIG 6
Effect of NRTIs (A) and NNRTIs (B) on the RT activity of NCCIT cells. NCCIT cells were treated with different concentrations (x axis) of NRTIs (AZT, FTC, 3TC, ddC, d4T, ddI, ABC, TDF, and ETV) (A) and NNRTIs (ETV, EFV, and NVP) (B) for 7 days. We measured the percent RT activity (y axis) in cell supernatants using the EnzChek reverse transcription kit. Values represent the means ± SD from at least three independent experiments. Shown are the IC50s. (C) Treatment of NCCIT cells with viral protease inhibitors does not affect RT activity. NCCIT cells were treated with vehicle or increasing concentrations (x axis) of the protease inhibitors atazanavir (ATV), amprenavir (APV), or indinavir (IDV) for 7 days, and the RT activity was measured in the supernatants using the EnzChek reverse transcription kit. We used drug concentrations higher than the IC50 known to inhibit HIV particle assembly (63). The graph displays the percentage of RT activity in the supernatants of cells treated with increasing doses of PIs in three independent experiments. No IC50s are shown for drugs that did not inhibit the RT activity.
FIG 7
FIG 7
Effect of NRTIs and HIV-1 NNRTIs on HK2 viral RNA and DNA forms in the supernatants of NCCIT cells. NCCIT cells were treated with increasing concentrations of NRTIs (AZT, TDF, 3TC, ABC, and FTC) or HIV-1 NNRTIs (ETV, EFV, and NVP) for 7 days. Extracellular HK2 viral RNA and cDNA levels were measured by RT-PCR or PCR, respectively. HK2 type 2 env viral RNA/cDNA levels in supernatants (A) and HK2 env and gag viral cDNA levels in supernatants (B) from cells treated with increasing concentrations of NRTIs or HIV-1 NNRTIs. Values represent the means ± SD from at least three independent experiments. The IC50s for env type 2 RNA/cDNA inhibition are the following: AZT, 0.69; TDF, 0.29; 3TC, 0.29; and FTC, 0.42. The NNRTIs did not inhibit HK2 RNA/cDNA. The IC50s for env type 2 DNA inhibition are the following: AZT, 1.17; 3TC, 0.69; and FTC, 0.25. EFV did not inhibit HK2 DNA. The y axis is set to the log10 scale. Stars indicate differences in the HK2 RNA/cDNA levels between vehicle-treated and drug-treated cells (P < 0.01 by t test).
FIG 8
FIG 8
AZT treatment reduces the abundance of HK2 cDNA copies in NCCIT cells. NCCIT cells were treated with vehicle or 50 μM or 100 μM concentrations of AZT for 7 days. After treatment, DNA was isolated from the cells and the copy number of HK2 type 2 env DNA was measured by qRT-PCR on 500 ng of DNA. No differences were observed in the abundance of the cellular gene gapdh with or without AZT treatment. The graph displays the average number of type 2 env DNA copies as determined in each treatment category in three independent experiments.
FIG 9
FIG 9
Effect of RTIs on infectious HERV-KCON. Infectivity of HERV-KCON virus particles on target 293T cells treated with different concentrations of NRTIs (AZT, TDF, 3TC, ddC, d4T, ddI, FTC, and ABC), chain terminators (ddCTP, ddATP, ddGTP, ddTTP, and ddUTP), HIV-1 NNRTIs (ETV, NVP, and EFV), HIV-1 PIs (APV and IDV), or the HIV-1 integrase inhibitor 118-D-24. Infectious HK2 viral particles were produced in cells transfected with the plasmids HERV-KCON CHKCP and VSVG in the presence of HK2 Rec. 293T target cells pretreated for 24 h with NRTIs, HIV-1 NNRTIs, HIV-1 PIs, or an HIV-1 integrase inhibitor then were infected with HERV-KCON. Target cell infection was measured by counting puromycin CFU. HERV-KCON infection results in stable and authentic integration into the target cell genome as well as episomal forms (49). Values shown represent the means ± SD from two independent experiments. Stars indicate significant differences in the number of infectious units between vehicle-treated and drug-treated cells (P < 0.001 by t test).

Similar articles

Cited by

References

    1. Jern P, Coffin JM. 2008. Effects of retroviruses on host genome function. Annu Rev Genet 42:709–732. doi:10.1146/annurev.genet.42.110807.091501. - DOI - PubMed
    1. Nelson PN, Carnegie PR, Martin J, Davari Ejtehadi H, Hooley P, Roden D, Rowland-Jones S, Warren P, Astley J, Murray PG. 2003. Demystified. Human endogenous retroviruses. Mol Pathol 56:11–18. doi:10.1136/mp.56.1.11. - DOI - PMC - PubMed
    1. Subramanian RP, Wildschutte JH, Russo C, Coffin JM. 2011. Identification, characterization, and comparative genomic distribution of the HK2 group of human endogenous retroviruses. Retrovirology 8:90. doi:10.1186/1742-4690-8-90. - DOI - PMC - PubMed
    1. Barbulescu M, Turner G, Seaman MI, Deinard AS, Kidd KK, Lenz J. 1999. Many human endogenous retrovirus K (HERV-K) proviruses are unique to humans. Curr Biol 9:861–868. doi:10.1016/S0960-9822(99)80390-X. - DOI - PubMed
    1. Lenz J. 2016. HK2 diversity among humans. Proc Natl Acad Sci U S A 2016 113:4240–4242. doi:10.1073/pnas.1603569113. - DOI - PMC - PubMed

Publication types

MeSH terms