. 2017 Sep 21;2(18):e93397.
doi: 10.1172/jci.insight.93397.

Combination immunotherapy with TLR agonists and checkpoint inhibitors suppresses head and neck cancer

Affiliations

Combination immunotherapy with TLR agonists and checkpoint inhibitors suppresses head and neck cancer

Fumi Sato-Kaneko et al. JCI Insight. .

Abstract

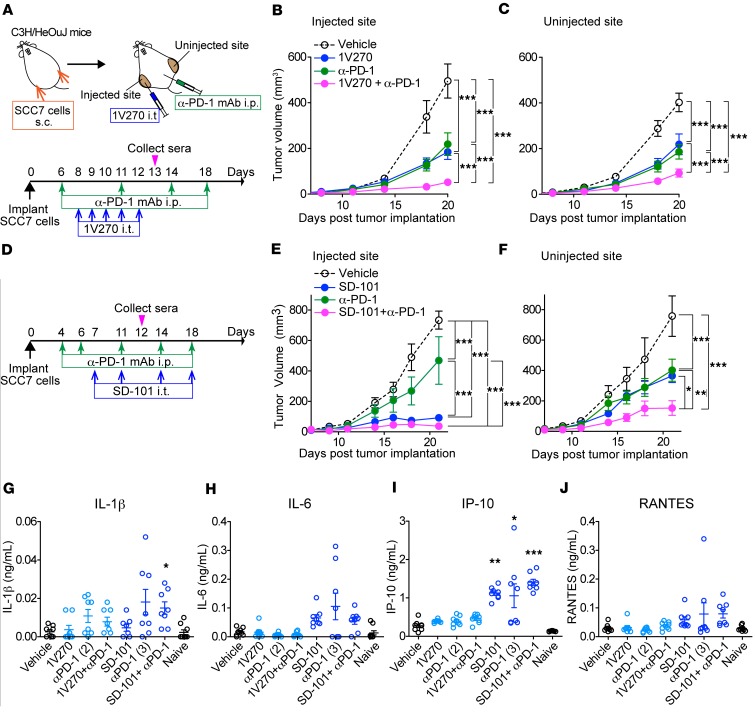
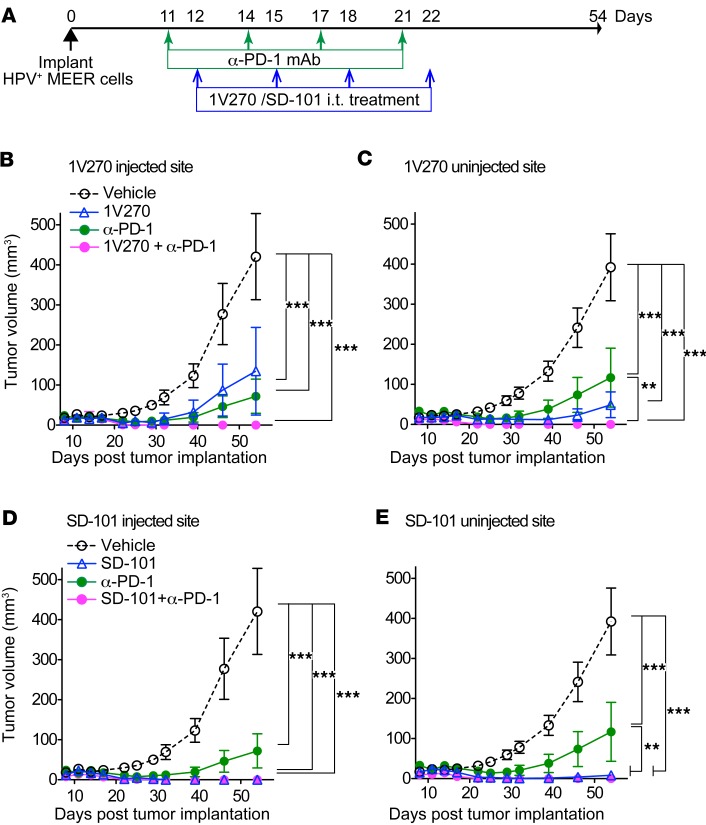
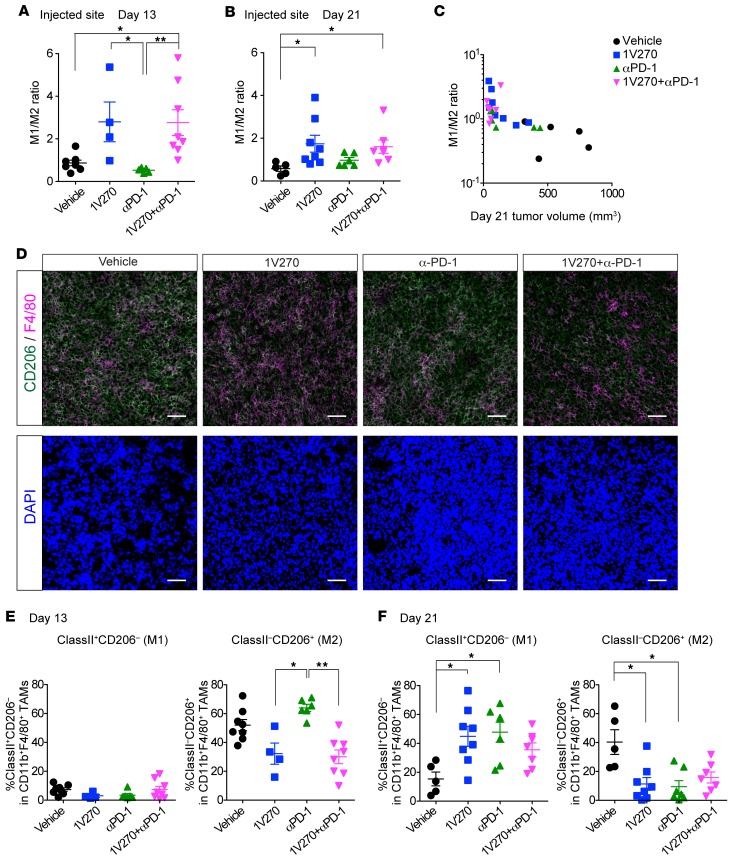
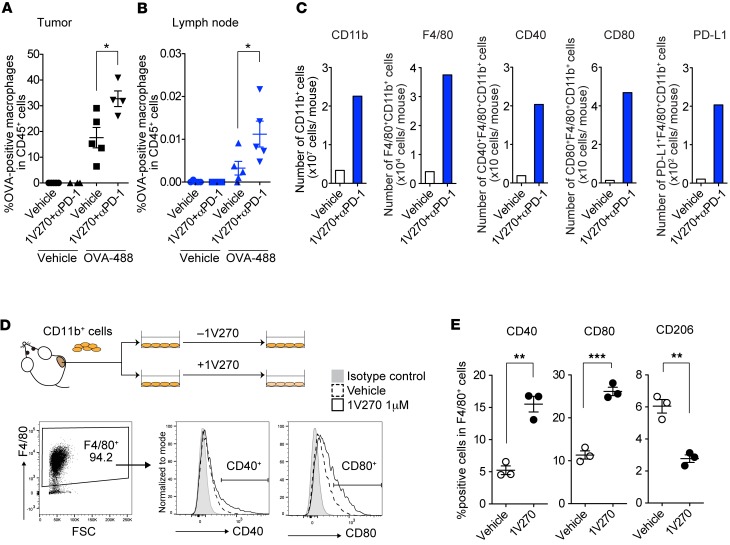
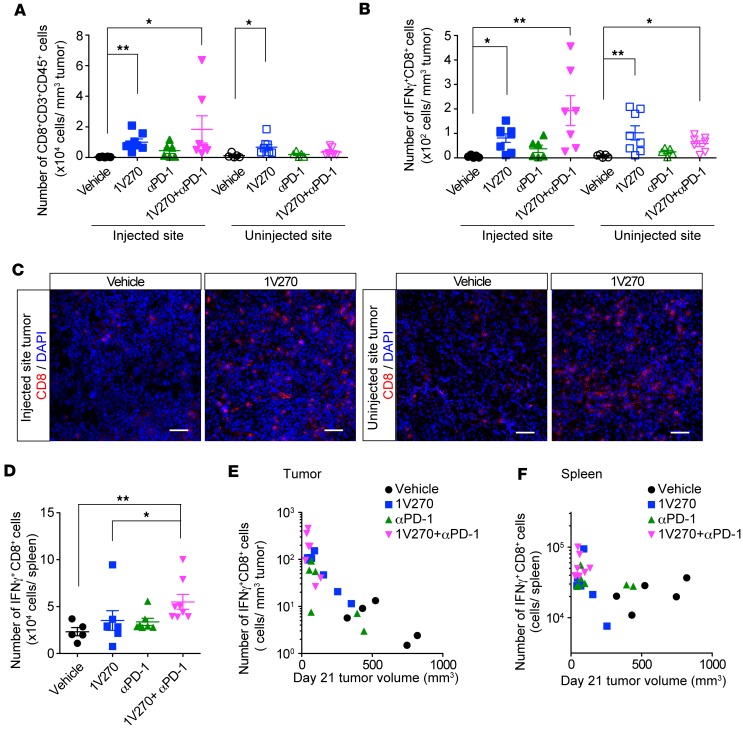
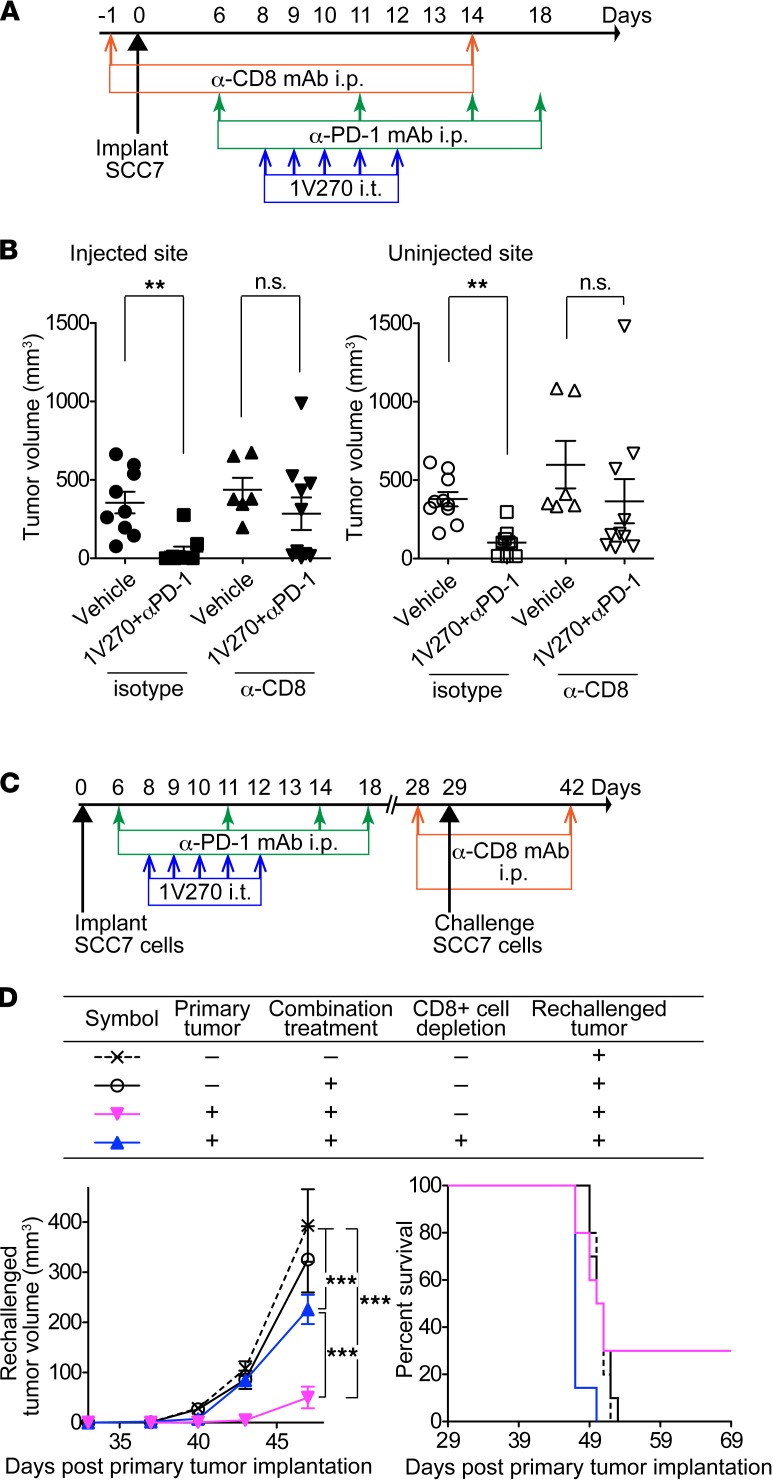
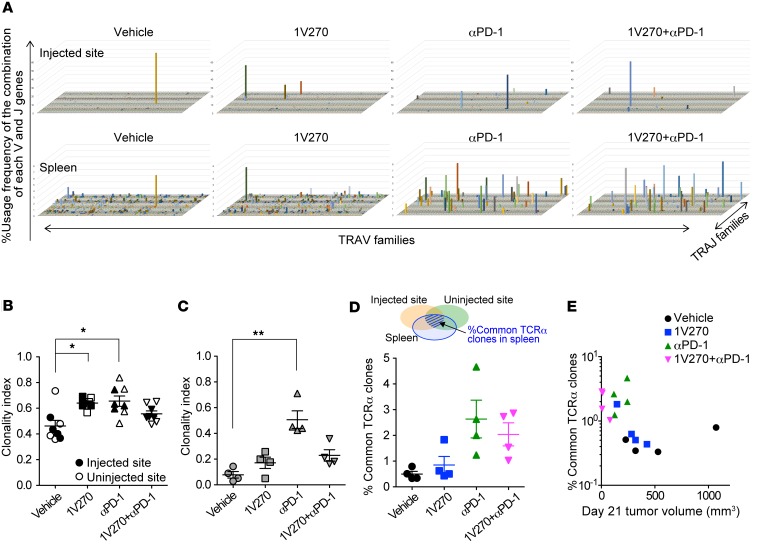
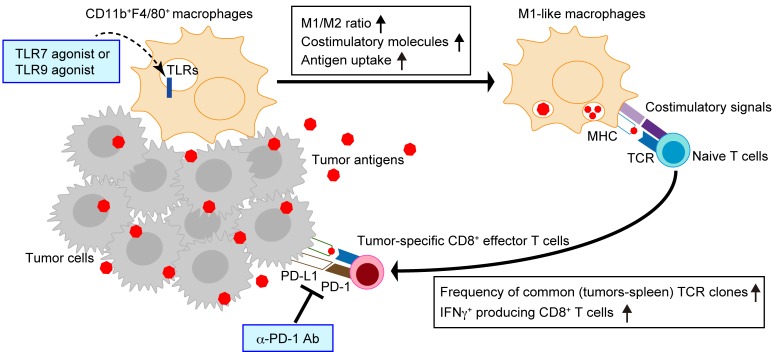
Checkpoint inhibitors have demonstrated efficacy in patients with recurrent or metastatic head and neck squamous cell carcinoma (HNSCC). However, the majority of patients do not benefit from these agents. To improve the efficacy of checkpoint inhibitors, intratumoral (i.t.) injection with innate immune activators, TLR7 and TLR9 agonists, were tested along with programmed death-1 receptor (PD-1) blockade. The combination therapy suppressed tumor growth at the primary injected and distant sites in human papillomavirus-negative (HPV-negative) SCC7 and MOC1, and HPV-positive MEER syngeneic mouse models. Abscopal effects and suppression of secondary challenged tumor suggest that local treatment with TLR agonists in combination with anti-PD-1 provided systemic adaptive immunity. I.t. treatment with a TLR7 agonist increased the ratio of M1 to M2 tumor-associated macrophages (TAMs) and promoted the infiltration of tumor-specific IFNγ-producing CD8+ T cells. Anti-PD-1 treatment increased T cell receptor (TCR) clonality of CD8+ T cells in tumors and spleens of treated mice. Collectively, these experiments demonstrate that combination therapy with i.t. delivery of TLR agonists and PD-1 blockade activates TAMs and induces tumor-specific adaptive immune responses, leading to suppression of primary tumor growth and prevention of metastasis in HNSCC models.

Keywords: Cancer immunotherapy; Head & neck cancer; Immunology.


Conflict of interest statement

Conflict of interest: DAC is a founder of Dynavax Technologies Corporation.

Figures

Figure 1
Figure 1. Combination therapy with i.t. administration of TLR agonists and systemic anti–PD-1 antibody inhibits tumor growth at both primary and distant sites.
(A–C) The combination therapy with 1V270 and anti–PD-1 antibody. Experimental protocol of the combination therapy with 1V270 and anti–PD-1 antibody (A). SCC7 (1 × 10⁵) cells were implanted in both flanks (n = 12–16/group). 1V270 (100 μg/injection) was i.t. injected into right flank (injected site) daily from days 8–12. Anti–PD-1 antibody or isotype mAb (250 μg/injection) was given i.p. on day 6, 11, 14, and 18. (B and C) Tumor growth at 1V270 injected (B) and uninjected (C) sites was monitored. (D–F) The combination therapy with SD-101 and anti–PD-1. Experimental protocol of the combination therapy with SD-101 and anti–PD-1 antibody (D). SCC7-bearing mice (n = 7–8/group) received SD-101 (50 μg/injection) i.t. in right flank on days 7, 11, 14, and 18. Anti PD-1 antibody (250 μg/injection) was given on day 4, 6, 11, 14, and 18. Tumor growth at injected (E) and uninjected (F) sites was monitored. Data (means ± SEM) are pooled from 2–3 independent experiments showing similar results. *P < 0.05, **P < 0.01, ***P < 0.001 (two-way repeated measures ANOVA with Bonferroni post hoc test). (G–J) Systemic cytokine induction by 1V270 or SD-101 as monotherapy or in combination with anti–PD-1 antibody. Serum samples were collected on day 13 in the experiment using 1V270 (1 day after the last i.t.1V270 injection and 2 days after the second anti–PD-1 treatment) (A), and day 13 in the experiments using SD-101 (1 day after i.t. SD-101/third anti–PD-1 treatment) (D) (magenta arrowheads). Levels of cytokine production of IL-1β (G), IL-6 (H), IP-10 (I), and RANTES (J) were determined by Luminex beads assay. Data represent mean ± SEM. *P < 0.05, **P < 0.01 (Kruskal-Wallis test with Dunn’s post hoc test comparing treatment groups against vehicle).
Figure 2
Figure 2. I.t. treatment with 1V270 or SD-101 suppresses tumor growth of HPV-positive HNSCC.
(A) HPV-positive MEER cells (2 × 10⁶) were implanted in both flanks of C57BL/6 mice. When the tumors reached 2–4 mm diameter, tumor-bearing mice (n = 10/group) were given i.t. 1V270 or SD-101 alone or in combination with anti–PD-1 antibody. (B–E) Tumor growth in mice treated with 1V270 or SD-101 is shown in separate figures using the same data of tumor growth in mice treated with vehicle and anti–PD-1 antibody as the following: (B) 1V270 injected site, (C) 1V270 uninjected site, (D) SD-101 injected site, and (E) SD-101 uninjected site. Combination therapy (magenta, closed circle) and SD-101 monotherapy (blue, open triangle) overlapped after day 22 in D. Data represent mean ± SEM. **P < 0.01, ***P < 0.001 (two-way repeated measures ANOVA with Bonferroni post hoc test). Data shown are representative of two independent experiments showing similar results.
Figure 3
Figure 3. I.t. injection of 1V270 increases M1/M2 ratio in TAMs.
(A–D) SCC7-bearing C3H mice (n = 4–8/group) were treated as described in Figure 1A. Tumors were harvested on day 13 (A) and 21 (B) and tumor-infiltrating cells were analyzed by flow cytometry. TAMs were identified as CD45+CD11b+F4/80+ subset. CD206 expression was used to identify M2 macrophages. The ratios of M1 to M2 (M1/M2) were calculated as % M1 (CD206) population in CD45+CD11b+F4/80+ divided by % M2 (CD206+) population in CD45+CD11b+F4/80+. M1/M2 ratios of TAMs on days 13 (A) and 21 (B) are shown as scatter plots. Each dot represents an individual animal, and bars indicate means ± SEM. *P < 0.05 and **P < 0.01 (Kruskal-Wallis test with Dunn’s post hoc test). (C) The relationship between the M1/M2 ratio and tumor volume (day 21). Spearman r = –0.74, P < 0.0001. Both the tumor volume at day 21 and the M1/M2 ratio differ significantly among treatment groups (P < 0.05). The significant correlation between tumor volumes and M1/M2 ratio disappeared when we adjusted for the treatment groups. (D) Representative IHC images of the tumors (day 21). Section (5 μm) of cryopreserved tumor tissue was stained for F4/80 (magenta), CD206 (green), and DAPI (blue). Scale bars: 20 μm. (E and F) Kinetics of M1 and M2 population after the 1V270 injection. TAMs on days 13 and 21 were analyzed. M1- and M2 -like macrophages were identified as CD206MHC class II+ and CD206+MHC class II populations, respectively. Each dot represents an individual animal, and bars indicate means ± SEM. *P < 0.05 and **P < 0.01 (Kruskal-Wallis test with Dunn’s post hoc test).
Figure 4
Figure 4. I.t. 1V270 treatment enhances antigen-presenting function of TAMs.
(A and B) Analysis of antigen uptake by TAMs in vivo. SCC7-bearing mice (n = 4–5/group) were given the combination treatment (Figure 1A). Antigen (OVA–Alexa Fluor 488) was i.t. injected with the last 1V270 injection. Twenty-four hours later (day 13 after tumor implantation), tumors (A) and draining lymph nodes (dLNs) (B) were harvested, and OVA–Alexa Fluor 488–positive cells in the gated CD45+ population were evaluated by flow cytometry. *P < 0.05 (two-tailed, Welch’s t test). (C) Combination therapy enhanced the expression of costimulatory molecules in the dLN in vivo. SCC7-bearing mice (n = 4–6/group) received the combination treatment as described in Figure 1A. dLN at 1V270 injected sites were harvested on day13. The dLN cells were pooled from each group, the expression of CD40 and CD80 in CD45+CD11b+F4/80+ macrophages was evaluated by flow cytometry, and the numbers of CD40+, CD80+ and PD-L1+ cells per an individual animal were calculated. (D and E) Activation of TAMs by 1V270 treatment ex vivo. CD11b+ cells were isolated from the untreated SCC7-tumor (day 14) using MACS MicroBeads. CD11b+ cells (1.2 × 10⁶/ml) were incubated with 1V270 (1 μM) or vehicle overnight, and the expression of CD40 and CD80 in the gated CD11b+F4/80+ population was assessed by flow cytometric analysis. (D) Representative flow cytometric histogram of CD40, and CD80, and (E) percentage of CD40+, CD80+, and CD206+ cell populations in the gated CD45+CD11b+F4/80+ macrophage population are shown. Data presented are means ± SEM of triplicates and representative of two independent experiments showing similar results. **P < 0.01, ***P < 0.001 (two-tailed, Welch’s t test).
Figure 5
Figure 5. Combination therapy with i.t. 1V270 and systemic anti–PD-1 antibody increases activated CD8+ population in TILs and spleens.
(A–F) 1V270 increased CD8+ population in TILs. C3H mice (n = 5–8/group) were implanted with SCC7 and were treated as described in Figure 1A. Tumors and spleens were harvested on day 21, and T cells in TILs or spleens were analyzed by flow cytometry. (A and B) Tumor-infiltrating CD8+ T cells were gated on CD45+CD3+CD8+ populations. Numbers of CD8+ T cells (A) and IFNγ+CD8+ cells (B) per tumor volume (mm3) were calculated and plotted. (C) Representative IHC images of the tumors (day 21) stained for CD8 (red) and DAPI (blue). Scale bars: 20 μm. (D) Number of IFNγ+CD8+ T cells in spleens. Bars indicate mean ± SEM. Each dot represents an individual animal, and bars indicate mean ± SEM in A, B, and D. *P < 0.05, **P < 0.01 (Kruskal-Wallis test with Dunn’s post hoc test), n = 5–8/group. (E) Tumor volumes at the injected sites were plotted against the log of the number of IFNγ+CD8+ T cells in the TME. Significant negative correlation was demonstrated by Spearman correlation test. Spearman r = –0.84, P < 0.0001, n = 26 mice. (F) The tumor volumes (day 21, injected side) were plotted the log of the number of IFNγ+CD8+ T cells in the spleen (Spearman r = –0.42, P = 0.03, n = 26 mice).
Figure 6
Figure 6. Absence of CD8+ cells abrogated antitumor effects of the combination therapy on primary, distant, and secondary-challenged tumors.
(A) Effect of CD8+ cell depletion on the primary tumor growth. Anti-CD8/Lyt2.1 mAb or mouse IgG2a were injected on days –1 and 14. SCC7-bearing mice (n = 6–10/group) were treated with the combination therapy. (B) Tumor volumes on day 18 were compared between vehicle and the combination therapy on injected primary and distant sites. **P < 0.01 (Kruskal-Wallis test with Dunn’s post hoc test). (C) Effects of CD8+ cell depletion on growth of the secondary challenged tumors. SCC7-bearing mice (n = 7–10/group) were treated with the combination therapy. Anti-CD8/Lyt2.1 mAb was i.p. injected on days 28 and 42. The secondary tumors were implanted on day 29. (D) Growth curves of the secondary challenged tumors (left) and Kaplan-Meier survival curves (right). Data represent mean ± SEM. ***P <0.001 (two-way repeated measures ANOVA with Bonferroni post hoc test).
Figure 7
Figure 7. Systemic anti–PD-1 antibody or combination treatment increased TCR clonality of CD8+ T cells.
(A–D) SCC7-bearing mice (n = 4/group) were treated as described in Figure 1A. Tumors and spleens were harvested on day 21, and CD8+ T cells were isolated using MACS MicroBeads. RNA was isolated, and next-generation sequencing was performed. (A) Representative TCR repertoire clonalities of CD8+ T cells. The x and y axes show the combination of V and J genes (TRAV and TRAJ families), and the z axis shows their frequency of usage. (B and C) Clonality index (1-normalized Shannon index) in injected and distant uninjected tumors (B) and spleens (C). Higher values of the clonality index reflect TCR clonal expansions. Closed and open symbols indicate injected and uninjected tumors, respectively. *P < 0.05, **P < 0.01 (Kruskal-Wallis test with Dunn’s post hoc test). (D) Percentage of clones commonly identified in the injected, uninjected tumors, and spleen in total splenic reads of individual mice. (E) The tumor volumes on day 21 were plotted against the log of % common TCR clones. Significant negative correlation was assessed by a Spearman rank correlation test. Spearman r = –0.69, P < 0.0038, n = 16 mice.
Figure 8
Figure 8. TLR agonist effect with anti–PD-1 antibody in HNSCC.
I.t. TLR agonists treatment increases the M1/M2 ratio in the TME, promoting antigen-presenting functions of TAMs and tumor-specific T cell differentiation. Local administration of TLR agonists also increases recruitment of tumor-specific CD8+ T cells to the tumor and draining lymph nodes. The checkpoint inhibitor, anti–PD-1 antibody, increases the frequency of TCR clones commonly identified in injected and uninjected tumors and spleen in individual mice.

Similar articles

Cited by

References

    1. Leemans CR, Braakhuis BJ, Brakenhoff RH. The molecular biology of head and neck cancer. Nat Rev Cancer. 2011;11(1):9–22. doi: 10.1038/nrc2982. - DOI - PubMed
    1. Siegel RL, Miller KD, Jemal A. Cancer statistics, 2016. CA Cancer J Clin. 2016;66(1):7–30. doi: 10.3322/caac.21332. - DOI - PubMed
    1. D’Souza G, et al. Case-control study of human papillomavirus and oropharyngeal cancer. N Engl J Med. 2007;356(19):1944–1956. doi: 10.1056/NEJMoa065497. - DOI - PubMed
    1. Fakhry C, et al. Improved survival of patients with human papillomavirus-positive head and neck squamous cell carcinoma in a prospective clinical trial. J Natl Cancer Inst. 2008;100(4):261–269. doi: 10.1093/jnci/djn011. - DOI - PubMed
    1. Whang SN, Filippova M, Duerksen-Hughes P. Recent Progress in Therapeutic Treatments and Screening Strategies for the Prevention and Treatment of HPV-Associated Head and Neck Cancer. Viruses. 2015;7(9):5040–5065. doi: 10.3390/v7092860. - DOI - PMC - PubMed

Publication types