. 2017 Sep 20;8(1):614.
doi: 10.1038/s41467-017-00715-0.

Laminar differences in decision-related neural activity in dorsal premotor cortex

Affiliations

Laminar differences in decision-related neural activity in dorsal premotor cortex

Chandramouli Chandrasekaran et al. Nat Commun. .

Abstract

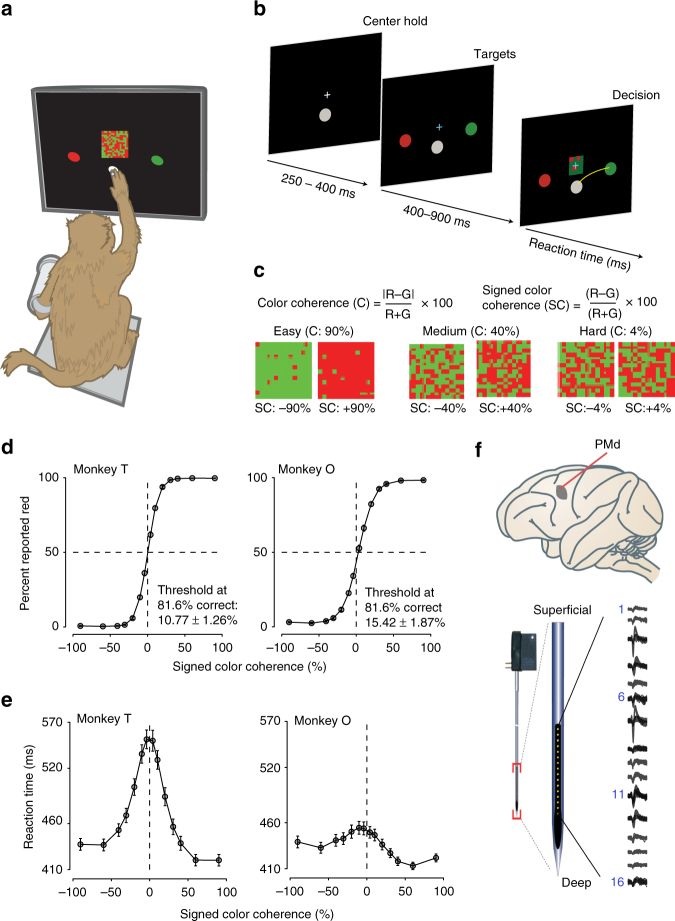
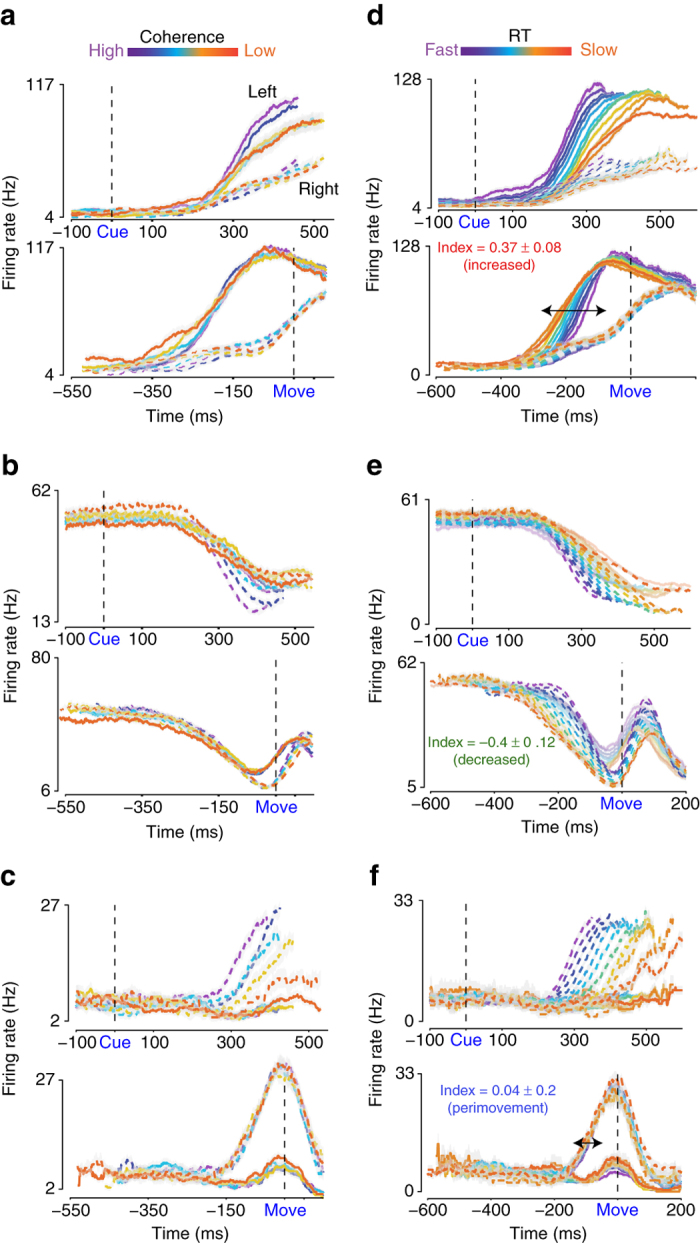
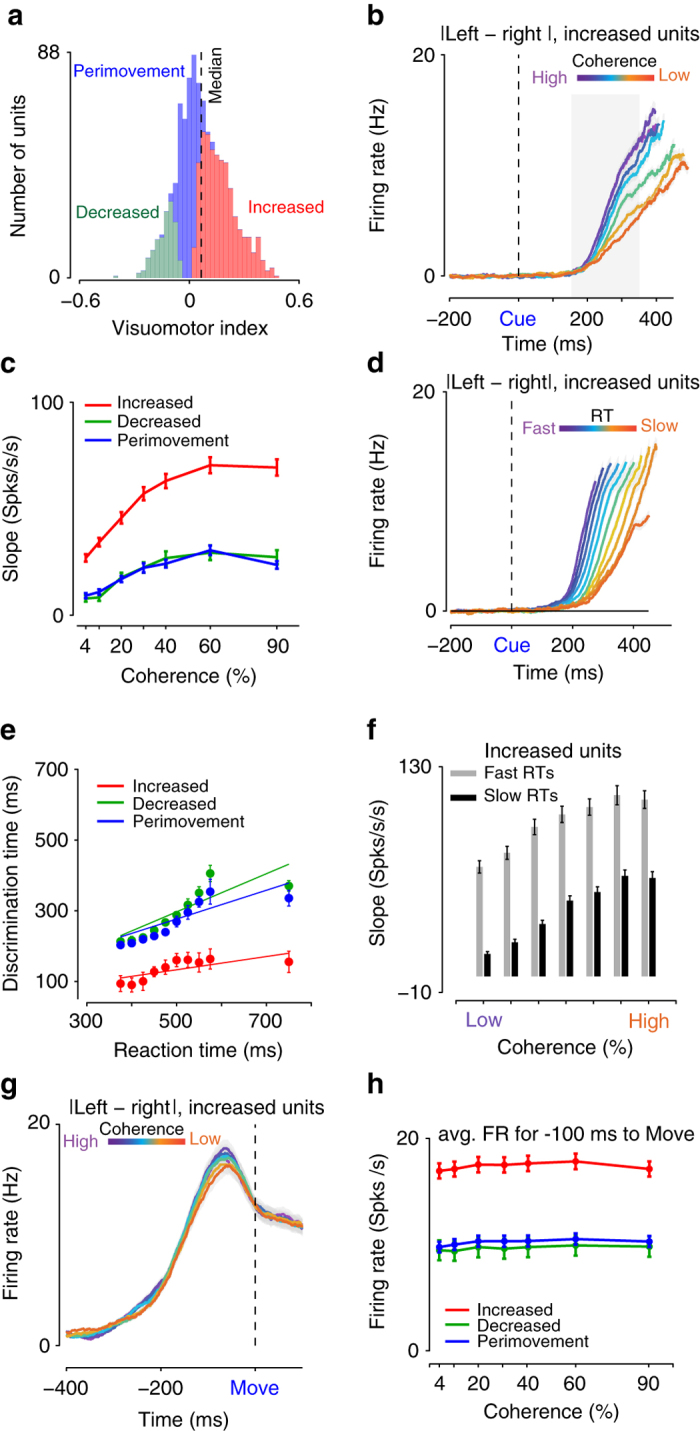
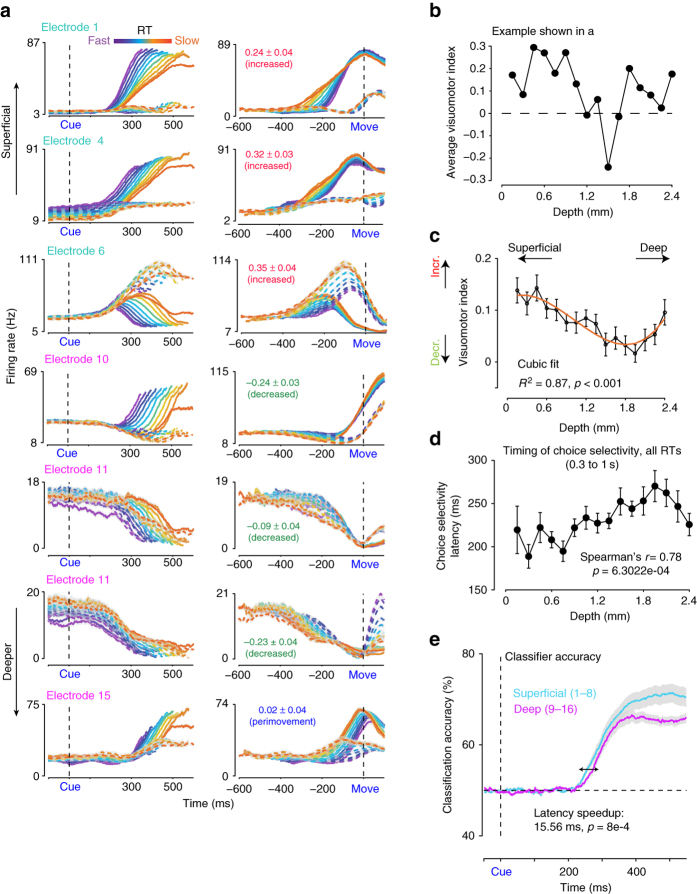
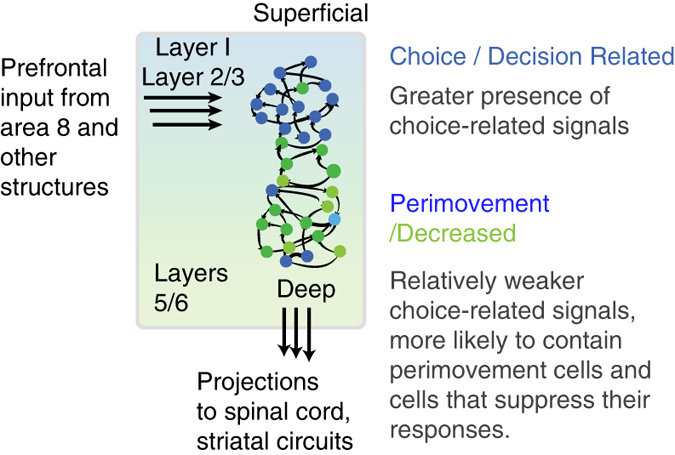
Dorsal premotor cortex is implicated in somatomotor decisions. However, we do not understand the temporal patterns and laminar organization of decision-related firing rates in dorsal premotor cortex. We recorded neurons from dorsal premotor cortex of monkeys performing a visual discrimination task with reaches as the behavioral report. We show that these neurons can be organized along a bidirectional visuomotor continuum based on task-related firing rates. "Increased" neurons at one end of the continuum increased their firing rates ~150 ms after stimulus onset and these firing rates covaried systematically with choice, stimulus difficulty, and reaction time-characteristics of a candidate decision variable. "Decreased" neurons at the other end of the continuum reduced their firing rate after stimulus onset, while "perimovement" neurons at the center of the continuum responded only ~150 ms before movement initiation. These neurons did not show decision variable-like characteristics. "Increased" neurons were more prevalent in superficial layers of dorsal premotor cortex; deeper layers contained more "decreased" and "perimovement" neurons. These results suggest a laminar organization for decision-related responses in dorsal premotor cortex.Dorsal premotor cortex (PMd) is thought to be involved in making somatomotor decisions. Chandrasekaran et al. investigated the temporal response dynamics of PMd neurons across cortical layers and show stronger and earlier decision-related responses in the superficial layers and more action execution-related signals in the deeper layers.


Conflict of interest statement

The authors declare no competing financial interests.

Figures

Fig. 1
Fig. 1
Recording locations, techniques, task, and discrimination behavior. a An illustration of the setup for discrimination. We gently restrained the arm the monkey was not using with a plastic tube and cloth sling. We tracked a reflective IR bead taped on the middle digit of the hand to mimic a touch screen and to provide an estimate of instantaneous arm position and tracked eye position using an infrared reflective mirror placed in front of the monkey’s nose. b Timeline of the discrimination task. c Examples of different stimulus ambiguities used in the experiment parameterized by the color coherence of the checkerboard cue defined as (C = 100×|R − G|/(R + G)). The corresponding SC is defined as SC = 100×(R − G)/(R + G). Positive values of SC denote more red than green squares and vice versa. d, e Average discrimination performance (d) and RT (e) over sessions of the two monkeys as a function of the SC of the checkerboard cue. RT plotted here includes both correct and incorrect trials for each session and then averaged across sessions. Gray markers show measured data points along with 2 × SEM estimated over sessions. The black line segments are drawn in between these measured data points to guide the eye. For many data points in d, the error bars lie within the marker. X-axes in both d, e depict the SC in %. Y-axes depict the percent responded red in d and RT in e. Also shown in d are discrimination thresholds (M ± SD over sessions) estimated from a Weibull fit to the overall percent correct as a function of coherence. The discrimination threshold is the color coherence level at which the monkey made 81.6% correct choices. 75 sessions for monkey T (128,989 trials) and 66 sessions for monkey O (108,344 trials) went into the averages. f Location of PMd along with an example recording from a 16 electrode, 150-micron spacing U-probe. The brain in this figure is adapted by permission from Macmillan Publishers Ltd: Nature Reviews Neuroscience (Fig. 3 of ref. ), copyright 2004
Fig. 2
Fig. 2
FRs in PMd demonstrate an organized relationship to different elements of the decision-making process. ac Three example units in PMd during the decision task sorted by color coherence and arm movement choice when aligned to checkerboard cue onset (labeled as “cue”, top panel) or movement onset (bottom panel). Solid lines of different colors (—) depict left reaches; dashed lines of varying colors (---) depict right reaches. The colors ranging from purple to orange depict color coherence (high to low). The black dashed lines depict the onset of the checkerboard cue (top panels) or the onset of the arm movement (bottom panels). When aligned to checkerboard cue onset, FR is plotted until the median RT for the color coherence. When aligned to movement onset, the FR is plotted until the negative of the median RT for the color coherence. Error bars denote standard error of the mean (SEM) over trials. We estimated peristimulus and perimovement FRs by convolving spike trains with 75 ms causal boxcars. Averages include all trials sorted according to the choice of the monkey (left vs. right). Unit a: 782 trials, Unit b: 1454 trials, Unit c: 655 trials. Individual traces are averages of at least 30 trials. df FRs of the units that are shown in ac when sorted by RT. The colors ranging from purple to orange depict RT bins (fast to slow, all color coherences combined). Line conventions for left and right reach directions are as in ac. FR traces, when aligned to checkerboard cue onset and organized by RT, are shown until the center point of the RT bin. The visuomotor index (see Fig. 3a, and corresponding text), along with the label is shown for each unit along with CI for the index. The index is significantly different from 0 for units in a, b (CIs do not overlap with 0) but not c (CIs overlap with 0). The trials used in df are same as those used for the plots in ac except re-sorted according to the various RT bins. In Fig. 2e, FR traces for the left reaches are deliberately reduced in opacity to better highlight the structure in the FR traces for right reaches and their organization with RT. FRs for left reaches also have the same structure. Additional examples of unit responses in PMd that increase, decrease, or are perimovement in nature are shown in Fig. 4 and Supplementary Fig. 11a
Fig. 3
Fig. 3
Units in PMd that enhance FRs after checkerboard cue onset covaries strongest with the decision process. a Histogram of the visuomotor index demonstrating broad unit categories in PMd. Significant positive numbers reflect increased units (shaded red, n = 514 units), significant negative numbers for decreased units (shaded green, n = 141 units). Intermediate insignificant values of the visuomotor index reflect the perimovement structure of these units (shaded blue, n = 341 units). The index is defined on a per-unit basis and measured as the trial-by-trial correlation coefficient between RT and average FR in the −600 to −200 ms epoch before movement onset. X-axes depict index; Y-axes the number of units. b Average population level choice selective signal (|left—right|) in PMd for the population of increased units (n = 514 units) as a function of the color coherence aligned to checkerboard cue onset. All trials are included and sorted by the choice of the monkey. The colors ranging from purple to orange depict color coherence (high to low). X-axes depict time in ms; Y-axes depict the FR in Hz. Shaded errors denote SEM over units. For each unit, we also subtracted the absolute difference in baseline FR before averaging. The gray shaded region highlights the 150–350 ms epoch used to estimate the slopes plotted in Fig. 3c. c Slope of the choice selectivity signal (as shown in b) in the 150–350 ms epoch (for e.g. demarcated by the shaded gray region in b) after checkerboard cue onset for increased (514 units), decreased (141 units), and perimovement units (341 units) in PMd for the seven different color coherence levels. Red color denotes increased units. Blue and green colors denote the perimovement and decreased units. Error bars are SEM estimated over units. We compared the slopes of these curves to a slope estimated through shuffling across color coherences. d Average population level choice selective signal (|left—right|) in PMd for the increased units (n = 514 units) as a function of the RT aligned to checkerboard cue onset. Different colored lines here depict different levels of RT; purple colors depict fast RTs, orange colors depict slow RTs. X-axes depict time in ms; Y-axes the FR in Hz. For each unit, we also subtracted the absolute difference between left and right FRs during the hold period for each unit before averaging across units. e The population response of increased units (shown in red) begins to signal the eventual choice ~100–150 ms after checkerboard cue onset regardless of RT. Perimovement (shown in blue, 341 units) and decreased units (shown in green, 141 units) signal choice closer to movement onset. Y-axes plot the discrimination time defined as the first time at which the choice selective signal significantly departed from the FR before the onset of the checkerboard cue (i.e., the hold period) as estimated using a paired t-test that corrected for multiple comparisons. X-axes depict different RT bins. The error bars on this time estimate are calculated by bootstrapping FRs for each unit and then estimating the latency using this bootstrapped FR distribution for the subpopulation of units. Lines denote regression fits of the average latency to the center of the RT bin. f Covariation with RT was observed within a color coherence level for the increased units. For these units, the mean rate of rise of the choice selective signal was faster for faster RTs even within each level of color coherence (for every unit, RTs were split into fast and slow RTs using the median RT). X-axes depict different levels of color coherence. Y-axes the slope of the choice selective signals in the 150–350 ms after checkerboard cue onset as in c. Error bars denote SEM over units. g When aligned to movement onset, for increased units (n = 514) the average choice selective signal ~100 ms before movement onset only modestly covaries with color coherence. The colors ranging from purple to orange depict color coherence (high to low). X-axes depict time in ms. Y-axes the magnitude of the choice selectivity signal in Hz. Shaded errors denote SEM. h By the time of movement onset, the average choice selective signal in the −100 ms to move onset for any of the various broad classes of units in PMd does not strongly change depending on the color coherence of the checkerboard cue. The slopes of the curves are not significantly different from slopes estimated via shuffling. X-axes depict color coherence in %. Y-axes depict the FR in the −100 ms to 0 ms before movement onset
Fig. 4
Fig. 4
Laminar differences in the time course of decision-related signals in PMd. a PSTHs from seven different units recorded in the same session sorted as a function of RT and choice and ordered from superficial to deep electrodes. The FRs are aligned relative to checkerboard cue onset (left) or to movement onset (right). The colors ranging from purple to orange depict different RT bins. Shaded errors denote SEM. Solid lines depict left reaches and dashed lines depict right reaches. Peristimulus and perimovement FRs are estimated by convolving spike trains with 75 ms causal boxcars. Averages include all trials sorted according to the choice of the monkey (left vs. right). Also shown for each unit is the visuomotor index estimated for the unit along with confidence intervals and the label associated with the unit based on the visuomotor index. The rough pattern that this single example and a similar example shown in Supplementary Fig. 11 is that superficial electrodes have positive indices denoting increased units whereas the deeper electrodes are likely to have more perimovement and decreased units. X-axes depict time in ms. Y-axes depict FR in Hz. PSTHs and PMTHs reflect FR averaged over more than 100 trials per condition. >1800 trials were analyzed for these units. These trials were then separated according to the condition. b Visuomotor index as a function of cortical depth for the session shown in Fig. 4a. X-axes depict depth in mm. Y-axes depict the index. Error bars denote SEM. Visuomotor index for each electrode is estimated by averaging over all units recorded on that particular channel. c The visuomotor index estimated by pooling over sessions from both monkeys T and O decreases as a function of depth (68 sessions, 554 units). X-axes depict depth in mm. Y-axes depict the index. Error bars denote SEM. The line (shown in orange) is the fit of this average index vs. cortical depth using a cubic function (ax 3 + bx 2 + cx + d). x is a variable denoting cortical depth. Reported p-value for the fit is obtained by a permutation test where we shuffled to remove the relationship between the index and cortical depth and computed the fit. We repeated this shuffling 1000 times and fit the cubic function to estimate a surrogate distribution of R 2 values. A simple linear regression was also significant (R 2 = 0.61, p < .001). We chose higher order fits because of the non-monotonic nature of the change in the index as a function of cortical depth. d Average choice selectivity as a function of cortical depth for the population of PMd neurons. X-axis depicts depth in mm. Y-axis the discrimination latency in ms. Error bars denote SEM estimated over sessions. e Classifier accuracy for superficial (electrodes 1–8) and deep (9–16) as a function of time for all RTs when aligned to checkerboard cue onset. The classification was performed on a session-by-session basis, and the number of units used for superficial and deep electrodes were equalized by setting the number of units used for the superficial and deep classifiers to be the same. We only used sessions where we had greater than 10 units recorded from the U-probes in this classification analysis. We used 50 ms bins stepped by 2 ms bins and used a linear classifier
Fig. 5
Fig. 5
A schematic architecture for decision-making in PMd. The superficial layers of PMd are thought to receive inputs from prefrontal and prearcuate areas. The deeper layers of PMd are thought to project to subcortical and spinal circuits. Differences in anatomical connectivity is one hypothesis for why choice-related activity emerges earlier in the superficial compared to the deeper electrodes

Similar articles

Cited by

References

    1. Hoshi E. Cortico-basal ganglia networks subserving goal-directed behavior mediated by conditional visuo-goal association. Front. Neural Circuits. 2013;7:158. doi: 10.3389/fncir.2013.00158. - DOI - PMC - PubMed
    1. Wolpert DM, Landy MS. Motor control is decision-making. Curr. Opin. Neurobiol. 2012;22:996–1003. doi: 10.1016/j.conb.2012.05.003. - DOI - PMC - PubMed
    1. de Lafuente V, Jazayeri M, Shadlen MN. Representation of accumulating evidence for a decision in two parietal areas. J. Neurosci. 2015;35:4306–4318. doi: 10.1523/JNEUROSCI.2451-14.2015. - DOI - PMC - PubMed
    1. Romo R. Conversion of sensory signals into perceptions, memories and decisions. Prog. Neurobiol. 2013;103:1–2. doi: 10.1016/j.pneurobio.2013.03.003. - DOI - PubMed
    1. Cisek P, Kalaska JF. Neural mechanisms for interacting with a world full of action choices. Annu. Rev. Neurosci. 2010;33:269–298. doi: 10.1146/annurev.neuro.051508.135409. - DOI - PubMed

Publication types