. 2017 Sep 20;8(1):612.
doi: 10.1038/s41467-017-00514-7.

Automatic and adaptive heterogeneous refractive index compensation for light-sheet microscopy

Affiliations

Automatic and adaptive heterogeneous refractive index compensation for light-sheet microscopy

Duncan P Ryan et al. Nat Commun. .

Abstract

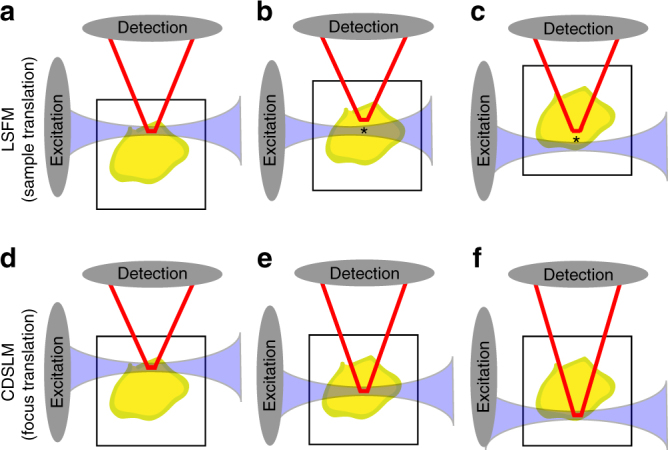
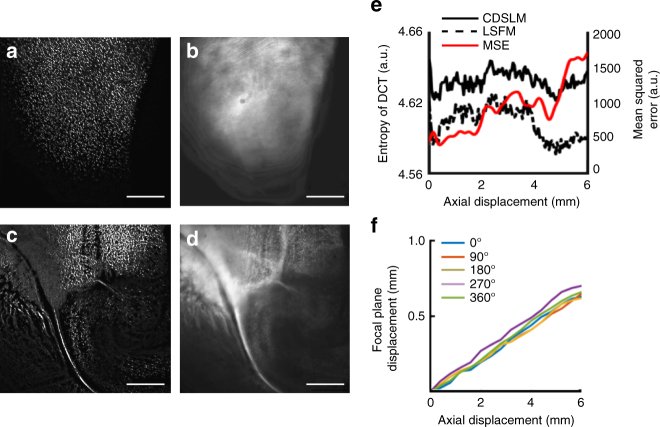
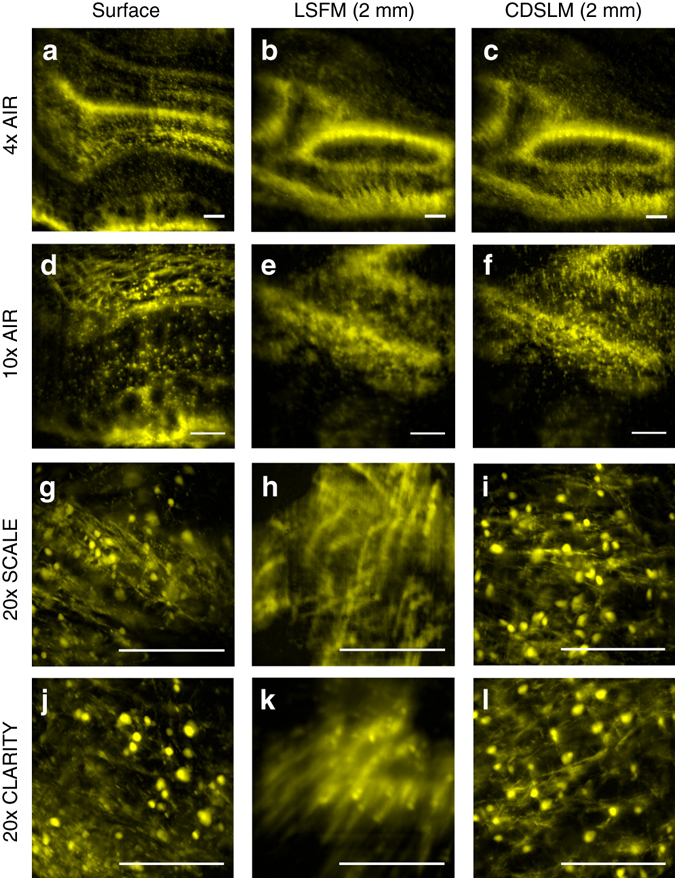
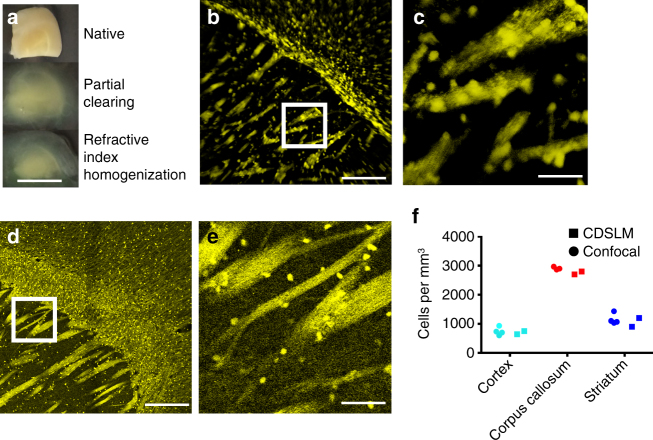
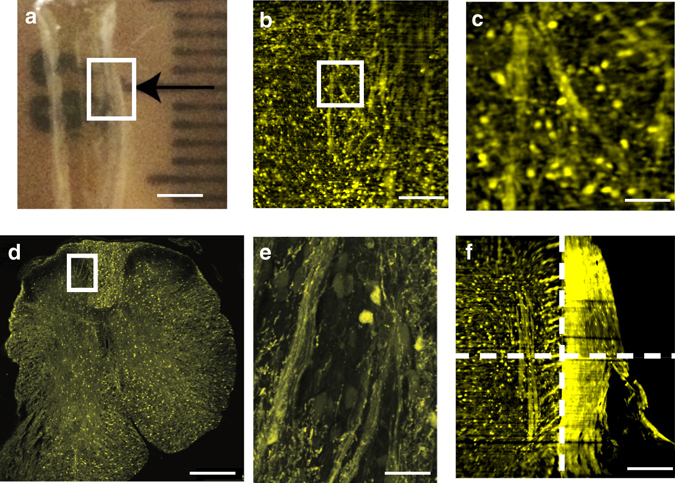
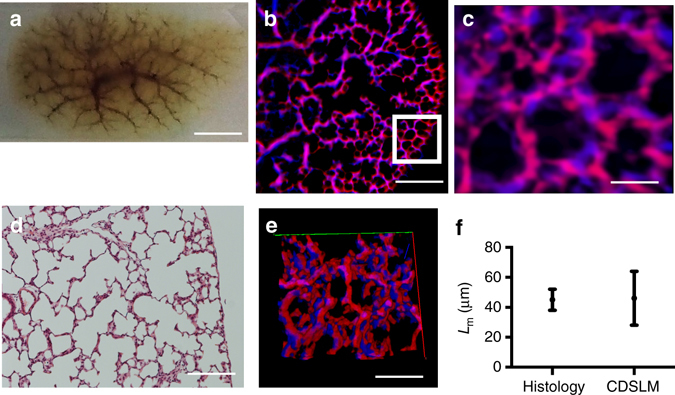
Optical tissue clearing has revolutionized researchers' ability to perform fluorescent measurements of molecules, cells, and structures within intact tissue. One common complication to all optically cleared tissue is a spatially heterogeneous refractive index, leading to light scattering and first-order defocus. We designed C-DSLM (cleared tissue digital scanned light-sheet microscopy) as a low-cost method intended to automatically generate in-focus images of cleared tissue. We demonstrate the flexibility and power of C-DSLM by quantifying fluorescent features in tissue from multiple animal models using refractive index matched and mismatched microscope objectives. This includes a unique measurement of myelin tracks within intact tissue using an endogenous fluorescent reporter where typical clearing approaches render such structures difficult to image. For all measurements, we provide independent verification using standard serial tissue sectioning and quantification methods. Paired with advancements in volumetric image processing, C-DSLM provides a robust methodology to quantify sub-micron features within large tissue sections.Optical clearing of tissue has enabled optical imaging deeper into tissue due to significantly reduced light scattering. Here, Ryan et al. tackle first-order defocus, an artefact of a non-uniform refractive index, extending light-sheet microscopy to partially cleared samples.


Conflict of interest statement

The University of Colorado has filed a patent for parts of this work. D.P.R. and D.P.S. are the co-inventors and the patent is assigned to D.P.R. and the University of Colorado. The remaining authors declare no competing finanical interests.

Figures

Fig. 1
Fig. 1
First-order defocus in light-sheet fluorescence microscopy (LSFM). Standard LSFM without compensation begins with co-planar light-sheet and detection planes. At the surface, there is minimal first-order defocus (a). The sample is then physically translated to generate volumetric images (b and c). As the path length increases, first-order defocus causes the excitation or detection focal planes to move closer to the optical element by approximately n × Δz (* in b and c), where n is the local refractive index (RI) and Δz is the excitation or detection pathway optical path length. This displacement will vary based on the spatial location within optically cleared tissue and the RI mismatch. While newly available RI matched objectives minimize this RI mismatch, these objectives have narrow depth-of-fields due to high-numerical apertures. Therefore, these objectives are more susceptible to first-order defocus. Previous compensation methods for stage translation LSFM with or without RI corrected optics have included large depth-of-field detection, physical translation of the excitation and detection objective, , or extended depth-of-field imaging , . Cleared tissue digital scanned light microscopy (C-DSLM) compensates for first-order defocus created by such RI heterogeneity through independent positioning of the excitation focus, detection focus, and lateral position of the light-sheet using computational algorithms and electro-tunable lenses. C-DSLM holds the sample stationary while determining the optimal combination of these three degrees of freedom to optimize over an entire image stack (d-f). The axial position of the light-sheet, determined by the galvanometer mirror position, provides a constant reference across different imaging conditions, as only those fluorophores within the light-sheet are excited
Fig. 2
Fig. 2
Quantification of signal-to-noise enhancement from cleared tissue. Cleared tissue digital scanned light microscopy (C-DSLM) was implemented with a ×4, NA 0.2 detection objective. The light-sheet full-width at half-maximum (FWHM) was adjusted to ∼16 μm to yield an approximate Rayleigh length of 1600 μm before Gaussian beam scanning. Each axial step was ∼3 μm. ad C-DSLM a, c and standard light-sheet fluorescence microscopy (LSFM) b, d imaging of individual focal planes 1 mm (top-a, b) and 6 mm c, d into the stack. C-DSLM clearly delineated individual oligodendrocyte cells and myelin tracks that were either out-of-focus or blurred due to first-order defocus in standard LSFM (scale bars—500 μm). e Quantification of Shannon Entropy of the Discrete Cosine Transform (SE-DCT) for C-DSLM and standard LSFM as well as mean squared error (MSE) comparison between C-DSLM and standard LSFM throughout the entire image stack. f Quantification of first-order defocus in standard LSFM as a function of axial imaging depth. The sample was imaged at 0°, 90°, 180°, 270°, and 360° fixed rotations. Representative of n = 10 experiments. All imaging was done within the cortex or olfactory bulb of passive CLARITY (PACT) cleared proteolipid-promoter eGFP (PLP-eGFP) mouse tissue
Fig. 3
Fig. 3
First-order defocus correction. Images were acquired using ac ×4, NA 0.2, refractive index (RI) = 1.0; df ×10, NA 0.28, RI = 1.0; gi ×20, NA 1.0, RI = 1.38; and jl ×20, NA 1.0, RI = 1.45 detection objectives. All images were obtained from the same passive CLARITY (PACT) cleared proteolipid-promoter eGFP (PLP-eGFP) olfactory bulb region. The light-sheet full-width at half-maximum (FWHM) and excitation electro-tunable lens (ETL-1) limits for Gaussian beam scanning were adjusted to yield the best signal-to-noise for individual objectives. Cleared tissue digital scanned light-sheet microscopy (C-DSLM) clearly delineated individual oligodendrocyte cells and myelin tracks that were either out-of-focus or blurred due to first-order defocus in standard light-sheet fluorescence microscopy (LSFM) for all objectives. Because of differences in RI environment and depth-of-field for individual objectives, the magnitude of the first-order defocus differs in each case. (all scale bars—250 μm)
Fig. 4
Fig. 4
Cleared tissue digital scanned light-sheet microscopy (C-DSLM) imaging of proteolipid-promoter eGFP (PLP-eGFP) mouse brain. a PLP-eGFP mouse brain sections were passive CLARITY (PACT) cleared and refractive index (RI) homogenized with intentional under-clearing to retain myelinated structures (scale bar—1 mm). b Individual image plane within PLP-eGFP mouse cortex cord from a 1.3 mm × 1.3 mm × 5 mm axial image (scale bar—250 μm) acquired using the ×10,NA 0.28 detection objective. The light-sheet full-width at half-maximum (FWHM) was adjusted to ∼10 μm to yield an approximate Rayleigh length of 700 μm before Gaussian beam scanning. Each axial step was ∼1 μm. Supplementary Movie 1 shows a volumetric rendering of this region. c Expanded image of highlighted area (white box) in b. Individual cells, dendrites, and pencil fibers are clearly visible (scale bar—50 μm) d Tiled confocal image of individual 30 μm serial section of PLP-eGFP mouse cortex imaged using confocal microscopy (×20, NA 0.95 water-immersion objective) (scale bar—250 μm). e Expanded image of highlighted area (white box) in d. Individual cell bodies, dendrites, and pencil fibers are clearly visible (scale bar—50 μm). f Verification of C-DSLM PLP-eGFP+ cell counting. Serial sectioning of uncleared PLP-eGFP cortex tissue measured by confocal microscopy (n = 4 animals, 100 individual image planes per animal) versus cleared and intact PLP-eGFP cortex tissue measured by C-DSLM (n = 2, 6000 individual images planes per animal)
Fig. 5
Fig. 5
Cleared tissue digital scanned light-sheet microscopy (C-DSLM) imaging of proteolipid-promoter eGFP (PLP-eGFP) mouse spinal cord. a PLP-eGFP mouse spinal cords were passive CLARITY (PACT) cleared in the same manner as PLP-eGFP brain sections. Each black tick of the ruler is 1 mm. Area tiled using C-DSLM is shown by the white box. (scale bar—2.5 mm) b Individual image plane within PLP-eGFP mouse spinal cord from a 1.3 mm × 1.3 mm × 6 mm axial image (scale bar—250 μm) acquired using ×10, NA 0.28 detection objective. The light-sheet full-width at half-maximum (FWHM) was adjusted to ∼10 μm to yield an approximate Rayleigh length of 700 μm before Gaussian beam scanning. Each axial step was ∼1 μm. c Expanded image of highlighted area (white box) in b showing individual cells and myelin fibers (scale bar—50 μm). Supplementary Movie 2 shows a volumetric rendering of this region. d Tiled confocal image of 30 μm axial serial section of uncleared PLP-eGFP spinal cord (×20, NA 0.95 water-immersion objective) (scale bar—250 μm). e Expanded view of highlighted area (white box) in d showing individual cells and myelin fibers (scale bar—50 μm). f To investigate large-scale network connectedness we tiled images over a 4 mm × 3 mm in-plane region, 5 mm out-out-plane region, with individual images (1.3 mm × 1.3 mm in-plane, 5 mm out-of-plane) overlapping images by 25% in each area. Dashed lines delineate independent volumes used for final tiled image (scale bar—100 μm). Supplementary Fig. 2 shows network identification in this tiled volume. Supplementary Movie 3 shows volumetric rendering of the tiled image in f, well matching the confocal image presented in d. Supplementary Movie 4 shows a plane-by-plane rendering of the image in c. These images and analyses are representative of five experiments for spinal cords isolated from different animals
Fig. 6
Fig. 6
Cleared tissue digital scanned light-sheet microscopy (C-DSLM) imaging of rat lungs. a Rat lungs (day 14) were collected, inflated, fixed, cleared using passive CLARITY (PACT) (scale bar—5 mm). b Individual image plane of epithelium (blue) and endothelium (red) within rat lung from a 1.3 mm × 1.3 mm × 6 mm axial image (scale bar—250 μm) acquired using the ×10, NA 0.28 detection objective. (scale bar—250 μm) The light-sheet full-width at half-maximum (FWHM) was adjusted to ∼10 μm to yield an approximate Rayleigh length of 700 μm before Gaussian beam scanning. Each axial step was ∼1 μm. c Expanded image of highlighted area (white box) in b showing distal lung structure. Alveolar structures were clearly marked by both airway (blue), blood vessels (red), and overlap between the two networks (magenta) (scale bar—50 μm). d 2D histology of distal lung imaged using white light and a ×20 air immersion objective (scale bar—200 μm). e 3D reconstruction of c. The true complexity of the distal lung was lost in traditional histology but can be clearly seen using tissue clearing and light-sheet imaging. Supplementary Movie 5 shows a volumetric rendering of this region. f Verification of C-DSLM distal lung results using Mean Linear Intercept (MLI) to determine the chord length (L m). We created a new 3D MLI algorithm that imposes a three-dimensional grid (vs the traditional lines for planar MLI) and calculates nearest-neighbor intersections across the volume measurement. Serial sectioning and histological staining measured by wide-field microscopy (n = 23 individual histology slices) versus cleared and intact lung lobe measured by C-DSLM (n = 5 entire lungs, 5000 individual image planes). Error bars are standard deviation (SD). Mean L m values for histology and C-DSLM L m did not significantly differ. The larger C-DSLM SD was due to both our inclusion of 3D information and proximal lung blood vessels, leading to a larger spread in calculated L m

References

    1. Treweek JB, et al. Whole-body tissue stabilization and selective extractions via tissue-hydrogel hybrids for high-resolution intact circuit mapping and phenotyping. Nat. Protoc. 2015;10:1860–1896. doi: 10.1038/nprot.2015.122. - DOI - PMC - PubMed
    1. Tainaka K, Kuno A, Kubota SI, Murakami T, Ueda HR. Chemical principles in tissue clearing and staining protocols for whole-body cell profiling. Annu. Rev. Cell Dev. Biol. 2016;32:713–741. doi: 10.1146/annurev-cellbio-111315-125001. - DOI - PubMed
    1. Ariel P. A beginner’s guide to tissue clearing. Int. J. Biochem. Cell Biol. 2017;84:35–39. doi: 10.1016/j.biocel.2016.12.009. - DOI - PMC - PubMed
    1. Siedentopf H, Zsigmondy R. Uber sichtbarmachung und größenbestimmung ultramikoskopischer teilchen, mit besonderer anwendung auf goldrubingläser. Ann. Phys. 1902;315:1–39. doi: 10.1002/andp.19023150102. - DOI
    1. Stelzer EHK. Light-sheet fluorescence microscopy for quantitative biology. Nat. Methods. 2015;12:23–26. doi: 10.1038/nmeth.3219. - DOI - PubMed

Publication types