. 2017 Sep 20;8(1):620.
doi: 10.1038/s41467-017-00658-6.

TGFβR signalling controls CD103+CD11b+ dendritic cell development in the intestine

Affiliations

TGFβR signalling controls CD103+CD11b+ dendritic cell development in the intestine

C C Bain et al. Nat Commun. .

Abstract

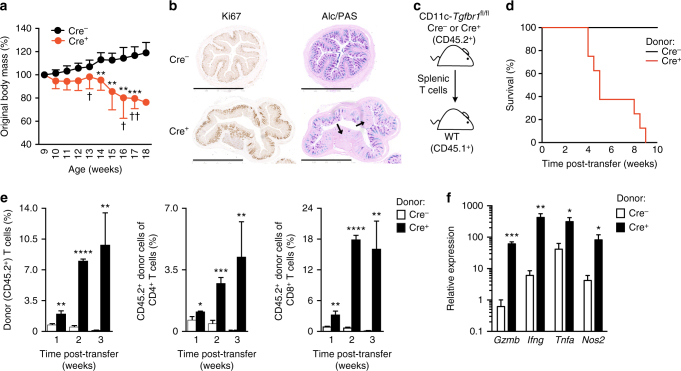
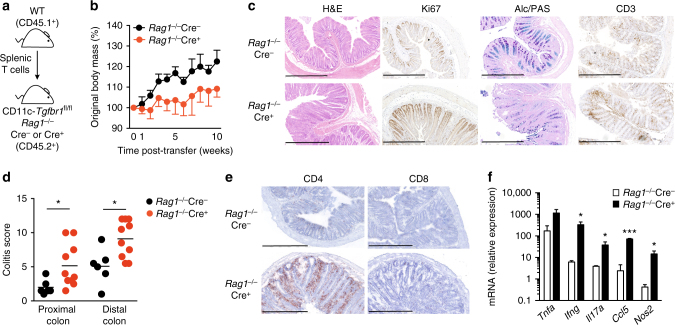
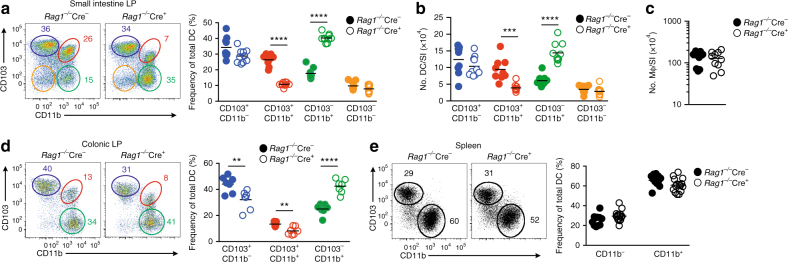
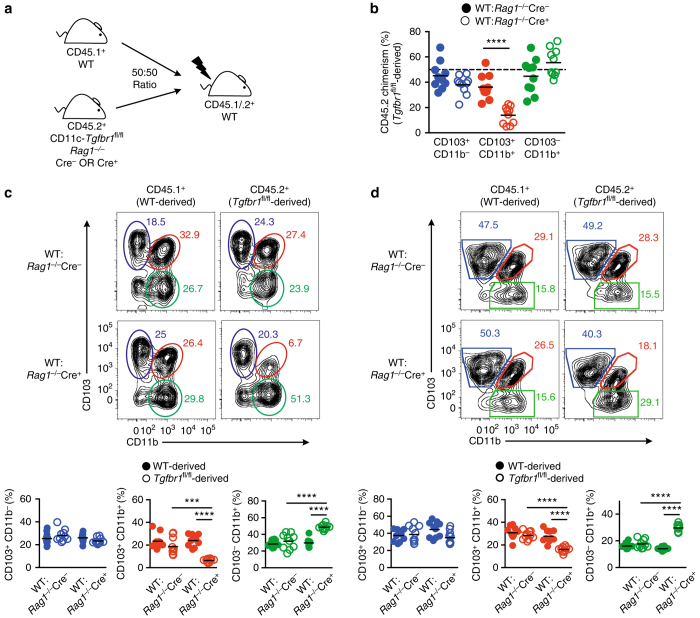
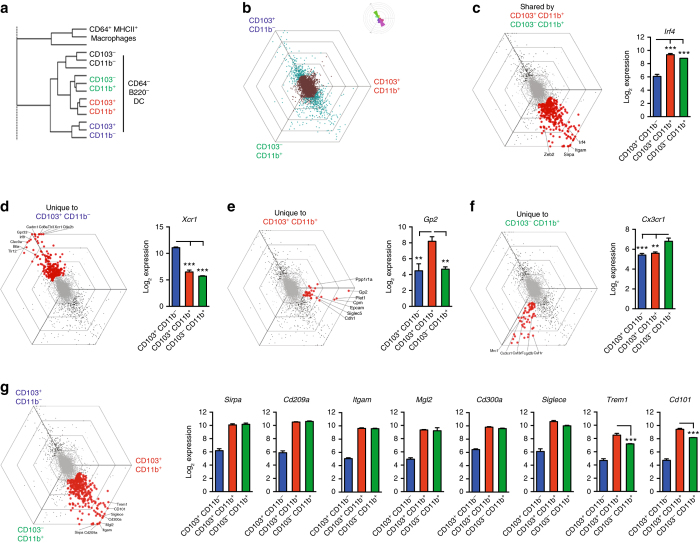
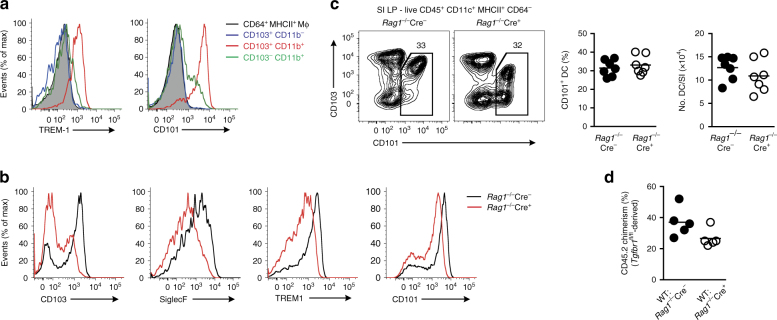
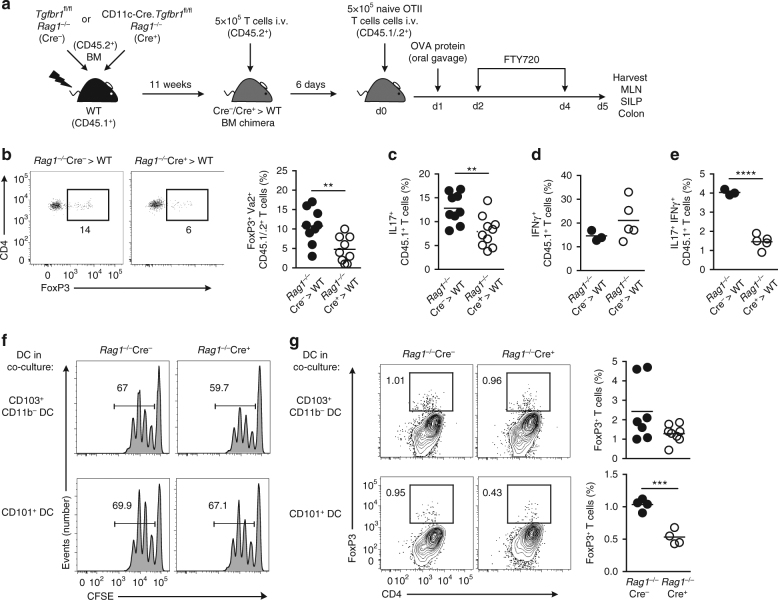
CD103+CD11b+ dendritic cells (DCs) are unique to the intestine, but the factors governing their differentiation are unclear. Here we show that transforming growth factor receptor 1 (TGFβR1) has an indispensable, cell intrinsic role in the development of these cells. Deletion of Tgfbr1 results in markedly fewer intestinal CD103+CD11b+ DCs and a reciprocal increase in the CD103-CD11b+ dendritic cell subset. Transcriptional profiling identifies markers that define the CD103+CD11b+ DC lineage, including CD101, TREM1 and Siglec-F, and shows that the absence of CD103+CD11b+ DCs in CD11c-Cre.Tgfbr1 fl/fl mice reflects defective differentiation from CD103-CD11b+ intermediaries, rather than an isolated loss of CD103 expression. The defect in CD103+CD11b+ DCs is accompanied by reduced generation of antigen-specific, inducible FoxP3+ regulatory T cells in vitro and in vivo, and by reduced numbers of endogenous Th17 cells in the intestinal mucosa. Thus, TGFβR1-mediated signalling may explain the tissue-specific development of these unique DCs.Developmental cues for the different dendritic cell (DC) subsets in the intestine are yet to be defined. Here the authors show that TGFβR1 signalling is needed for development of CD103+CD11b+ intestinal DCs from CD103-CD11b+ cells and that they contribute to the generation of Th17 and regulatory T cells.


Conflict of interest statement

The authors declare no competing financial interests.

Figures

Fig. 1
Fig. 1
T-cell-dependent inflammatory disease in CD11c-Cre.Tgfbr1 fl/fl mice. a Body weights of CD11c-Cre.Tgfbr1 fl/fl (Cre+) mice and Tgfbr1 fl/fl (Cre) mice littermate controls presented as a percentage of original bodyweight at 9 weeks of age. The results are the means ± 1 SD of five (Cre+) or six (Cre) mice per group and are representative of two experiments (**p < 0.01 and ***p < 0.001—Student’s t-test followed by Holm–Sidak correction). († indicates the loss of animal from group). b Representative colonic pathology as assessed by epithelial cell turnover (Ki67 staining—left panels) and goblet cell density (PAS staining—right panels) in Cre (upper panels) and Cre+ mice (lower panels). Arrows indicate loss of goblet cells. Scale bar, 1 mm. c Experimental scheme for the transfer of splenic T cells from Cre or Cre+ mice into congenic WT recipients. d Survival of WT recipients given T cells from Cre ro Cre+ mice. Data are pooled from two experiments with a total of seven (Cre) or eight (Cre+) mice per group. e Frequency of CD45.2+ donor T cells among total blood T cells (left) and the frequency of donor cells within the CD4+ and CD8+ T-cell compartments (centre and right) at 1, 2 and 3 weeks post transfer in the mice from c, d above. Data are from one of two independent experiments each with 3 (Cre+) or 4 (Cre) mice per group. f Expression of mRNA transcripts for Gzmb, Ifng, Tnfa and Nos2 in the stomach of recipients of splenic T cells from Cre or Cre+ mice in d above. In e, f, bars represent the mean + SD of three mice per group and mRNA expression is relative to expression of Gapdh. *p < 0.05, **p < 0.01, ***p < 0.001 and ****p < 0.0005 determined by two-tailed Student’s t-test
Fig. 2
Fig. 2
TGFβR1 signalling in CD11c+ myeloid cells prevents T-cell-mediated colitis. a Experimental scheme for induction of colitis by transfer of CD45.1+ WT spleen T cells mice into Rag1 / Tgfbr1 fl/fl (Rag1 /Cre) or Rag1 / CD11c-Cre.Tgfbr1 fl/fl (Rag1 /Cre+) recipients. b Body weights following adoptive transfer of WT T cells shown as percentage of starting weight. The results are the means ± 1 SD of four mice per group from one of two independent experiments. c Representative colonic pathology as assessed by haematoxylin and eosin staining, Ki67 staining of dividing epithelial cells, PAS+ goblet cells and CD3+ T cells at 10–17 weeks post-transfer. Scale bar, 500 μm. d Histological scoring of proximal and distal colon. Data are pooled from four independent experiments with a total of six (Rag1 /Cre) or nine (Rag1 /Cre+) recipients per group. *p < 0.05 determined by Mann–Whitney test. e CD4 and CD8 expression in colon at 10–17 weeks post transfer. Scale bar, 500 μm. f Expression of mRNA transcripts for Tnfa, Ifng, Il17a, Ccl5 and Nos2 in the colon. Error bars represent the mean + 1 SD of two (Rag1 /Cre) or five (Rag1 /Cre+) mice per group and mRNA expression is relative to expression of Abl. Data are from one of three independent experiments performed. *p < 0.05 and ***p < 0.001 determined by two-tailed Student’s t-test
Fig. 3
Fig. 3
TGFβR1 signalling controls dendritic cell homeostasis in the intestine. a Expression of CD103 and CD11b by live CD45+CD11c+MHCII+CD64 DC (left) and relative frequencies of DC subsets (right) in the SILP of Rag1 / Tgfbr1 fl/fl mice (Rag1 /Cre) or Rag1 / CD11c-Cre.Tgfbr1 fl/fl (Rag1 /Cre+) mice. b Absolute numbers of DC subsets and c CD64+Ly6C macrophages from SI from mice in a. Data are pooled from three independent experiments with 9 (Rag1 /Cre) or 10 (Rag1 /Cre+) mice per group. d Expression of CD103 and CD11b by live CD45+CD11c+MHCII+CD64 DC (left) and relative frequencies of DC subsets (right) in the colonic LP of Rag1 /Cre or Rag1 /Cre+ mice. Data are pooled from two independent experiments with a total of seven mice per group. e Expression of CD103 and CD11b by live CD11c+MHCII+ DC (left) and relative frequencies of DC subsets (right) in the spleen of Rag1 /Cre or Rag1 /Cre+ mice. Data are pooled from four independent experiments with 11 (Rag1 /Cre) or 15 (Rag1 /Cre+) mice/group. *p < 0.05, **p < 0.01, ***p < 0.001 and ****p < 0.0001 determined by Student’s t-test followed by Holm–Sidak correction
Fig. 4
Fig. 4
TGFβR1-mediated control of DC homeostasis is cell intrinsic. a Experimental scheme for generation of mixed BM chimeric mice by reconstitution of irradiated CD45.1+ × CD45.2+ mice with a 1 : 1 mixture of BM from CD45.1+ WT and Rag1 /Cre or Rag1 /Cre+ CD45.2+ donors. b CD45.2+ Tgfbr1 fl/fl-derived chimerism among DC subsets from WT:Rag1 /Cre or WT: Rag1 /Cre+ mixed BM chimeras 8–12 weeks post reconstitution. Data are pooled from two independent experiments with a total of 10 mice per group and dotted line represents input chimerism. ****p < 0.0001 determined by Student’s t-test followed by Holm–Sidak correction. c, d Representative expression of CD103 and CD11b by CD45.1+ (WT-derived) or CD45.2+ (Tgfbr1 fl/fl-derived) CD11c+MHCII+CD64 cells from the SILP c or MLN d of WT:Rag1 /Cre or WT:Rag1 /Cre+ mixed BM chimeras 8–12 weeks post reconstitution. Scatter plots show the frequency of each DC subset of the total DC pool derived from each BM source. Data are pooled from two independent experiments with 10 mice per group. Each symbol represents an individual animal and the horizontal bar represents the mean. ***p < 0.001 and ****p < 0.0001 using one-way ANOVA followed by Bonferroni’s multiple comparisons test
Fig. 5
Fig. 5
Transcriptional profiling of SILP DC reveals subset-specific markers. a Hierarchical clustering of DC subsets and CD64+MHCII+ macrophages from the SILP of WT mice based on microarray profiles. b Hexagonal ‘Triwise’ plot displaying all arrayed genes with differentially expressed genes (adj. p-value < 0.01, logFC > 1 or < 1) depicted in cyan and non-differentially expressed genes shown in brown. Each grid line represents a log2 fold change. Rose plots show the percentage of genes falling in each vectorial direction. c Triwise plot highlighting genes differentially expressed (adj. p-value < 0.01, logFC > 1 or < 1) by CD103+CD11b+ DC and CD103CD11b+ DC and not CD103+CD11b DC (left) and bar chart of Irf4 expression by DC subsets (right). Bars represent the mean + SEM Log2 expression values of three biological replicates. df Triwise plots highlighting genes differentially expressed (adj. p-value 0.01, LogFC > 1 or < 1) by CD103+CD11b DC d, CD103+CD11b+ DC e and CD103CD11b+ DC f (left panels) and mean + SEM Log2 expression values of Xcr1, Gp2 and Cx3cr1 by DC subsets (right panels). g Triwise plots depicting the genes that are most differentially expressed by CD103+CD11b+ and CD103CD11b+ DC subsets compared with CD103+CD11b DC (left); mean + SEM Log2 expression values of these genes (right)
Fig. 6
Fig. 6
CD101 and TREM1 are surrogate markers for intestinal CD103+ CD11b+ DC. a Representative expression of TREM1 and CD101 by DC subsets and CD64+MHCII+ macrophages from SILP of Rag1 /Cre mice. b Representative expression of CD103, SiglecF, TREM1 and CD101 by total CD11b+ DC from the SILP of Rag1 /Cre or Rag1 /Cre+ mice. c Representative expression of CD103 and CD101 by total CD11c+MHCII+CD64 DC (left) and the frequency and absolute numbers of CD101+ DC in the SILP of Rag1 /Cre or Rag1 /Cre+ mice. Data are pooled from two independent experiments with seven mice per group. d Proportion of CD45.2+ Tgfbr1 fl/fl-derived cells among CD101+ DC from WT:Rag1 /Cre or WT: Rag1 /Cre+ mixed BM chimeras 8–12 weeks post reconstitution. Data are from one of two independent experiments with five mice per group
Fig. 7
Fig. 7
TGFβR1 signalling is required for induction of regulatory T cells by DC in vivo and in vitro. a Experimental scheme for induction of Tregs in vivo. b Representative expression of FoxP3+ by adoptively transferred OTII T cells (Vα2+CD45.1+CD45.2+) from MLN of Rag1 /Cre → WT or Rag1 /Cre+ → WT BM chimeric mice 4 days after oral administration of 50 mg OVA (left panels). Scatterplot shows the frequency of FoxP3+ T cells among all Vα2+CD45.1+CD45.2+ T cells (right panel). Each symbol represents an individual animal and the horizontal bar represents the mean. Data are pooled from two independent experiments with nine mice per group. ce Frequency of IL17A+ c, IFNγ+ d and IL17A+IFNγ+ e T cells among CD45.1+ (residual host) T cells from the SILP of Rag1 /Cre → WT or Rag1 /Cre+ → WT BM chimeric mice. Data are pooled from two independent experiments with nine mice per group c or from one experiment with three (Rag1 /Cre → WT) or 5 (Rag1 /Cre+ → WT) mice per group d, e. **p < 0.01 and ****p < 0.0001 determined by Student’s t-test. CFSE profile f and expression of FoxP3 g of CD4+ OTII T cells after 3.5 days of co-culture with FACS-purified CD103+CD11b DC or CD101+ DC from SILP of Rag1 /Cre or Rag1 /Cre+ mice in the presence of 0.5 μg ml−1 OVA 323–339 peptide. Data are pooled from at least four individual experiments, with each symbol representing a biological replicate and the horizontal bar representing the mean. ***p < 0.001 determined by Student’s t-test

Similar articles

Cited by

References

    1. Mowat AM. Anatomical basis of tolerance and immunity to intestinal antigens. Nat. Rev. 2003;3:331–341. - PubMed
    1. Worbs T, et al. Oral tolerance originates in the intestinal immune system and relies on antigen carriage by dendritic cells. J. Exp. Med. 2006;203:519–527. doi: 10.1084/jem.20052016. - DOI - PMC - PubMed
    1. Houston SA, et al. The lymph nodes draining the small intestine and colon are anatomically separate and immunologically distinct. Mucosal Immunol. 2016;9:468–478. doi: 10.1038/mi.2015.77. - DOI - PubMed
    1. Veenbergen S, et al. Colonic tolerance develops in the iliac lymph nodes and can be established independent of CD103(+) dendritic cells. Mucosal Immunol. 2016;9:894–906. doi: 10.1038/mi.2015.118. - DOI - PMC - PubMed
    1. Cerovic V, Bain CC, Mowat AM, Milling SWF. Intestinal macrophages and dendritic cells: what’s the difference? Trends Immunol. 2014;35:270–277. doi: 10.1016/j.it.2014.04.003. - DOI - PubMed

Publication types

MeSH terms

Substances