. 2017 Sep 20;8(1):619.
doi: 10.1038/s41467-017-00578-5.

The non-canonical poly(A) polymerase FAM46C acts as an onco-suppressor in multiple myeloma

Affiliations

The non-canonical poly(A) polymerase FAM46C acts as an onco-suppressor in multiple myeloma

Seweryn Mroczek et al. Nat Commun. .

Abstract

FAM46C is one of the most frequently mutated genes in multiple myeloma. Here, using a combination of in vitro and in vivo approaches, we demonstrate that FAM46C encodes an active non-canonical poly(A) polymerase which enhances mRNA stability and gene expression. Reintroduction of active FAM46C into multiple myeloma cell lines, but not its catalytically-inactive mutant, leads to broad polyadenylation and stabilization of mRNAs strongly enriched with those encoding endoplasmic reticulum-targeted proteins and induces cell death. Moreover, silencing of FAM46C in multiple myeloma cells expressing WT protein enhance cell proliferation. Finally, using a FAM46C-FLAG knock-in mouse strain, we show that the FAM46C protein is strongly induced during activation of primary splenocytes and that B lymphocytes isolated from newly generated FAM46C KO mice proliferate faster than those isolated from their WT littermates. Concluding, our data clearly indicate that FAM46C works as an onco-suppressor, with the specificity for B-lymphocyte lineage from which multiple myeloma originates. FAM46C is one of the most frequently mutated genes in multiple myeloma (MM), but its molecular function remains unknown. Here the authors show that FAM46C is a poly(A) polymerase and that loss of function of FAM46C drives multiple myeloma through the destabilisation of ER response transcripts.


Conflict of interest statement

The authors declare no competing financial interests.

Figures

Fig. 1
Fig. 1
FAM46C interacts with RNA and is an active RNA poly(A) polymerase in vitro and in vivo. a Recombinant FAM46CWT (lanes 8–13), but not its catalytic mutant FAM46Cmut (lanes 2–7), displays poly(A) polymerase activity in vitro. Reaction products (using 32P-labeled (A)15 as substrate) were separated in denaturing PAGE gels and visualized by autoradiography. b SDS-PAGE analysis of recombinant FAM46CWT and its catalytic mutant FAM46Cmut. c FAM46DWT is an active poly(A) polymerase in vitro and requires Mn2+ ions for its activity. Purified protein was incubated with 32P-labeled (A)15 primer in the presence of ATP and divalent cations as follows: Mg2+ (lanes 4–6), both Mg2+/Mn2+ (lanes 7–9), or Mn2+ (lanes 10–12). Control reactions were carried out without the protein (lanes 1–3). d FAM46C interacts with RNA in human cells. Autoradiography of UV cross-linked 32P-labeled RNAs co-purified with FAM46CWTGFP from HEK293 cells stably expressing the fusion protein (lanes 3–4) and from control empty cells (lanes 1–2). Immunoprecipitated RNA-protein complexes were separated by SDS-PAGE, transferred to nitrocellulose membrane, stained with Ponceau S, and subsequently autoradiographed. The right panel shows the Ponceau S stained blot merged with autoradiogram
Fig. 2
Fig. 2
FAM46C shows both nuclear and cytoplasmic localization. HEK293T, RPMI826 (MM), H929 (MM), SKMM1 (MM), HL60 (promyelocytic leukemia) and Raji (B-cell lymphoma) cell lines were transduced with constructs encoding the FAM46C WT–GFP fusion gene. Non-transduced cells were used as a control. Fluorescence images for GFP and Hoechst nucleic acid stain, as well as merged images, are shown. Scales bars (10 µm) are shown for each set of images
Fig. 3
Fig. 3
FAM46C tethering leads to polyadenylation and enhanced expression of a Renilla luciferase (RL) reporter. Analysis at the protein level (ad): a FAM46C tethering increases RL reporter protein levels. HEK293 cells were co-transfected with a construct expressing RL, containing five boxB sites in its 3′-UTR, Firefly luciferase (FL) control reporter and FAM46CWT harboring the N-terminal λN boxB-binding domain and HA-tag. Western blot detection of RL in mock-transfected cells (lane 1) and after NHA-FAM46CWT (lane 2) or NHA-FAM46Cmut (lane 3) tethering. Expression of NHA-tagged FAM46C proteins were confirmed using an α-HA antibody. DBC1 served as a loading control. Asterisks indicate cross-hybridization signals. b Expression of RL5boxHSL + HhR reporter with a cyclic phosphate at the 3′ end generated by a hammerhead ribozyme was not enhanced upon FAM46C tethering. The experiment was performed as in a. c Expression of the FAM46C without λN domains did not enhance expression of the reporter. The experiment was performed as in a. d Quantifications of RL protein normalized by the internal FL reporter related to experiments from ac. RNA analysis (ei): e northern blot detection of RL mRNA using total RNA from HEK293 cells after tethering of NHA-FAM46CWT or NHA-FAM46Cmut to RL5box (lanes 1–3) or RL5boxHSL + HhR with a cyclic phosphate at the 3′ end (lanes 4–6). f Quantifications of RL mRNA. g RT-qPCR analysis of the FL control reporter. h Northern blot detection of Renilla luciferase using poly(A) + fraction from HEK293 cells after tethering of NHA-FAM46CWT or NHA-FAM46Cmut (i) Poly(A) tails added to reporter mRNA can be removed by RNase H treatment in the presence of oligo(dT)25. High-resolution northern blot analysis of RL mRNA from control HEK293 cells (lanes 1–2), after tethering of NHA-FAM46CWT (lanes 3–4) or NHA-FAM46Cmut (lanes 5–6). The data in d, f, g are shown as a mean value ± SD (n = 3)
Fig. 4
Fig. 4
FAM46C control survival and proliferation of multiple myeloma cells. ac Expression of FAM46C WT induces death in multiple myeloma cells. a An example gating strategy for defining transduction efficiency and cell viability. Forward scatter (FSC) and side scatter (SSC) gate were used to separate debris from intact cells. Viability of RPMI8226 cells overexpressing either FAM46CWT-GFP or FAM46Cmut-GFP was analyzed using propidium iodide (PI) staining on the 11th day post-transduction. GFP expression (GFP+) was evaluated in parallel in PI-negative cells. b, c Summary of flow cytometry analyses presented as bar graphs showing GFP expression level and reduced viability of multiple myeloma cell lines (SKMM1, H929, and RPMI8226 in b and Raji and HL60 in c throughout the time course of GFP, FAM46CWT-GFP, and FAM46Cmut-GFP expression. The data are presented as percentage of cells ± SD (n = 3). P values were calculated using two-way ANOVA tests (*P < 0.05, **P < 0.01, ***P < 0.001, ****P < 0.0001). d, e shRNA-mediated silencing of FAM46C enhances proliferation rate of RPMI8226 MM cell line expressing wild-type protein but not SKMM1 harboring FAM46C mutation. Cells were transduced with lentiviral vectors expressing shRNA and empty vector as control. Stable transduced cell lines were stained with CFSE. Cell division was monitored by flow cytometry after 48 and 72 h by levels of CFSE dilution. d Reverse transcription qPCR analysis of the FAM46C silencing efficiency. Bars represent mean values ± SD (n = 3). e The rate of proliferation of shRNA treated cells normalized to the control transduction. Bars represent mean values ± SD. P-values were calculated using Student’s t-test (*P < 0.05), (n = 3)
Fig. 5
Fig. 5
FAM46C is induced in activated B lymphocytes and localizes mainly in the cytosol. a Splenocytes from FAM46C -FLAG +/+ knock-in mice and control animals were isolated and then cultured in presence of IL4 and LPS for 72 h. The level of FAM46C-FLAG was checked by western blot in non-activated (lanes 1–2) and activated (lanes 2–4) cells. GRP94 was used as activation marker, while DBC1 was used as a loading control. b Endogenous FAM46C localizes mainly in the cytosol. Splenocytes from WT and FAM46C -FLAG+/+ mice were isolated and fractionated. The whole-cell (T), cytoplasmic (CE), and nuclear (NE) extracts were analyzed by western blot. FAM46C-FLAG was detected using an anti-FLAG antibody. GAPDH and GRP94 were used as a cytosolic markers, while histone H4 and PSPC1 were used as nuclear markers. Arrow indicates the position of FAM46C-FLAG, while asterisks indicts nonspecific bands detected by antibodies, which were present in samples isolated from both WT and FAM46C-FLAG animals
Fig. 6
Fig. 6
FAM46C KO 12-week-old mice display reduced blood hemoglobin levels and activated primary B lymphocytes proliferate faster. ah Hematologic parameters of FAM46C KO and control animals: a Blood hemoglobin concentration (WT, n = 8; FAM46C KO, n = 6); b red blood cells count (RBC) (WT, n = 7; FAM46C KO, n = 7); c mean corpuscular volume (MCV) (WT, n = 10; FAM46C KO, n = 10); d mean corpuscular hemoglobin (MCH) (WT, n = 10; FAM46C KO, n = 10); e mean corpuscular hemoglobin concentration (MCHC) (WT, n = 10; FAM46C KO, n = 10); f blood platelets (WT, n = 9; FAM46C KO, n = 9); g Hematocrit (WT, n = 8; FAM46C KO, n = 8); h bone marrow (BM) plasmocytes (WT, n = 12; FAM46C KO, n = 12). P-values were calculated using two-way ANOVA tests (**P < 0.01, ****P < 0.0001). i Analysis of the proliferation rate of activated primary B cells. B lymphocytes isolated from FAM46C KO mice and matching WT controls were stained with CFSE and in vitro activated using IL4 and LPS. Cell divisions were monitored by levels of CFSE dilution. One representative experiment of 2 is presented. For each experiment splenic B lymphocytes from three individuals have been pulled, for both WT and mutant mice
Fig. 7
Fig. 7
Global analysis of FAM46C substrates in MM cells. a, b MAplots of total RNA sequencing results representing differential expression analysis of FAM46CWT-GFP and FAM46Cmut-GFP-transduced MM cell lines. SKMM1 (a) and H929 (b) show transcriptome wide moderate deregulation of gene expression. Statistically significant values (FDR < 1%) are shown in red. The 396 transcripts constituting the common part for SKMM1 and H929 MM cell lines are marked with green circles. c Venn diagram demonstrating the overlap between upregulated transcripts in SKMM1 and H929 MM cell lines. d Functional GO terms annotation clustering of significantly upregulated transcripts in both MM cell lines. e, f Histogram representing the distribution of FAM46C-dependent polyadenylation rations monitored in fraction #5 (e) and #6 (f) in SKMM1 cell lines. Modeled normal distribution is fitted as a red line to emphasize the outlying population of FAM46C polyadenylated transcripts. g Venn diagram demonstrating the overlap between transcripts shifting to both long poly(A) fractions in FAM46WT overexpressing cells mutually in SKMM1 and H929 MM cell lines. h 396 transcripts constituting the common part for SKMM1 and H929 MM cell lines were used in DAVID Functional Annotation Clustering Analysis. i The same set of transcripts was used to characterize the 3′-UTRs and total mRNA lengths showing a bias towards shorter species in either
Fig. 8
Fig. 8
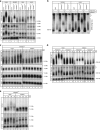
FAM46C expression results in polyadenylation of selected mRNAs in MM cells. a Northern blot analysis of SSR4, CD320, and FTL transcripts from H929 (lanes 1–3), SKMM1 (lanes 4–6), Raji (lanes 7–9) and HL60 (lanes 10–12) cells transduced with GFP (lanes 1, 4, 7, 10), FAM46CWT-GFP (lanes 2, 5, 8, 11), and FAM46Cmut-GFP (lanes 3, 6, 9, 12). Asterisks indicate cross-hybridization signals. b The SSR4 transcript is extensively polyadenylated by FAM46C in MM cells. High-resolution northern blot analysis of SSR4 transcripts from SKMM1 (lanes 1–6) and H929 (lanes 7–12) transduced with GFP (lanes 1, 2, 7, 8), FAM46CWT-GFP (lanes 3, 4, 9, 10), and FAM46Cmut-GFP (lanes 5, 6, 11, 12) after RNase H treatment (lanes 1, 3, 5, 7, 9, 11) to remove the poly(A) tail in presence of oligo(dT)25. Control reactions were carried out in the presence of oligo(dT) without RNase H (lanes 2, 4, 6, 8, 10, 12). Kinetics of polyadenylation of SSR4, NAPSA, FTL, and CD320 transcripts over the time course of FAM46C expression. c High- and low-resolution northern blot analysis of SSR4, NAPSA, GAPDH, and RN7 transcripts from H929 (lanes 1–7) and SKMM1 cells (lanes 8–14) transduced with FAM46CWT-GFP up to 24 h. d High-resolution northern blot analysis of SSR4 and FTL transcripts from H929 (lanes 1–8) and SKMM1 cells (lanes 9–16) transduced with FAM46CWT-GFP (lanes 1–4, 9–12) and FAM46Cmut-GFP (lanes 5–8, 13–16) up to 72 h. e Northern blot analysis of NAPSA and CD320 transcripts from H929 (lanes 1–4) and SKMM1 cells (lanes 5–8) transduced with FAM46CWT-GFP up to 72 h
Fig. 9
Fig. 9
FAM46C interacts with BCCIPβ and PABPC1 in human cells. a Visualizations of Co-IP-MS experiments using GFP-tagged FAM46C expressed in myeloma cells H929 (shown in blue) and SKMM1 (shown in red). Estimated quantities of identified proteins were calculated using the label-free quantification (LFQ) algorithm and are represented as dot–plot graphs. Protein abundance was calculated as LFQ intensity of the protein signal divided by its molecular weight and is shown on the x axis on a logarithmic scale. Specificity was defined as the ratio of protein LFQ intensity measured in the bait Co-IP to the background level (protein LFQ intensity in a sample) and is shown on the y axis on a logarithmic scale. b, c Western-blot detection of BCCIPβ and PABPC1 co-immunoprecipitated with: b FAM46CWT-GFP and FAM46Cmut-GFP from stable HEK293 cell lines; c FAM46CWT-GFP from transduced SKMM1 and H929 MM cell lines. Purification was performed at low (lanes 1–3) and high (lanes 4–6) ionic strengths. GFP-tagged FAM46C was detected with α-GFP antibodies. Please note that the lack of the GFP signal in the GFP only control (lanes 1 and 4) is because the blot was cutoff to avoid very strong GFP signal, which could influence the readout

Similar articles

Cited by

References

    1. Barbieri M, et al. Compendium of FAM46C gene mutations in plasma cell dyscrasias. Br. J. Haematol. 2015;174:642–645. doi: 10.1111/bjh.13793. - DOI - PubMed
    1. Raab MS, Podar K, Breitkreutz I, Richardson PG, Anderson KC. Multiple myeloma. Lancet. 2009;374:324–339. doi: 10.1016/S0140-6736(09)60221-X. - DOI - PubMed
    1. Boyd KD, et al. Mapping of chromosome 1p deletions in myeloma identifies FAM46C at 1p12 and CDKN2C at 1p32.3 as being genes in regions associated with adverse survival. Clin. Cancer Res. 2011;17:7776–7784. doi: 10.1158/1078-0432.CCR-11-1791. - DOI - PMC - PubMed
    1. Prideaux SM, Conway O’Brien E, Chevassut TJ. The genetic architecture of multiple myeloma. Adv. Hematol. 2014;2014:864058. - PMC - PubMed
    1. Chapman MA, et al. Initial genome sequencing and analysis of multiple myeloma. Nature. 2011;471:467–472. doi: 10.1038/nature09837. - DOI - PMC - PubMed

Publication types

MeSH terms