

Disrupted topological organization of structural brain networks in childhood absence epilepsy
- PMID: 28931825
- PMCID: PMC5607318
- DOI: 10.1038/s41598-017-10778-0
Disrupted topological organization of structural brain networks in childhood absence epilepsy
Abstract
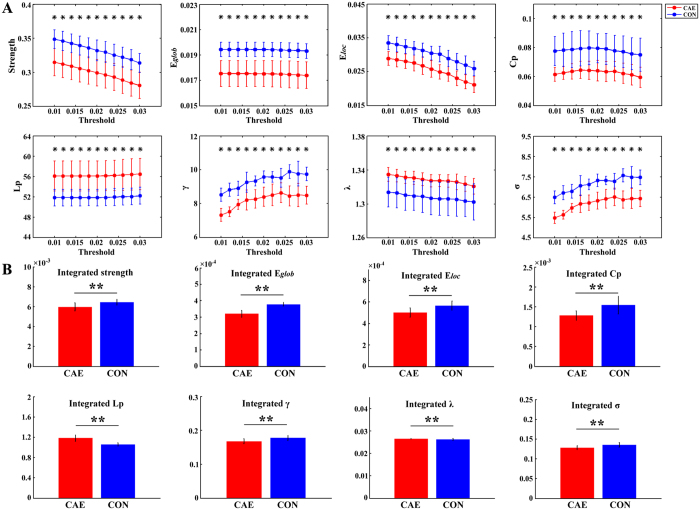
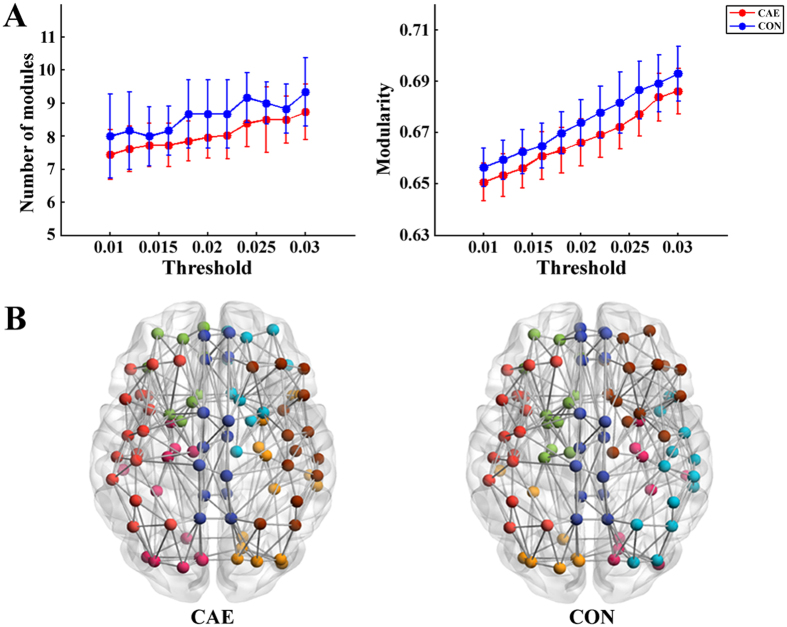
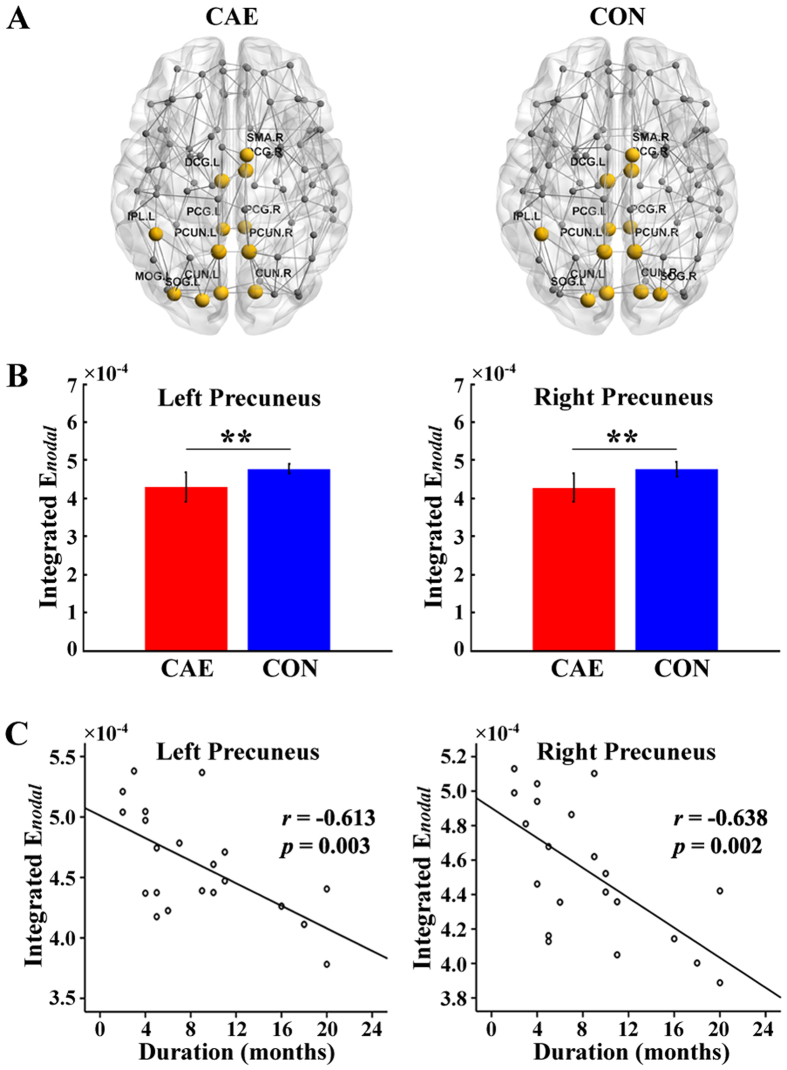
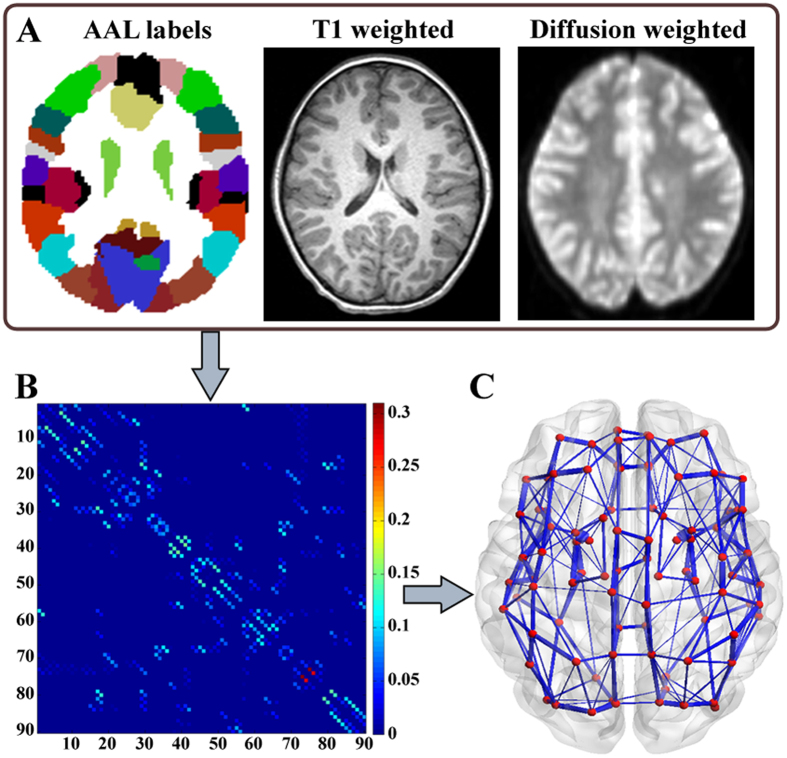
Childhood absence epilepsy (CAE) is the most common paediatric epilepsy syndrome and is characterized by frequent and transient impairment of consciousness. In this study, we explored structural brain network alterations in CAE and their association with clinical characteristics. A whole-brain structural network was constructed for each participant based on diffusion-weighted MRI and probabilistic tractography. The topological metrics were then evaluated. For the first time, we uncovered modular topology in CAE patients that was similar to healthy controls. However, the strength, efficiency and small-world properties of the structural network in CAE were seriously damaged. At the whole brain level, decreased strength, global efficiency, local efficiency, clustering coefficient, normalized clustering coefficient and small-worldness values of the network were detected in CAE, while the values of characteristic path length and normalized characteristic path length were abnormally increased. At the regional level, especially the prominent regions of the bilateral precuneus showed reduced nodal efficiency, and the reduction of efficiency was significantly correlated with disease duration. The current results demonstrate significant alterations of structural networks in CAE patients, and the impairments tend to grow worse over time. Our findings may provide a new way to understand the pathophysiological mechanism of CAE.
Conflict of interest statement
The authors declare that they have no competing interests.
Figures
Similar articles
-
Functional brain network characteristics are associated with epilepsy severity in childhood absence epilepsy.Neuroimage Clin. 2020;27:102264. doi: 10.1016/j.nicl.2020.102264. Epub 2020 Apr 23. Neuroimage Clin. 2020. PMID: 32387851 Free PMC article.
-
Diffusion tensor tractography reveals disrupted structural connectivity in childhood absence epilepsy.Epilepsy Res. 2014 Jan;108(1):125-38. doi: 10.1016/j.eplepsyres.2013.10.002. Epub 2013 Oct 21. Epilepsy Res. 2014. PMID: 24246142
-
Pretreatment topological disruptions of whole-brain networks exist in childhood absence epilepsy: A resting-state EEG-fMRI study.Epilepsy Res. 2022 May;182:106909. doi: 10.1016/j.eplepsyres.2022.106909. Epub 2022 Mar 16. Epilepsy Res. 2022. PMID: 35339064
-
Topological Organization Alterations of Whole-Brain Functional Networks in Patients with Childhood Absence Epilepsy: Associations with Treatment Effects.Dis Markers. 2021 Jun 26;2021:2727596. doi: 10.1155/2021/2727596. eCollection 2021. Dis Markers. 2021. PMID: 34257743 Free PMC article. Clinical Trial.
-
Impaired rich-club connectivity in childhood absence epilepsy.Front Neurol. 2023 May 11;14:1135305. doi: 10.3389/fneur.2023.1135305. eCollection 2023. Front Neurol. 2023. PMID: 37251238 Free PMC article.
Cited by
-
Altered Structural Network in Newly Onset Childhood Absence Epilepsy.J Clin Neurol. 2020 Oct;16(4):573-580. doi: 10.3988/jcn.2020.16.4.573. J Clin Neurol. 2020. PMID: 33029962 Free PMC article.
-
Functional brain network characteristics are associated with epilepsy severity in childhood absence epilepsy.Neuroimage Clin. 2020;27:102264. doi: 10.1016/j.nicl.2020.102264. Epub 2020 Apr 23. Neuroimage Clin. 2020. PMID: 32387851 Free PMC article.
-
Anatomy Based Networks and Topology Alteration in Seizure-Related Cognitive Outcomes.Front Neuroanat. 2018 Apr 6;12:25. doi: 10.3389/fnana.2018.00025. eCollection 2018. Front Neuroanat. 2018. PMID: 29681801 Free PMC article. Review.
-
Functional network topology in drug resistant and well-controlled idiopathic generalized epilepsy: a resting state functional MRI study.Brain Commun. 2021 Aug 26;3(3):fcab196. doi: 10.1093/braincomms/fcab196. eCollection 2021. Brain Commun. 2021. PMID: 34514400 Free PMC article.
-
Temporal and spatial dynamic propagation of electroencephalogram by combining power spectral and synchronization in childhood absence epilepsy.Front Neuroinform. 2022 Aug 16;16:962466. doi: 10.3389/fninf.2022.962466. eCollection 2022. Front Neuroinform. 2022. PMID: 36059863 Free PMC article.
References
-
- ILAE. Proposal for revised classification of epilepsies and epileptic syndromes. Commission on Classification and Terminology of the International League Against Epilepsy. Epilepsia30, 389-399 (1989). - PubMed
Publication types
MeSH terms
LinkOut - more resources
Full Text Sources
Other Literature Sources
Medical
