

Towards an ultra-rapid smartphone- connected test for infectious diseases
- PMID: 28931860
- PMCID: PMC5607310
- DOI: 10.1038/s41598-017-11887-6
Towards an ultra-rapid smartphone- connected test for infectious diseases
Abstract
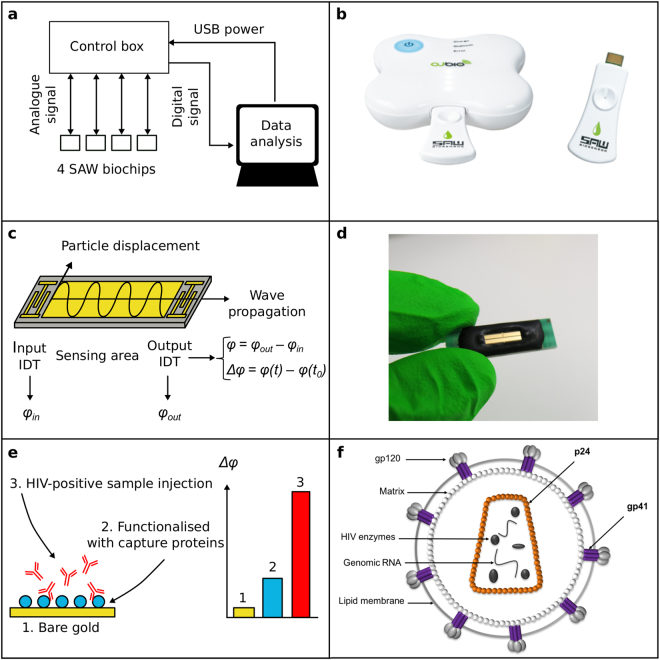
The development is reported of an ultra-rapid, point-of-care diagnostic device which harnesses surface acoustic wave (SAW) biochips, to detect HIV in a finger prick of blood within 10 seconds (sample-in-result-out). The disposable quartz biochip, based on microelectronic components found in every consumer smartphone, is extremely fast because no complex labelling, amplification or wash steps are needed. A pocket-sized control box reads out the SAW signal and displays results electronically. High analytical sensitivity and specificity are found with model and real patient blood samples. The findings presented here open up the potential of consumer electronics to cut lengthy test waiting times, giving patients on the spot access to potentially life-saving treatment and supporting more timely public health interventions to prevent disease transmission.
Conflict of interest statement
The following are declared: D.A., V.L., and H.Y. work for O.J.-Bio which produces the SAW prototype. C.V. is employed by a commercial company, Q.V.Q. B.V. This does not alter their adherence to policies on data sharing and materials. A studentship to V.T. was part-funded by O.J.-Bio. All other authors declare no competing interests exist.
Figures
Similar articles
-
Application of Shear Horizontal Surface Acoustic Wave (SH-SAW) Immunosensor in Point-of-Care Diagnosis.Biosensors (Basel). 2023 Jun 1;13(6):605. doi: 10.3390/bios13060605. Biosensors (Basel). 2023. PMID: 37366970 Free PMC article. Review.
-
3D-printed Point-of-Care Platform for Genetic Testing of Infectious Diseases Directly in Human Samples Using Acoustic Sensors and a Smartphone.ACS Sens. 2019 May 24;4(5):1329-1336. doi: 10.1021/acssensors.9b00264. Epub 2019 Apr 25. ACS Sens. 2019. PMID: 30964650
-
Ultra-rapid, sensitive and specific digital diagnosis of HIV with a dual-channel SAW biosensor in a pilot clinical study.NPJ Digit Med. 2018 Aug 17;1:35. doi: 10.1038/s41746-018-0041-5. eCollection 2018. NPJ Digit Med. 2018. PMID: 31304317 Free PMC article.
-
Magneto-nanosensor smartphone platform for the detection of HIV and leukocytosis at point-of-care.Nanomedicine. 2019 Feb;16:10-19. doi: 10.1016/j.nano.2018.11.007. Epub 2018 Nov 28. Nanomedicine. 2019. PMID: 30502420
-
Automatic smartphone-based microfluidic biosensor system at the point of care.Biosens Bioelectron. 2018 Jul 1;110:78-88. doi: 10.1016/j.bios.2018.03.018. Epub 2018 Mar 21. Biosens Bioelectron. 2018. PMID: 29602034 Review.
Cited by
-
Acoustic Biosensors and Microfluidic Devices in the Decennium: Principles and Applications.Micromachines (Basel). 2021 Dec 26;13(1):24. doi: 10.3390/mi13010024. Micromachines (Basel). 2021. PMID: 35056189 Free PMC article. Review.
-
Application of Shear Horizontal Surface Acoustic Wave (SH-SAW) Immunosensor in Point-of-Care Diagnosis.Biosensors (Basel). 2023 Jun 1;13(6):605. doi: 10.3390/bios13060605. Biosensors (Basel). 2023. PMID: 37366970 Free PMC article. Review.
-
Nanobodies that Neutralize HIV.Vaccines (Basel). 2019 Jul 31;7(3):77. doi: 10.3390/vaccines7030077. Vaccines (Basel). 2019. PMID: 31370301 Free PMC article. Review.
-
Real-time, smartphone-based processing of lateral flow assays for early failure detection and rapid testing workflows.Sens Diagn. 2022 Dec 1;2(1):100-110. doi: 10.1039/d2sd00197g. eCollection 2023 Jan 19. Sens Diagn. 2022. PMID: 36741250 Free PMC article.
-
Virus Detection: From State-of-the-Art Laboratories to Smartphone-Based Point-of-Care Testing.Adv Sci (Weinh). 2022 Jun;9(17):e2105904. doi: 10.1002/advs.202105904. Epub 2022 Apr 7. Adv Sci (Weinh). 2022. PMID: 35393791 Free PMC article. Review.
References
-
- Gray RH, et al. Limitations of rapid HIV-1 tests during screening for trials in Uganda: diagnostic test accuracy study. BMJ. 2007;335:188. doi: 10.1136/bmj.39210.582801.BE. - DOI - PMC - PubMed
-
- WHO. Rapid HIV tests: Guidelines for use in HIV testing and counselling services in ressource-constrained settings. WHO (World Health Organization, 2004).
Publication types
MeSH terms
Grants and funding
LinkOut - more resources
Full Text Sources
Other Literature Sources
Medical
