. 2017 Sep 20;7(1):11972.
doi: 10.1038/s41598-017-11865-y.

Longitudinal analysis of colon crypt stem cell dynamics in sulindac treated Familial Adenomatous Polyposis patients

Affiliations

Longitudinal analysis of colon crypt stem cell dynamics in sulindac treated Familial Adenomatous Polyposis patients

Huiying Ma et al. Sci Rep. .

Abstract

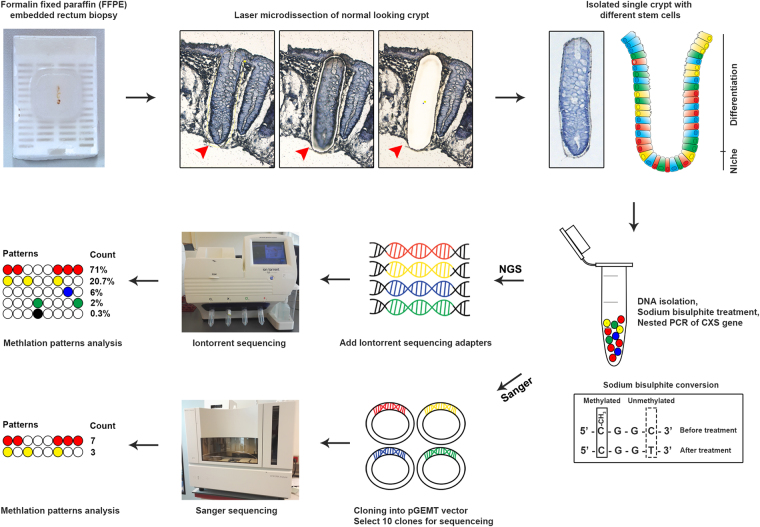
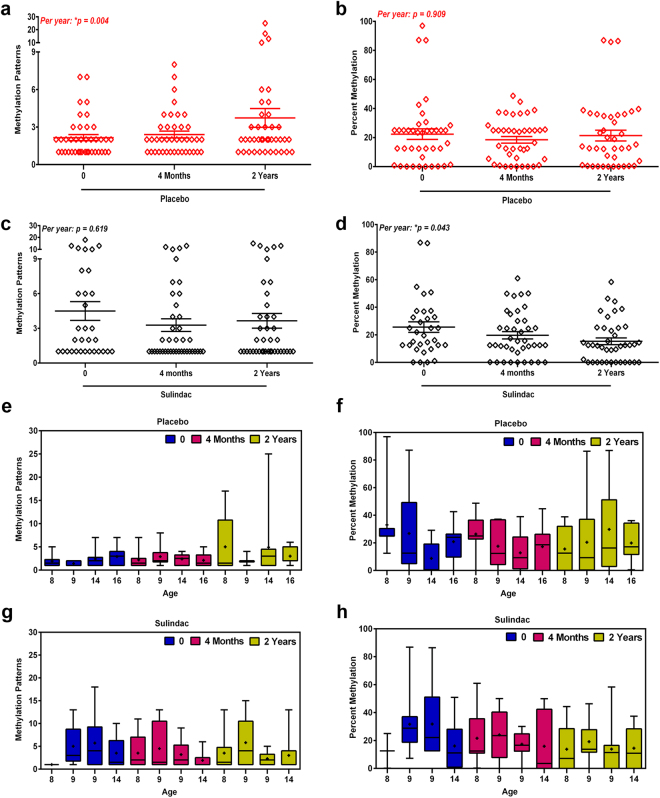
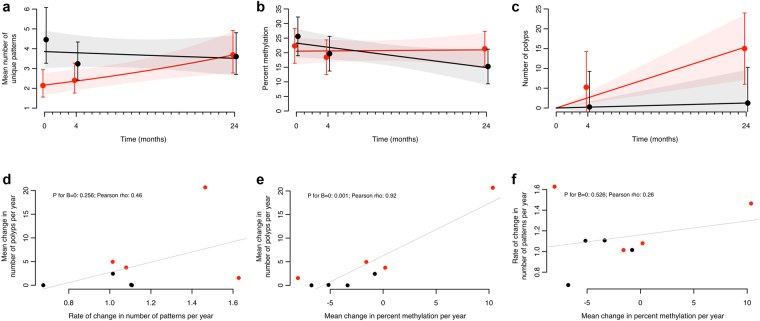
The non-steroidal anti-inflammatory drug sulindac decreases size and number of adenomas after 4-6 months of treatment for familial adenomatous polyposis (FAP) patients. However, the underlying mechanism remains unknown. As stem cells are thought to be the tumor precursor cells, visualizing their behavior is crucial for monitoring tumor progression. Increased tag diversity in inactive genes is indicative of a protracted clonal evolution and consequently, increased risk for tumor formation. Therefore, the effect of sulindac on stem cell dynamics was studied. Normal appearing single crypts were laser microdissected in placebo- and sulindac- treated FAP patient tissue after which the methylation patterns were visualized by Next Generation Sequencing. A significant difference in tag diversity over time was found in the sulindac group compared to the placebo group (*p = 0.018), indicative of a shortened clonal evolution treated sulindac. The rate of change in tag diversity over time was correlated with polyp number change over time. No significant difference over time was observed in the percent methylation when comparing placebo vs sulindac. In conclusion, daily sulindac administration in FAP patients significantly altered colorectal stem cell dynamics, which might explain the chemopreventive action of this drug indicating that tag diversity may be used as a predictive biomarker.


Conflict of interest statement

The authors declare that they have no competing interests.

Figures

Figure 1
Figure 1
Workflow of stem cell dynamics assay. The assay is performed on archival paraffin embedded (FFPE) material from normal-looking tissues. Single crypts are laser microdissected, and DNA is isolated. Next, the extracted genomic DNA is treated with sodium bisulphite to convert unmethylated cytosines into uracil; methylated cytosines are protected from this turnover. A nested PCR is performed to target the CSX sequence. The PCR products are extended with Iontorrent PGM sequencing adapters and sequenced following the manufacturers protocol. The various methylation patterns per crypt can then be clustered by adapters. Different numbers of reads are found for each pattern including PCR errors which occurred below 1% count. Meanwhile, as a technical control, the same PCR products are cloned into bacterial vectors and enumerated after a sequence analysis of cloned inserts. 10 clones were selected for sequencing so for each crypt, the total number of counts are 10. CSX, cardiac-specific homeobox. Different colors represent different methylation patterns.
Figure 2
Figure 2
Stem cell dynamics analysis using NGS. (a,b) Methylation patterns and percent methylation of placebo group (red diamond) including time point 0, 4 months and 2 years; (c,d) Methylation patterns and percent methylation of sulindac group (black diamond) including time point 0, 4 months and 2 years; The trend in time per group (both placebo and sulindac) was indicated as p-values where other statistical values are mentioned in Table 2. (e,f) Methylation patterns and percent methylation for all four patients in placebo group; (g,h) Methylation patterns and percent methylation for all four patients in sulindac group. Each block represents one patient at indicated time point.
Figure 3
Figure 3
Multilevel mixed-effect regression analysis showing the interaction of treatment and time with methylation patterns and percent methylation together with polyp numbers. (a,b and c) Results are shown for methylation patterns (a), percent methylation (b) and number of polyps (c); the solid lines are the results from linear trend analyses; 95% confidence intervals are shown by error bars and the shadows surrounding the trend lines. (df) The relation between change per year in number of patterns (d) and percent methylation (e) with number of polyps, and each other (f) on an individual patient basis; lines show linear regression lines through data-points. Red: Placebo; black: Sulindac.

Similar articles

Cited by

References

    1. Wright NA, Irwin M. The kinetics of villus cell populations in the mouse small intestine. I. Normal villi: the steady state requirement. Cell Tissue Kinet. 1982;15:595–609. - PubMed
    1. Kim KM, Shibata D. Methylation reveals a niche: stem cell succession in human colon crypts. Oncogene. 2002;21:5441–5449. doi: 10.1038/sj.onc.1205604. - DOI - PubMed
    1. Ro S, Rannala B. Methylation patterns and mathematical models reveal dynamics of stem cell turnover in the human colon. Proc Natl Acad Sci USA. 2001;98:10519–10521. doi: 10.1073/pnas.201405498. - DOI - PMC - PubMed
    1. Yatabe Y, Tavare S, Shibata D. Investigating stem cells in human colon by using methylation patterns. Proc Natl Acad Sci USA. 2001;98:10839–10844. doi: 10.1073/pnas.191225998. - DOI - PMC - PubMed
    1. Baker AM, et al. Quantification of crypt and stem cell evolution in the normal and neoplastic human colon. Cell Rep. 2014;8:940–947. doi: 10.1016/j.celrep.2014.07.019. - DOI - PMC - PubMed