. 2017 Sep 20;7(1):11999.
doi: 10.1038/s41598-017-12212-x.

Characterization of a spectrally diverse set of fluorescent proteins as FRET acceptors for mTurquoise2

Affiliations

Characterization of a spectrally diverse set of fluorescent proteins as FRET acceptors for mTurquoise2

Marieke Mastop et al. Sci Rep. .

Abstract

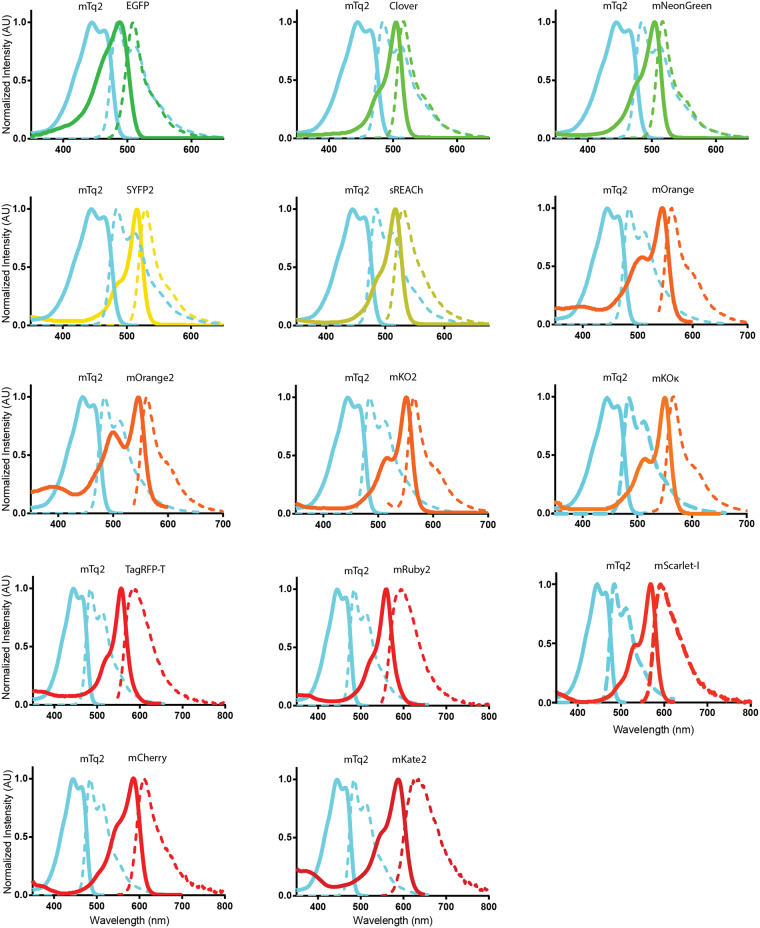
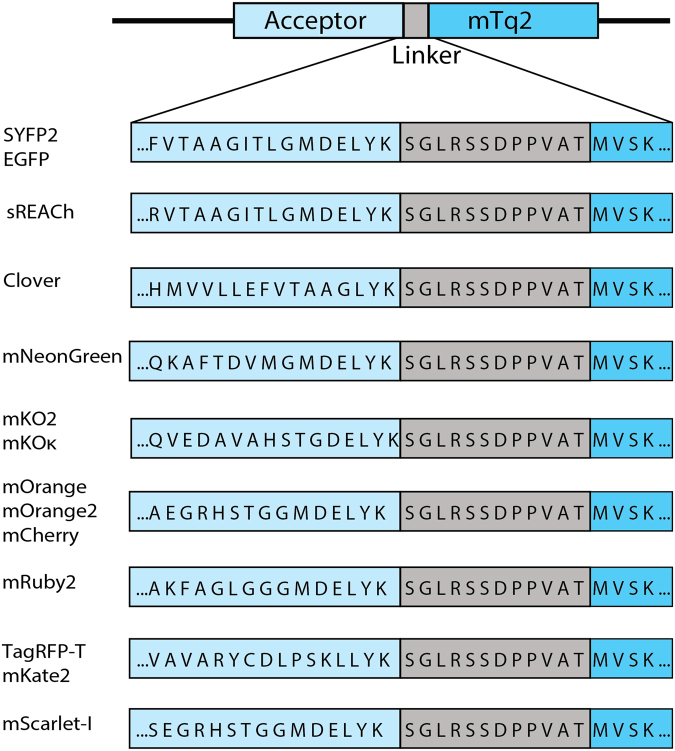
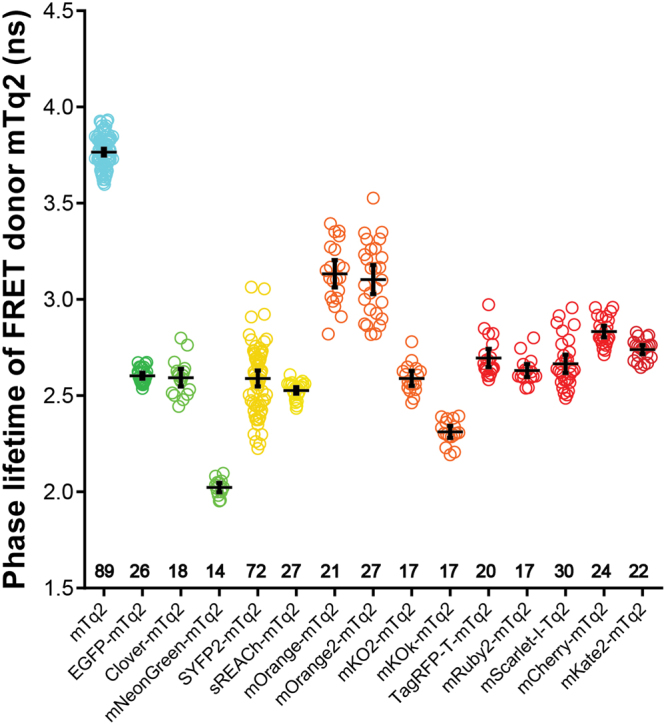
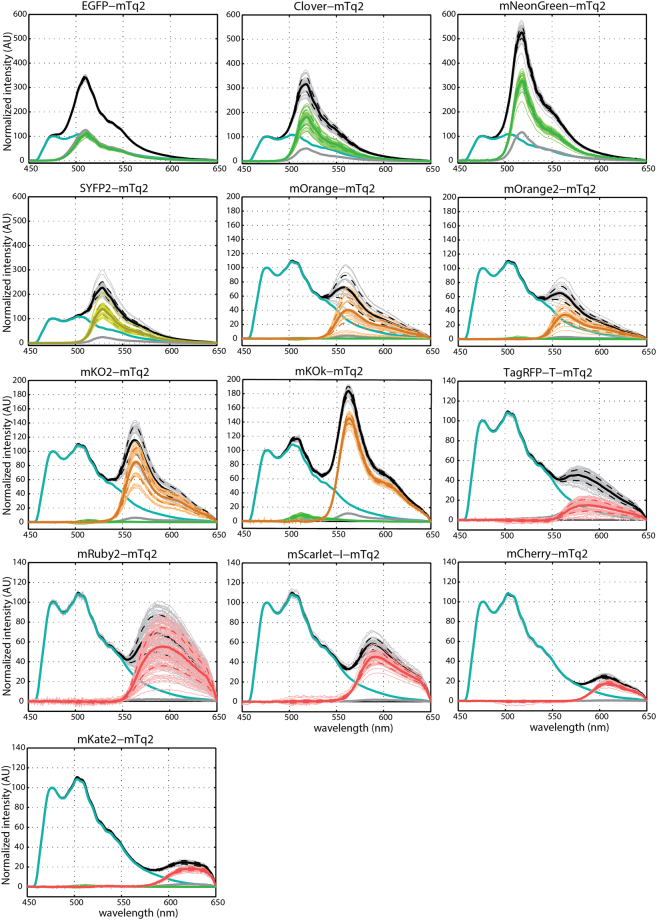
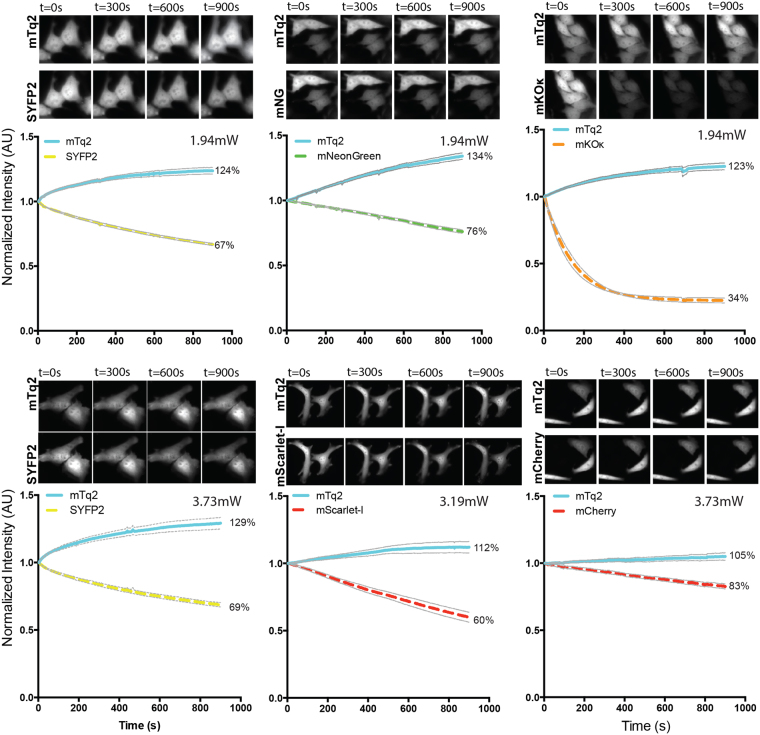
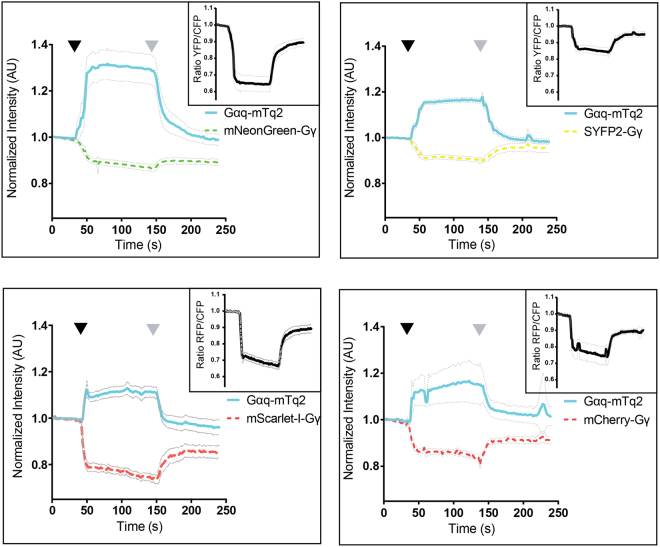
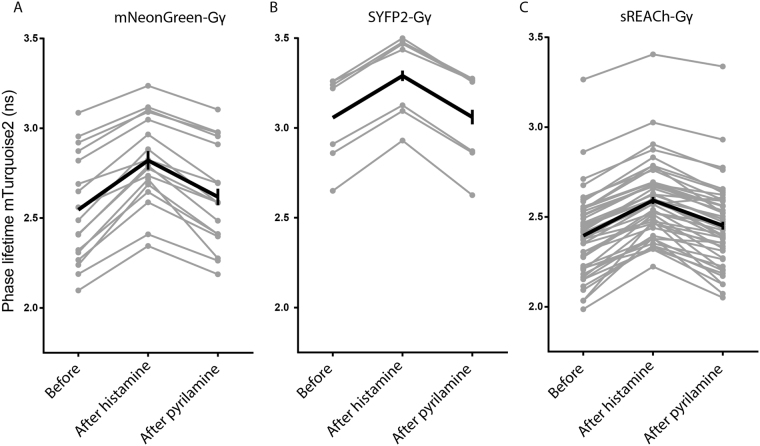
The performance of Förster Resonance Energy Transfer (FRET) biosensors depends on brightness and photostability, which are dependent on the characteristics of the fluorescent proteins that are employed. Yellow fluorescent protein (YFP) is often used as an acceptor but YFP is prone to photobleaching and pH changes. In this study, we evaluated the properties of a diverse set of acceptor fluorescent proteins in combination with the optimized CFP variant mTurquoise2 as the donor. To determine the theoretical performance of acceptors, the Förster radius was determined. The practical performance was determined by measuring FRET efficiency and photostability of tandem fusion proteins in mammalian cells. Our results show that mNeonGreen is the most efficient acceptor for mTurquoise2 and that the photostability is better than SYFP2. The non-fluorescent YFP variant sREACh is an efficient acceptor, which is useful in lifetime-based FRET experiments. Among the orange and red fluorescent proteins, mCherry and mScarlet-I are the best performing acceptors. Several new pairs were applied in a multimolecular FRET based sensor for detecting activation of a heterotrimeric G-protein by G-protein coupled receptors. Overall, the sensor with mNeonGreen as acceptor and mTurquoise2 as donor showed the highest dynamic range in ratiometric FRET imaging experiments with the G-protein sensor.


Conflict of interest statement

The authors declare that they have no competing interests.

Figures

Figure 1
Figure 1
Absorption and emission spectra of the FRET pairs investigated in this study. The spectra were recorded from purified proteins and were normalized to their peak values. Solid lines indicate absorption spectra and dashed lines indicate emission spectra. All lines are colored according to the emission wavelength of the fluorescent protein. All spectra show the donor mTurquoise2 (mTq2) and the indicated acceptor. Data available at http://doi.org/10.5281/zenodo.580169.
Figure 2
Figure 2
Schematic overview of the fusion constructs used in this study. The differences in the amino acid sequence of the C-termini of the acceptor fluorescent proteins are depicted. The distance between the acceptor chromophore and its C-terminus is 158 amino acids for mKO2 and mKOκ, 163 amino acids for mOrange, mOrange2, mScarlet-I and mCherry, 164 amino acids for Clover, 166 amino acids for mNeonGreen, TagRFP-T and mKate2, 168 amino acids for mRuby2 and 171 amino acids for EGFP, SYFP2 and sREACh. The acceptors are followed by a small linker, which is the same for each construct, separating it from the donor mTurquoise2 (mTq2).
Figure 3
Figure 3
Fluorescence lifetime of the FRET donor mTurquoise2 fused to different FRET acceptors. The phase lifetime of mTurquoise2 (mTq2) when paired with different acceptors is depicted. As a reference the lifetime of untagged mTurquoise2 is shown. The dots indicate individual cells and the error bars show 95% confidence intervals. The number of cells imaged is mTq2 n = 89, EGFP n = 26, Clover n = 18, mNeonGreen n = 14, SYFP2 n = 72, sREACh n = 27, mOrange n = 21, mOrange2 n = 27, mKO2 n = 17, mKOκ n = 17, TagRFP-T n = 20, mRuby2 n = 17, mScarlet-I n = 30, mCherry n = 24, mKate2 n = 22.
Figure 4
Figure 4
Spectral images of the FRET donor mTurquoise2 fused to different FRET acceptors. The emission spectra of FRET pairs were recorded from single living cells. The sensitized emission component was calculated by unmixing the donor spectrum and the direct acceptor excitation. Black lines represent the FRET-pair spectra. Cyan lines represent the donor emission spectra. Grey lines represent direct acceptor excitation spectra. If orange or red fluorescent proteins show an evident green component, this is represented by a green line. Lines in color of the acceptor emission represent the unmixed sensitized emission. Thick lines show the average emission spectrum, dashed lines represent the standard deviations and thin lines show individual measurements. Based on these data the FRET efficiency was calculated (Table 3). The number of cells imaged is EGFP n = 37, Clover n = 36, mNeonGreen n = 46, SYFP2 n = 39, mOrange n = 24, mOrange2 n = 22, mKO2 n = 35, mKOκ n = 24, TagRFP-T n = 50, mRuby2 n = 66, mScarlet-I n = 47, mCherry n = 28, mKate2 n = 27.
Figure 5
Figure 5
Photostability of tandem pairs during ratiometric FRET measurements. Fusion constructs of mTurquoise2 and acceptor fluorescent protein were used in this experiment. The power is shown in the graphs. The thin lines display the 95% confidence intervals. The photostability of the fusion constructs is shown under continuous illumination with 420 nm light for 900 s. Images of cells after 0 s, 300 s, 600 s and 900 s illumination show the fluorescence intensity. The width of the images are 58.14μm for SYFP2-mTurquoise2 (1.94 mW), 87.21μm for mNeonGreen-mTurquoise2, 80.07μm for mKOκ-mTurquoise2, 116.28μm for SYFP2-mTurquoise2 (3.73 mW), 147.56μm for mScarlet-I-mTurquoise2 and 116.28μm for mCherry-mTurquoise2. For the graph the initial fluorescence intensity was set on 100% and it is stated what percentage of the initial fluorescence is left after 900 s illumination. The number of cells imaged is: SYFP2-mTq2 (1.94 mW) n = 23; mNeonGreen-mTq2 n = 21; mKOκ-mTq2 n = 15; SYFP2-mTq2 (3.73 mW) n = 23; mScarlet-I-mTq2 n = 11; mCherry-mTq2 n = 15.
Figure 6
Figure 6
Ratiometric FRET imaging of Gq-activation biosensors equipped with novel FRET pairs. FRET ratio-imaging was performed on Hela cells over-expressing the histamine−1 receptor and a FRET biosensor for Gq activation. The blue, solid lines show the mTurquoise2 fluorescence intensity over time, the dashed lines show the acceptor emission level over time. The initial fluorescence intensity is normalized to the average intensity of the first 5 frames. The black graph in a separate upper right window shows the FRET ratio over time. The thin lines indicate the 95% confidence intervals. 100 μM histamine was added after 42–50 s (black arrowhead) and 10 μM pyrilamine was added after 140–150 s (grey arrowhead). The number of cells analysed is: Gqsensor-mTq2-mNeonGreen n = 32 (out of 34 in total), Gqsensor-mTq2-SYFP2 n = 42 (out of 44 in total), Gqsensor-mTq2-mScarlet-I n = 24 (out of 26 in total) and Gqsensor-mTq2-mCherry n = 19 (out of 26 in total)
Figure 7
Figure 7
FlIM-FRET of Gq activation biosensors equipped with novel FRET pairs. The fluorescence lifetime of mTurquoise2 was recorded from the biosensor for Gαq activation containing mNeonGreen, SYFP2 or sREACh as FRET acceptor. The phase lifetime was recorded before addition of (ant)agonist, 20–60 s after addition of 100 μM histamine and 20–60 s after addition of 10 μM pyrilamine. The changes in phase lifetime are shown in the graphs. The grey lines represent individual cells and the black graph represents the average of which the error bars indicate the 95% confidence intervals. The number of cells used for the graph is for mNeonGreen as FRET acceptor n = 17 (out of a total of 26 cells), for SYFP2 as FRET acceptor n = 7 (out of a total of 23 cells) and for sREACh as FRET acceptor n = 46 (out of a total of 60 cells).

Similar articles

Cited by

References

    1. Chudakov DM, Matz MV, Lukyanov S, Lukyanov KA. Fluorescent proteins and their applications in imaging living cells and tissues. Physiol Rev. 2010;90:1103–1163. doi: 10.1152/physrev.00038.2009. - DOI - PubMed
    1. Tsien RY. The Green Fluorescent. Proteins. 1998;67:509–44. - PubMed
    1. Miyawaki A, Niino Y. Molecular Spies for Bioimaging — Fluorescent Protein-Based Probes. Mol. Cell. 2015;58:632–643. doi: 10.1016/j.molcel.2015.03.002. - DOI - PubMed
    1. Chudakov DM, Lukyanov S, Lukyanov KA. Fluorescent proteins as a toolkit for in vivo imaging. Trends Biotechnol. 2005;23:605–613. doi: 10.1016/j.tibtech.2005.10.005. - DOI - PubMed
    1. Gadella TWJ, Jr., Van der Krogt GN, Bisseling T. GFP-based FRET microscopy in living plant cells. Trends Plant Sci. 1999;4:287–291. doi: 10.1016/S1360-1385(99)01426-0. - DOI - PubMed

Publication types

MeSH terms