. 2017 Sep 20;7(1):11959.
doi: 10.1038/s41598-017-12335-1.

Alpha TC1 and Beta-TC-6 genomic profiling uncovers both shared and distinct transcriptional regulatory features with their primary islet counterparts

Affiliations

Alpha TC1 and Beta-TC-6 genomic profiling uncovers both shared and distinct transcriptional regulatory features with their primary islet counterparts

Nathan Lawlor et al. Sci Rep. .

Abstract

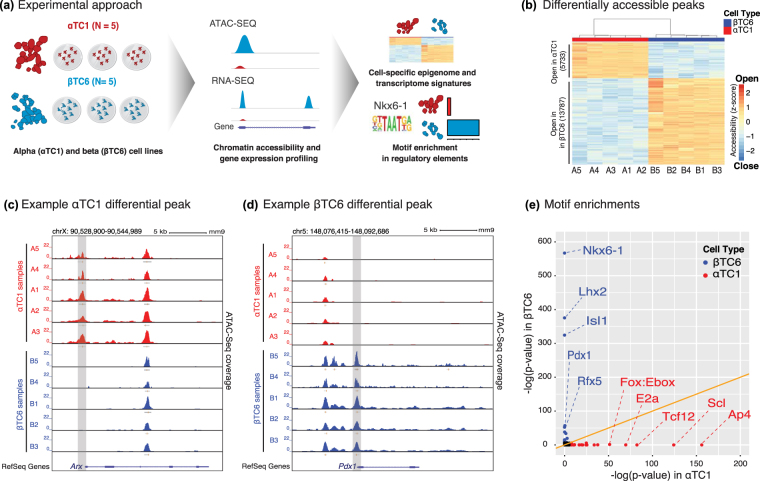
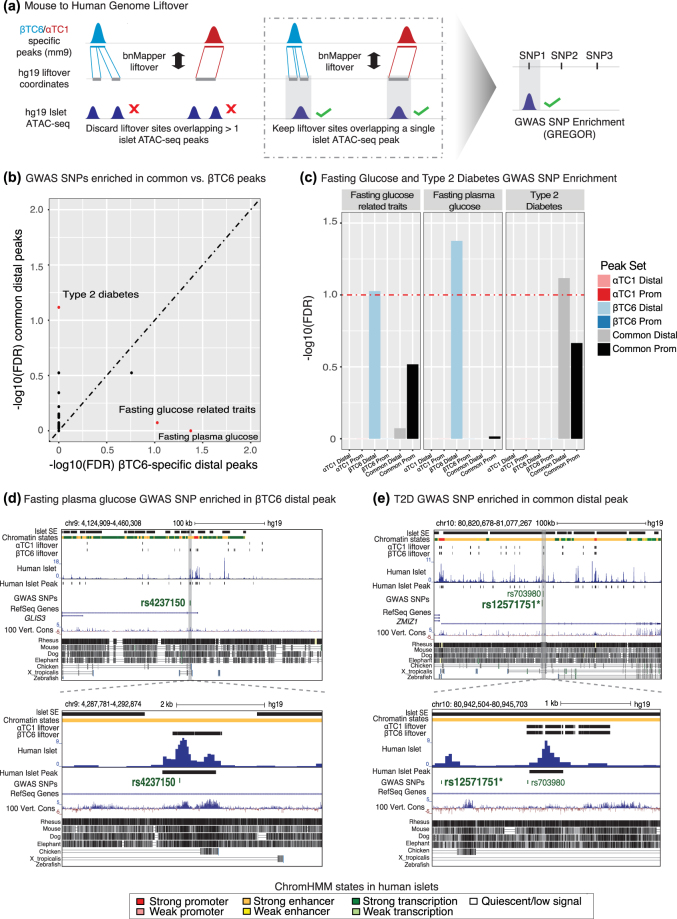
Alpha TC1 (αTC1) and Beta-TC-6 (βTC6) mouse islet cell lines are cellular models of islet (dys)function and type 2 diabetes (T2D). However, genomic characteristics of these cells, and their similarities to primary islet alpha and beta cells, are undefined. Here, we report the epigenomic (ATAC-seq) and transcriptomic (RNA-seq) landscapes of αTC1 and βTC6 cells. Each cell type exhibits hallmarks of its primary islet cell counterpart including cell-specific expression of beta (e.g., Pdx1) and alpha (e.g., Arx) cell transcription factors (TFs), and enrichment of binding motifs for these TFs in αTC1/βTC6 cis-regulatory elements. αTC1/βTC6 transcriptomes overlap significantly with the transcriptomes of primary mouse/human alpha and beta cells. Our data further indicate that ATAC-seq detects cell-specific regulatory elements for cell types comprising ≥ 20% of a mixed cell population. We identified αTC1/βTC6 cis-regulatory elements orthologous to those containing type 2 diabetes (T2D)-associated SNPs in human islets for 33 loci, suggesting these cells' utility to dissect T2D molecular genetics in these regions. Together, these maps provide important insights into the conserved regulatory architecture between αTC1/βTC6 and primary islet cells that can be leveraged in functional (epi)genomic approaches to dissect the genetic and molecular factors controlling islet cell identity and function.


Conflict of interest statement

The authors declare that they have no competing interests.

Figures

Figure 1
Figure 1
Assay for transposase-accessible chromatin (ATAC-seq) profiling of αTC1 and βTC6 identifies cell-type-specific open-chromatin regions. (a) Cartoon outline of experimental procedure. αTC1 and βTC6 replicates were profiled using ATAC-seq and RNA-seq to characterize their transcriptomic and epigenomic landscapes. Further downstream analyses were performed including pathway and transcription factor motif enrichment analyses. (b) Differential analysis of open chromatin regions revealed 5,733 and 13,787 sites open in αTC1 and βTC6 respectively. Values in heatmap reflect log2 TMM normalized read counts after mean centering and scaling. (c) UCSC genome browser views of a chromatin site exclusively open in αTC1 at Arx promoter (highlighted in grey) and (d) a similar site exclusively open in βTC6 at Pdx1 promoter (highlighted in grey). (e) Sequences of differentially accessible chromatin regions demonstrate cell-type-specific binding of TF motifs. Colored points denote motifs significantly enriched (FDR < 1%) in a cell type (red = αTC1, blue = βTC6) while black points represent motifs not enriched in either cell type. Note the cell-type-specificity of TF enrichments.
Figure 2
Figure 2
High sensitivity of ATAC-seq technology permits accurate open chromatin profiling of heterogeneous cell mixtures. (a) Cartoon representation of experimental workflow. Briefly, cell-specific “signature” peaks were defined for both αTC1/βTC6 (Step 1). Next, the sensitivity of these cell-specific sites were compared in each heterogeneous mixture sample (Step 2) and used to assess detection rates of cell-specific chromatin sites (Step 3) and finally to predict each sample’s cellular composition (Step 4). (b) Signature peaks determined by CIBERSORT. Heatmap values represent TMM normalized read counts (peak intensity). Signature vector represents the median accessibility profile for these signature peaks. (c) MA plot highlighting DA peaks specific to αTC1 (red) and βTC6 (blue). Signature peaks are colored in black (CPM = counts per million). (d) Genomic locations of signature peaks. Note most signature peaks are distal. (e) UCSC genome browser view of an αTC1 signature peak at Kcna5 promoter, that displays decreased accessibility as the αTC1 proportions decreases in mixture samples. (f) Heatmap illustrating the peak intensity of the 82 αTC1 and 82 βTC6 signature peaks in all mixture samples. (g) Scatterplots comparing the detection rate of the 13,787 differential and 82 signature βTC6 peaks (top) and the 5,733 differential (black) and 82 signature (orange) αTC1 peaks (bottom) in all mixture samples. Sizes of points in the scatterplot reflect respective library sizes (reads) for each sample. (h) Estimated cellular compositions of each mixture sample (y-axis), as determined by CIBERSORT, closely matches that of true cellular compositions (x-axis). R represents Pearson’s correlation coefficient. (i) t-SNE analyses of all mixture samples using the 164 CIBERSORT-defined signature peaks demonstrates clustering of samples based on their cellular composition.
Figure 3
Figure 3
Transcriptome profiling (RNA-seq) of αTC1 and βTC6 characterizes genes uniquely enriched in each cell type. (a,b) Differential gene expression analysis identifies 510 and 1,235 genes with enriched expression in αTC1 and βTC6 respectively (CPM = counts per million). Values in heatmap reflect log2 FPKM values after mean centering and scaling. (c) UCSC genome browser views of αTC1-specific expression of Arx (highlighted in grey) and (d) βTC6-specific expression of Pdx1 (highlighted in grey). For each view, representative ATAC-seq profiles for a single βTC6 (B3; light blue) and αTC1 (A3; orange) sample were included. (e) Scatterplot of βTC6 vs. αTC1 fold changes in gene expression (y-axis) and chromatin accessibility (x-axis) illustrates a positive and significant correlation at regions of the genome that display cell-specific chromatin accessibility and gene expression. R represents Pearson’s correlation coefficient. (f) Hierarchical clustering of mouse and human, primary islet cell and αTC1/βTC6 cell line transcriptomes groups samples by cell type regardless of species.
Figure 4
Figure 4
Common open chromatin sites in αTC1 and βTC6 demonstrate robust enrichment for T2D GWAS SNPs. (a) Cartoon schematic detailing the liftover analysis conducted from mouse genome (mm9) to human genome (hg19) using bnMapper and SNP enrichment analysis using GREGOR (Methods). (b) Scatterplot illustrating the false discovery rate (FDR) adjusted p-value enrichment scores for each category of GWAS SNPs in common distal peaks (y-axis) and βTC6-specific distal peaks (x-axis). Names of the GWAS categories that passed significance threshold (FDR < 10%) are displayed on the plot and the points for these categories are represented in red. (c) Barplots of FDR enrichment scores of GWAS SNPs for T2D and fasting glucose categories in each peak set. Horizontal dashed red line indicates an FDR threshold of 10%. (d) UCSC genome browser view of a βTC6-specific distal peak at GLIS3 directly overlapping rs4237150, a GWAS SNP associated with fasting plasma glucose levels. (e) UCSC genome browser view of a common distal peak at the ZMIZ1 locus overlapping a SNP that is in LD with a T2D associated SNP (rs12571751; indicated by bold and asterisk). Human islet stretch enhancer (SE) and chromatin state information were obtained from Parker et al.. 100 Vertebrates Basewise Conservation by Phylop and MultiZ Alignments of 100 Vertebrates tracks are provided to illustrate the sequence conservation for the highlighted ATAC-seq peaks between human, mouse, and other species.

Similar articles

Cited by

References

    1. Mohlke KL, Boehnke M. Recent advances in understanding the genetic architecture of type 2 diabetes. Hum. Mol. Genet. 2015;24:R85–R92. doi: 10.1093/hmg/ddv264. - DOI - PMC - PubMed
    1. Ashcroft FM, Rorsman P. Diabetes mellitus and the β cell: the last ten years. Cell. 2012;148:1160–1171. doi: 10.1016/j.cell.2012.02.010. - DOI - PMC - PubMed
    1. Li J, et al. Single-cell transcriptomes reveal characteristic features of human pancreatic islet cell types. EMBO Rep. 2016;17:178–187. doi: 10.15252/embr.201540946. - DOI - PMC - PubMed
    1. Lawlor N, et al. Single cell transcriptomes identify human islet cell signatures and reveal cell-type-specific expression changes in type 2 diabetes. Genome Res. gr. 2016;212720:116. - PMC - PubMed
    1. Segerstolpe Å, et al. Single-Cell Transcriptome Profiling of Human Pancreatic Islets in Health and Type 2 Diabetes. Cell Metab. 2016;24:593–607. doi: 10.1016/j.cmet.2016.08.020. - DOI - PMC - PubMed

Publication types