. 2017 Sep 20;7(1):11943.
doi: 10.1038/s41598-017-12165-1.

High accuracy label-free classification of single-cell kinetic states from holographic cytometry of human melanoma cells

Affiliations

High accuracy label-free classification of single-cell kinetic states from holographic cytometry of human melanoma cells

Miroslav Hejna et al. Sci Rep. .

Abstract

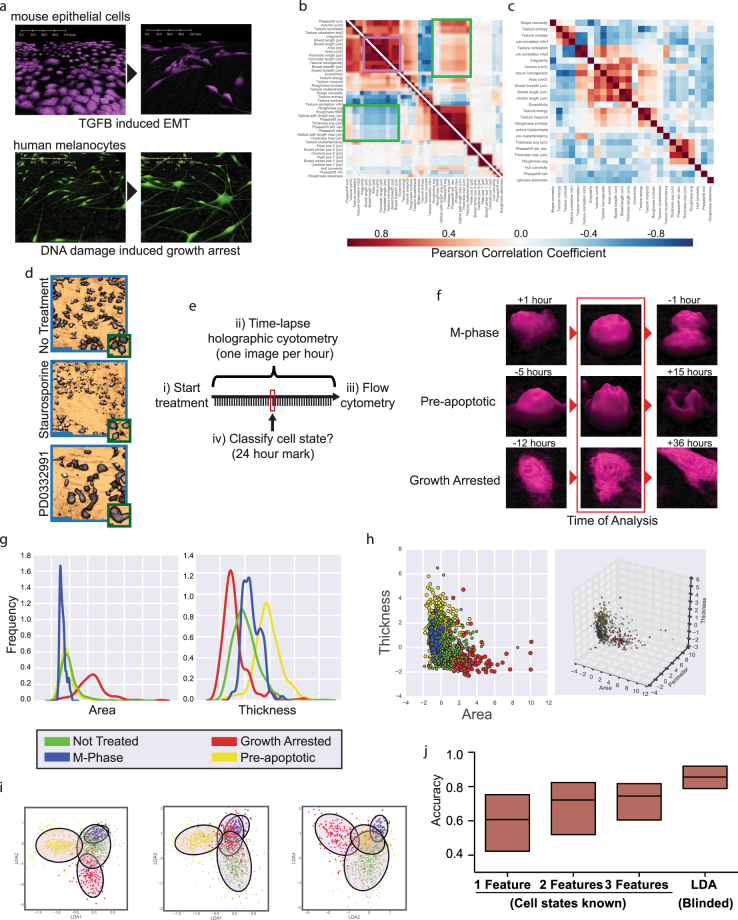
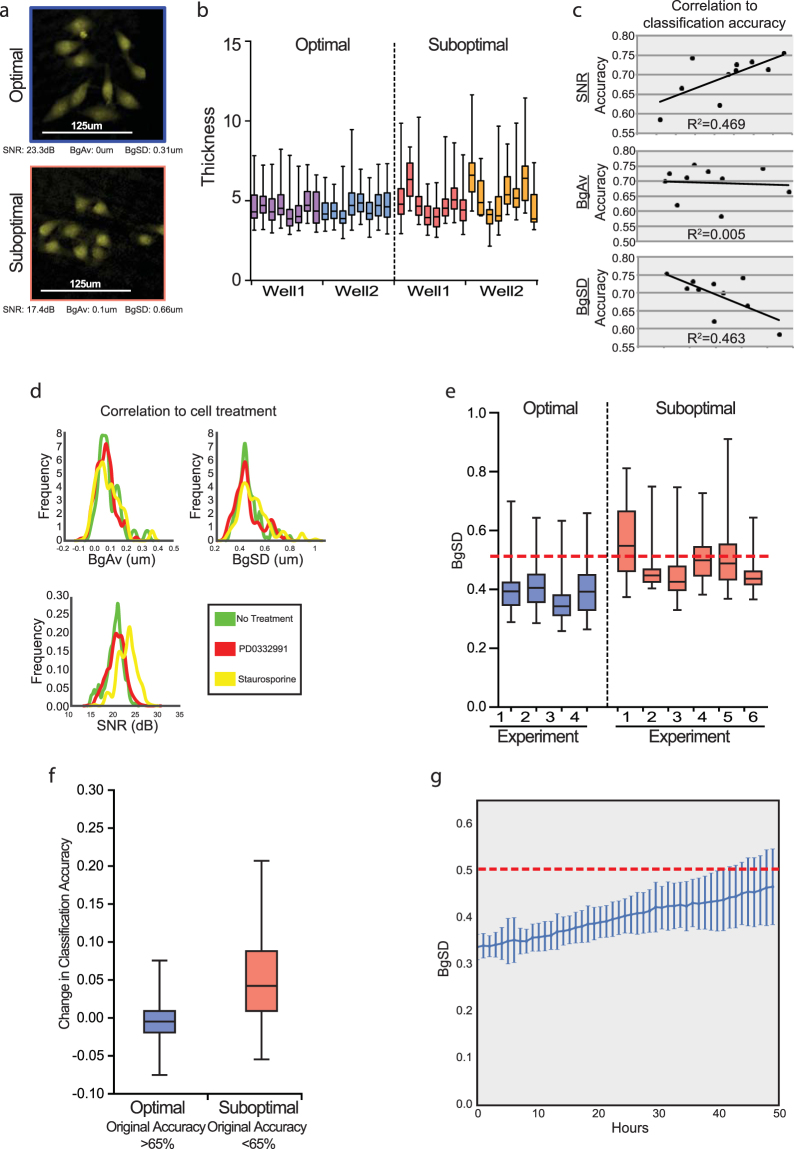
Digital holographic cytometry (DHC) permits label-free visualization of adherent cells. Dozens of cellular features can be derived from segmentation of hologram-derived images. However, the accuracy of single cell classification by these features remains limited for most applications, and lack of standardization metrics has hindered independent experimental comparison and validation. Here we identify twenty-six DHC-derived features that provide biologically independent information across a variety of mammalian cell state transitions. When trained on these features, machine-learning algorithms achieve blind single cell classification with up to 95% accuracy. Using classification accuracy to guide platform optimization, we develop methods to standardize holograms for the purpose of kinetic single cell cytometry. Applying our approach to human melanoma cells treated with a panel of cancer therapeutics, we track dynamic changes in cellular behavior and cell state over time. We provide the methods and computational tools for optimizing DHC for kinetic single adherent cell classification.


Conflict of interest statement

The authors declare that they have no competing interests.

Figures

Figure 1
Figure 1
Classification of homogeneous populations. (a) Representative DHM images for two cell state transitions: EMT (top, NuMuG cells treated with TGFB) and DNA damage (bottom, primary human melanocytes treated with Doxorubicin). (b) Two split representative feature correlation matrices for mammary epithelial cells undergoing EMT (bottom left) and human melanoma cells undergoing growth arrest (top right). Areas of conserved (purple) or non-conserved (green) correlations are highlighted. (c) Minimal correlation matrix from thirty-five experiments, each containing ~1,000–10,000 cells. (d) Representative DHM images of indicated treatments. Zoomed insets show similarity of individual cells within populations. (scale bars: 100microns (blue), 10microns (green)). (e) Strategy for DHC-based classification using cells of verified state. (f) Representative images of cells designated as M-phase, pre-apoptotic, or growth arrested. Cell fates verified after the analyzed 24-hour time-point. (g) Distribution of area and thickness for each cell state. (h) 2D and 3D scatter plots of feature distribution for each cell state. (i) Each plane from three-dimensional LDA space (Fig. S5) derived using twenty-six features, demonstrating clusters of pre-apoptotic (yellow), growth-arrested (red), non-treated (green) or M-phase (blue) cells. (j) Distribution of percent accuracy of cell classification across all experiments using single, double or triple feature sets versus machine-learning based phenotypic profiling. Plots g-i used 470 pre-apoptotic, 195 growth arrested, 66 M-phase, and 1527 non-treated cells.
Figure 2
Figure 2
Development of standardization metrics for time-lapse classification. (a) Representative DHM images of cells taken with optimal or suboptimal calibration. (b) Distribution of cellular thickness across individual holograms taken from the same well. Visually similar images yield diverse quantities. (c) Correlation of potential standardization metrics (horizontal) with classification accuracy (vertical). (d) Distribution of potential standardization metrics segregated by cell state. (e) BgSD for ten experiments conducted with different calibrations. Dotted red line indicates BgSD threshold. (f) Classification accuracy improvement after controlling for BgSD in experiments from e. (g) BgSD over time from 49 image series taken continuously without calibration across 17 different experiments (standard deviation of mean). Dotted red line indicates BgSD threshold. Plots c-f are based on ~24,000 cells across 10 experiments.
Figure 3
Figure 3
Kinetic high depth screen of kinase inhibitors. (a) Example rocket plots of five representative cells over six conditions. Each horizontal line represents a single cell over time, where thickness correlates with microns moved since previous hour, colorimetric represents confidence of cell state based on morphology, and horizontal bars represent cell division or death. (b) Heatmap depicting clustering of compounds by four super-metrics derived from rocket plots, normalized to the mean value of all conditions (see Methods). Targeted BRAF compounds (green), MEK inhibitors (orange), Bcr-Abl (red) and cell cycle inhibitors (yellow) are highlighted. Compounds dissolved in DMSO are underlined. Based on observation of 775 cells across 17 different treatment conditions. (c) Average accuracy of control conditions (Staurosporine, PD0332991, and not treated) at indicated time points. Accuracy peaks at 24 hours (the time-point the experiments used to train the classifier were captured) and drops after 40 hours.
Figure 4
Figure 4
Methods and tools for conducting single cell classification with DHC. Step 1 is recommended for validating and optimizing a DHM platform prior to classification. Of importance is determining the expected rate of high BgSD images and changes of this rate over time. Step 2 is used to train a classifier to determine expected optimal accuracy. Static or kinetic experiments are then conducted with these parameters, known accuracies and known limitations. Italicized text describes methods developed here or code available upon request.

Similar articles

Cited by

References

    1. Henriksen M, Miller B, Newmark J, Al-Kofahi Y, Holden E. Laser scanning cytometry and its applications: a pioneering technology in the field of quantitative imaging cytometry. Methods Cell Biol. 2011;102:161–205. - PubMed
    1. Taylor, D. L., Haskins, J. R. & Giuliano, K. A. High content screening: a powerful approach to systems cell biology and drug discovery. (Humana Press, 2007).
    1. Laissue PP, Alghamdi RA, Tomancak P, Reynaud EG, Shroff H. Assessing phototoxicity in live fluorescence imaging. Nat Methods. 2017;14:657–661. doi: 10.1038/nmeth.4344. - DOI - PubMed
    1. Tinevez JY, et al. A quantitative method for measuring phototoxicity of a live cell imaging microscope. Methods Enzymol. 2012;506:291–309. doi: 10.1016/B978-0-12-391856-7.00039-1. - DOI - PubMed
    1. Trapnell C. Defining cell types and states with single-cell genomics. Genome Res. 2015;25:1491–1498. doi: 10.1101/gr.190595.115. - DOI - PMC - PubMed

Publication types