

Quantitative characterization of optic nerve atrophy in patients with multiple sclerosis
- PMID: 28932410
- PMCID: PMC5600307
- DOI: 10.1177/2055217317730097
Quantitative characterization of optic nerve atrophy in patients with multiple sclerosis
Abstract
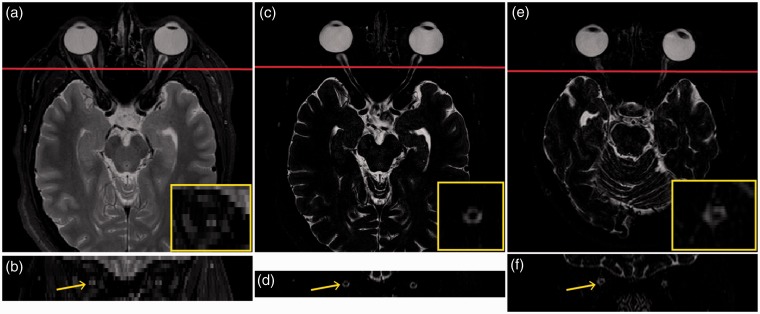
Background: Optic neuritis (ON) is one of the most common presentations of multiple sclerosis (MS). Magnetic resonance imaging (MRI) of the optic nerves is challenging because of retrobulbar motion, orbital fat and susceptibility artifacts from maxillary sinuses; therefore, axonal loss is investigated with the surrogate measure of a single heuristically defined point along the nerve as opposed to volumetric investigation.
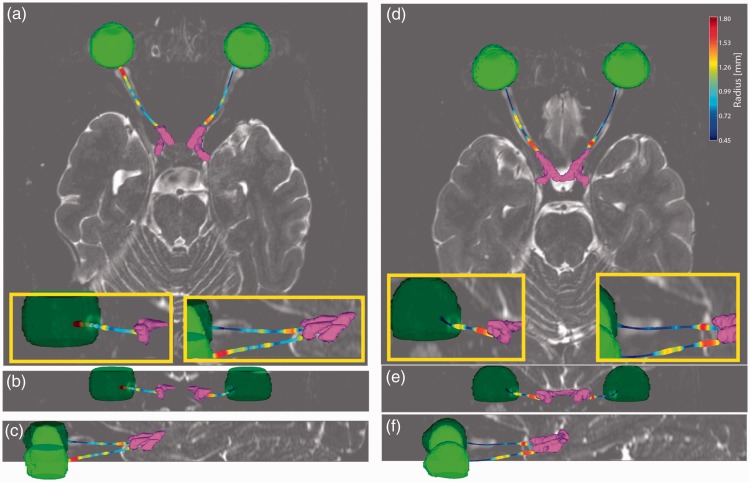
Objective: The objective of this paper is to derive optic nerve volumetrics along the entire nerve length in patients with MS and healthy controls in vivo using high-resolution, clinically viable MRI.
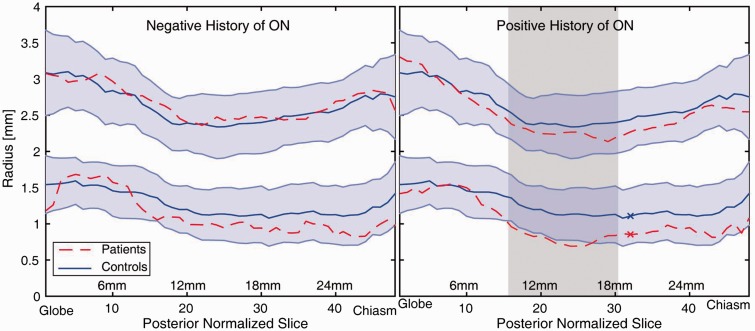
Methods: An advanced, isotropic T2-weighted turbo spin echo MRI was applied to 29 MS patients with (14 patients ON+) or without (15 patients ON-) history of ON and 42 healthy volunteers. An automated tool was used to estimate and compare whole optic nerve and surrounding cerebrospinal fluid radii along the length of the nerve.
Results and conclusion: Only ON+ MS patients had a significantly reduced optic nerve radius compared to healthy controls in the central segment of the optic nerve. Using clinically available MRI methods, we show and quantify ON volume loss for the first time in MS patients.
Keywords: MRI; atrophy; axonal loss; multiple sclerosis.
Figures
Similar articles
-
Optic nerve diffusion changes and atrophy jointly predict visual dysfunction after optic neuritis.Neuroimage. 2009 Apr 15;45(3):679-86. doi: 10.1016/j.neuroimage.2008.12.047. Epub 2009 Jan 7. Neuroimage. 2009. PMID: 19162205
-
Quantifying visual pathway axonal and myelin loss in multiple sclerosis and neuromyelitis optica.Neuroimage Clin. 2016 May 26;11:743-750. doi: 10.1016/j.nicl.2016.05.014. eCollection 2016. Neuroimage Clin. 2016. PMID: 27330974 Free PMC article.
-
Optic nerve imaging in multiple sclerosis.J Neuroimaging. 2007 Apr;17 Suppl 1:42S-45S. doi: 10.1111/j.1552-6569.2007.00136.x. J Neuroimaging. 2007. PMID: 17425734 Review.
-
Magnetic resonance imaging, magnetisation transfer imaging, and diffusion weighted imaging correlates of optic nerve, brain, and cervical cord damage in Leber's hereditary optic neuropathy.J Neurol Neurosurg Psychiatry. 2001 Apr;70(4):444-9. doi: 10.1136/jnnp.70.4.444. J Neurol Neurosurg Psychiatry. 2001. PMID: 11254765 Free PMC article.
-
Advanced MRI of the Optic Nerve.J Neuroophthalmol. 2017 Jun;37(2):187-196. doi: 10.1097/WNO.0000000000000511. J Neuroophthalmol. 2017. PMID: 28459736 Review.
Cited by
-
Automatic segmentation and quantification of the optic nerve on MRI using a 3D U-Net.J Med Imaging (Bellingham). 2023 May;10(3):034501. doi: 10.1117/1.JMI.10.3.034501. Epub 2023 May 15. J Med Imaging (Bellingham). 2023. PMID: 37197374 Free PMC article.
-
Biometry extraction and probabilistic anatomical atlas of the anterior Visual Pathway using dedicated high-resolution 3-D MRI.Sci Rep. 2024 Jan 3;14(1):453. doi: 10.1038/s41598-023-50980-x. Sci Rep. 2024. PMID: 38172589 Free PMC article.
-
Magnetization transfer saturation reveals subclinical optic nerve injury in pediatric-onset multiple sclerosis.Mult Scler. 2023 Feb;29(2):212-220. doi: 10.1177/13524585221137500. Epub 2022 Dec 22. Mult Scler. 2023. PMID: 36545918 Free PMC article.
-
Optic chiasm measurements may be useful markers of anterior optic pathway degeneration in neuromyelitis optica spectrum disorders.Eur Radiol. 2020 Sep;30(9):5048-5058. doi: 10.1007/s00330-020-06859-w. Epub 2020 Apr 26. Eur Radiol. 2020. PMID: 32335748 Free PMC article.
-
Chronic experimental autoimmune encephalomyelitis is an excellent model to study neuroaxonal degeneration in multiple sclerosis.Front Mol Neurosci. 2022 Oct 19;15:1024058. doi: 10.3389/fnmol.2022.1024058. eCollection 2022. Front Mol Neurosci. 2022. PMID: 36340686 Free PMC article. Review.
References
-
- Beck RW, Cleary PA, Anderson MM, Jr, et al. A randomized, controlled trial of corticosteroids in the treatment of acute optic neuritis. N Engl J Med 1992; 326: 581–588. - PubMed
-
- Optic Neuritis Study Group. Visual function 15 years after optic neuritis: A final follow-up report from the Optic Neuritis Treatment Trial. Ophthalmology 2008; 115: 1079–1082.e5. - PubMed
-
- Abalo-Lojo JM, Limeres CC, Gómez MA, et al. Retinal nerve fiber layer thickness, brain atrophy, and disability in multiple sclerosis patients. J Neuroophthalmol 2014; 34: 23–28. - PubMed
-
- Hickman S, Toosy A, Jones S, et al. Serial magnetization transfer imaging in acute optic neuritis. Brain 2004; 127: 692–700. - PubMed
LinkOut - more resources
Full Text Sources
Other Literature Sources
Miscellaneous
