. 2017 Jun 26;2(2):170-179.
doi: 10.1002/btm2.10065. eCollection 2017 Jun.

Impact of cell culture parameters on production and vascularization bioactivity of mesenchymal stem cell-derived extracellular vesicles

Affiliations

Impact of cell culture parameters on production and vascularization bioactivity of mesenchymal stem cell-derived extracellular vesicles

Divya B Patel et al. Bioeng Transl Med. .

Abstract

Mesenchymal stem cell (MSC)-derived extracellular vesicles (EVs) have emerged as potential therapeutic agents for numerous applications. EVs offer potential advantages over cell-based therapies with regard to safety, stability and clearance profiles, however production and potency limitations must be addressed to enable eventual translation of EV-based approaches. Thus, we sought to examine the role of specific cell culture parameters on MSC EV production and bioactivity toward informing rational design parameters for scalable EV biomanufacturing. We report significantly reduced MSC EV vascularization bioactivity, as measured by an endothelial cell gap closure assay, with increasing passage in culture by trypsinization, especially beyond passage 4. We further show that increased frequency of EV collection yielded higher numbers of EVs from the same initial number of MSCs over a 24 hr period. Finally, we demonstrate that decreased cell seeding density in culture flasks resulted in increased production of EVs per cell in MSCs and other cell types. Overall, these studies highlight the need for careful consideration of the parameters of cell passage number and cell seeding density in the production of therapeutic EVs at laboratory scale and for rational design of large-scale EV biomanufacturing schemes.

Keywords: EVs; biomanufacturing; exosomes; mesenchymal stem cells; therapeutic angiogenesis.


Figures

Figure 1
Figure 1
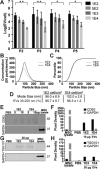
Effect of cell passage on EV characteristics. (A) Concentration and (B) size distribution of Evs isolated from MSCs at different passages (P2–P5) as assessed by NTA. (C) Mode size (diameter) and percentage of EVs measuring between 30 and 200 nm (corresponding to the size range typically defined for exosomes) from MSCs at each passage. Data are representative of three independent experiments (n = 3); statistical difference in mode diameter was calculated for P2 versus P5 and P4 versus P5 (p < .05); no statistical difference (p > .05) was found in EV concentration using one‐way ANOVA with Tukey's multiple comparison test. (D) Immunoblot analysis of exosomal marker CD63 and cellular protein marker GAPDH was conducted for EVs from each MSC passage at 5 and 10 μg of EVs per lane (based on bicinchoninic acid (BCA) analysis of EV surface protein content) and 2.5 μg of MSC lysate (total MSC cellular protein; positive control). PBS was used as a negative control. (E) ImageJ quantification of pixel densities in (D). (F) Immunoblot analysis of exosomal marker TSG101 and cellular protein marker GAPDH was conducted for EVs from each MSC passage at 20 μg of EVs per lane (based on BCA analysis of EV surface protein content) and 2.5 μg of MSC lysate (total MSC cellular protein; positive control). PBS was used as a negative control. (G) ImageJ quantification of pixel densities in (F)
Figure 2
Figure 2
Impact of cell passage on MSC‐derived EV vascularization bioactivity. (A) HDMECs were stimulated with EGM2 medium (growth medium; positive control), EBM2 medium (basal medium; negative control) or 200 μg/ml EVs isolated from MSCs at the indicated passages. Representative images captured at 0 and 20 hr are shown. (B) ImageJ analysis of cell gap area at 20 hr relative to the gap area at 0 hr (gap area depicted with white dotted lines). Data are representative of three independent experiments with three replicates each (n = 3). Statistical comparisons determined by two‐way ANOVA with Tukey's multiple comparison tests are shown
Figure 3
Figure 3
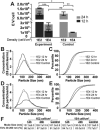
Lower cell seeding density leads to increased EV production rate. (A) MSCs at different passages were seeded at varying initial cell densities (1E2, 5E2, 1E3, and 1E4 cells/cm2). Isolated EVs were quantified using NTA and normalized to obtain number of EV produced per cell (EVs/cell). Data are representative of three independent studies (n = 3); no significant differences in EV production were calculated between passages. Significant difference was calculated between 1E2 and 1E4 cells/cm2 seeding densities for all passages using two‐way ANOVA with Tukey's multiple comparison test (*p < .05, (**p < .01). (B) Concentration and (C) size distribution percentiles of EVs derived from MSCs seeded at 1E2 or 1E4 cells/cm2 was determined by NTA. (D) The mode size and EV percentiles for each seeding density EV group are shown. Data are representative of three independent trials (n = 3); no significant difference in mode EV diameter was calculated between two densities using unpaired t test with Welch's correction. (E) Immunoblot analysis of exosomal marker CD63 and cellular protein marker GAPDH for EVs from each MSC seeding density at 5 and 10 μg (based on BCA analysis of EV surface protein content) of EVs and 2.5 μg of MSC lysate (total MSC cellular protein; positive control). PBS was used as a negative control. (F) ImageJ quantification of pixel densities in (E). (G) Immunoblot analysis of exosomal marker TSG101 and cellular protein marker GAPDH for EVs from each MSC seeding density at 20 μg (based on BCA analysis of EV surface protein content) of EVs and MSC lysate (total MSC cellular protein; positive control). PBS was used as a negative control. (H) ImageJ quantification of pixel densities in (G)
Figure 4
Figure 4
Validation of cell seeding density effects on EV production using CD63‐specific ELISA. (A) Calibration curves for the number of EV particles versus OD450 reading of exosomal CD63 standard or P4 MSCderived EVs. Equations for the line of best fit were determined using linear regression analysis. R 2 values for CD63 standard and P4 MSC EVs was calculated to be 0.945 and 0.955, respectively. (B) Numbers of EV particles present in isolated EV samples derived from different passage MSCs seeded at 1E2 or 1E4 cells/cm2 were determined based on the CD63 standard curve in (A). EV numbers were normalized per cell and the values were compared to NTA data shown in Figure 3a. Data are representative of three independent experiments with three replicates (n = 3); statistical significance in EV/cell amount between 1E2 cell/cm2 and 1E4 cell/cm2 densities was calculated using two‐way ANOVA with Tukey's multiple comparison test (*variance in density EVs for ELISA data; # variance in density EVs for NTA data) (#p < .05; ** or ##p < .01; ***p < .001; ****p < .0001)
Figure 5
Figure 5
MSC EV vascularization bioactivity does not vary with cell density. (A) HDMECs were stimulated with EGM2 medium (growth medium; positive control), EBM2 medium (basal medium; negative control) or 50 or 200 μg/ml EVs isolated from passage three MSCs seeded at the indicated densities. Representative images captured at 0 and 20 hr are shown. (B) ImageJ analysis of cell gap area at 20 hr relative to the gap area at 0 hr (gap area depicted with white dotted lines). Data represent three independent experiments with three replicates each (n = 3); no statistical difference was observed between EVs from MSCs seeded at either density at either concentration using two‐way ANOVA with Tukey's multiple comparison test (ns p > .05, ****p < .0001)
Figure 6
Figure 6
Increased frequency of media collection increases total MSC EV production. (A) NTA quantification of total EVs per cell produced when conditioned media was collected once at 24 hr (control) or twice at 12 and 24 hr (experiment) from MSCs seeded at either 1E2 or 1E4 cells/cm2. Data represent three individual experiments (n = 3); no significant difference in EV production was calculated between the 12 and 24 hr collection for the “experiment” at each density, nor between the cumulative accumulations for the experimental and control groups at the 1E4 cells/cm2 seeding density (ns p > .05). Data were analyzed using a two‐way ANOVA with Tukey's multiple comparison analysis (*p < .05, **p < .01, ***p < .001). (B) EV concentration and (C) size distribution was determined by NTA for 1E2 cell/cm2 experiment and control. (D) EV concentration and (E) size distribution as determined by NTA are as shown for 1E4 cell/cm2 experiment and control. (F) Mode size (diameter) and percentage of EVs measuring between 30 and 200 nm (corresponding to the size range typically defined for exosomes) from MSCs at each cell seeding density. Data are representative of three independent trials (n = 3); no statistical difference in mode diameter was calculated for any group using one‐way ANOVA with Tukey's multiple comparison test (p > .05)
Figure 7
Figure 7
Variance of EV production with cell seeding density is conserved across multiple cell types. NTA quantification of EVs per cell produced by (A) HDMECs, (B) HEK cells, and (C) HUVECs seeded at 1E2, 1E3, 1E4, and 1E5 cells/cm2. Data are representative of three individual experiments (n = 3); significant differences in EV production at each seeding density were calculated using one‐way ANOVA with Tukey's multiple comparison test (*p < .05; **p < .01; ****p < .0001)

Similar articles

Cited by

References

    1. Gnecchi M, Zhang Z, Ni A, Dzau VJ. Paracrine mechanisms in adult stem cell signaling and therapy. Circ Res. 2008;103(11):1204–1219. doi:10.1161/CIRCRESAHA.108.176826. - DOI - PMC - PubMed
    1. Gnecchi M, Danieli P, Malpasso G, Ciuffreda MC. Paracrine mechanisms of mesenchymal stem cells in tissue repair In: Gnecchi M, ed. Mesenchymal Stem Cells: Methods and Protocols. New York, NY: Springer New York; 2016:123–146. doi:10.1007/978-1-4939-3584-0_7. - DOI - PubMed
    1. Huang S, Wu Y, Gao D, Fu X. Paracrine action of mesenchymal stromal cells delivered by microspheres contributes to cutaneous wound healing and prevents scar formation in mice. Cytotherapy. 2017;17(7):922–931. doi:10.1016/j.jcyt.2015.03.690. - DOI - PubMed
    1. Hwang H, Kloner RA. Improving regenerating potential of the heart after myocardial infarction: factor‐based approach. Life Sci. 2010;86(13–14):461–472. doi:10.1016/j.lfs.2010.01.004. - DOI - PubMed
    1. Simons M, Annex BH, Laham RJ, et al. Pharmacological treatment of coronary artery disease with recombinant fibroblast growth factor‐2. Circulation. 2002;105(7):788–793. doi:10.1161/hc0802.104407. - DOI - PubMed