. 2017 Sep 20;2017(1):10.
doi: 10.1186/s13637-017-0063-3.

Learning directed acyclic graphs from large-scale genomics data

Affiliations

Learning directed acyclic graphs from large-scale genomics data

Fabio Nikolay et al. EURASIP J Bioinform Syst Biol. .

Abstract

In this paper, we consider the problem of learning the genetic interaction map, i.e., the topology of a directed acyclic graph (DAG) of genetic interactions from noisy double-knockout (DK) data. Based on a set of well-established biological interaction models, we detect and classify the interactions between genes. We propose a novel linear integer optimization program called the Genetic-Interactions-Detector (GENIE) to identify the complex biological dependencies among genes and to compute the DAG topology that matches the DK measurements best. Furthermore, we extend the GENIE program by incorporating genetic interaction profile (GI-profile) data to further enhance the detection performance. In addition, we propose a sequential scalability technique for large sets of genes under study, in order to provide statistically significant results for real measurement data. Finally, we show via numeric simulations that the GENIE program and the GI-profile data extended GENIE (GI-GENIE) program clearly outperform the conventional techniques and present real data results for our proposed sequential scalability technique.

Keywords: Big data; Discrete optimization; Genetic interaction analysis; Graph learning; Large-scale gene networks; Multiple hypothesis test.


Figures
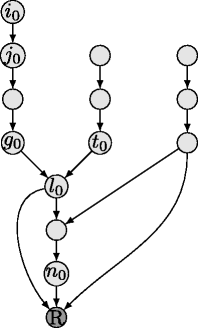
Fig. 1
Fig. 1
DAG D0 of 13 genes and root node R
Fig. 2
Fig. 2
Possible hierarchical relationship classes between two arbitrary genes i,j of DAG D according to [2]
Fig. 3
Fig. 3
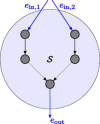
Example SMAP S
Fig. 4
Fig. 4
Schematically reduced DAGs D1 to D5 corresponding to Eqs. (5a)–(5e), respectively
Fig. 5
Fig. 5
Left: Original DAG Da with corresponding set of hierarchical relationship classes ADa. Right: Reconstruction D^a of DAG Da based on ADa
Fig. 6
Fig. 6
Example DAG DR to elucidate the functionality of the RHS of condition ER of Table 2
Fig. 7
Fig. 7
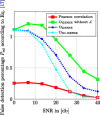
D ed versus SNR; t corr=0.6; 200 Monte Carlo runs; λ d=0.05, λ c=1, λ p=0.8
Fig. 8
Fig. 8
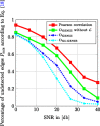
D mis versus SNR; t corr=0.6; 200 Monte Carlo runs; λ d=0.05, λ c=1, λ p=0.8
Fig. 9
Fig. 9
Reliability matrix M G; S=5e 4 subsets considered; subset size N S=10
Fig. 10
Fig. 10
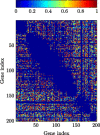
Reliability matrix M GI; S=5e 4 subsets considered; subset size N S=10; λ d=1e3, λ c=1, λ p=0.85

References

    1. A Shojaie, G Michailidis, Discovering graphical Granger causality using the truncating lasso penalty. 26 ECCB 2010:, i517–i523 (2010). Department of Statistics, University of Michigan, ECCB, Vol.26. - PMC - PubMed
    1. Battle A, Jonikas MC, Walter P, Weissman JS, Koller D. Automated identification of pathways from quantitative genetic interaction data. Mol.Syst. Biol. 2010;6:379–391. doi: 10.1038/msb.2010.27. - DOI - PMC - PubMed
    1. Tong AHY, et al. Systematic genetic analysis with ordered arrays of yeast deletion mutants. Science. 2001;294:2364–2368. doi: 10.1126/science.1065810. - DOI - PubMed
    1. Snijder B, Liberali P, Frechin M, Stoeger T, Pelkmans L. Predicting functional gene interactions with the hierarchical interaction score. Nat. Methods. 2013;10(11):1089–1094. doi: 10.1038/nmeth.2655. - DOI - PubMed
    1. Baryshinkova A, et al. Quantitative analysis of fitness and genetic interactions in yeast on a genome scale. Nat. Methods. 2010;7:1017–1024. doi: 10.1038/nmeth.1534. - DOI - PMC - PubMed

LinkOut - more resources